
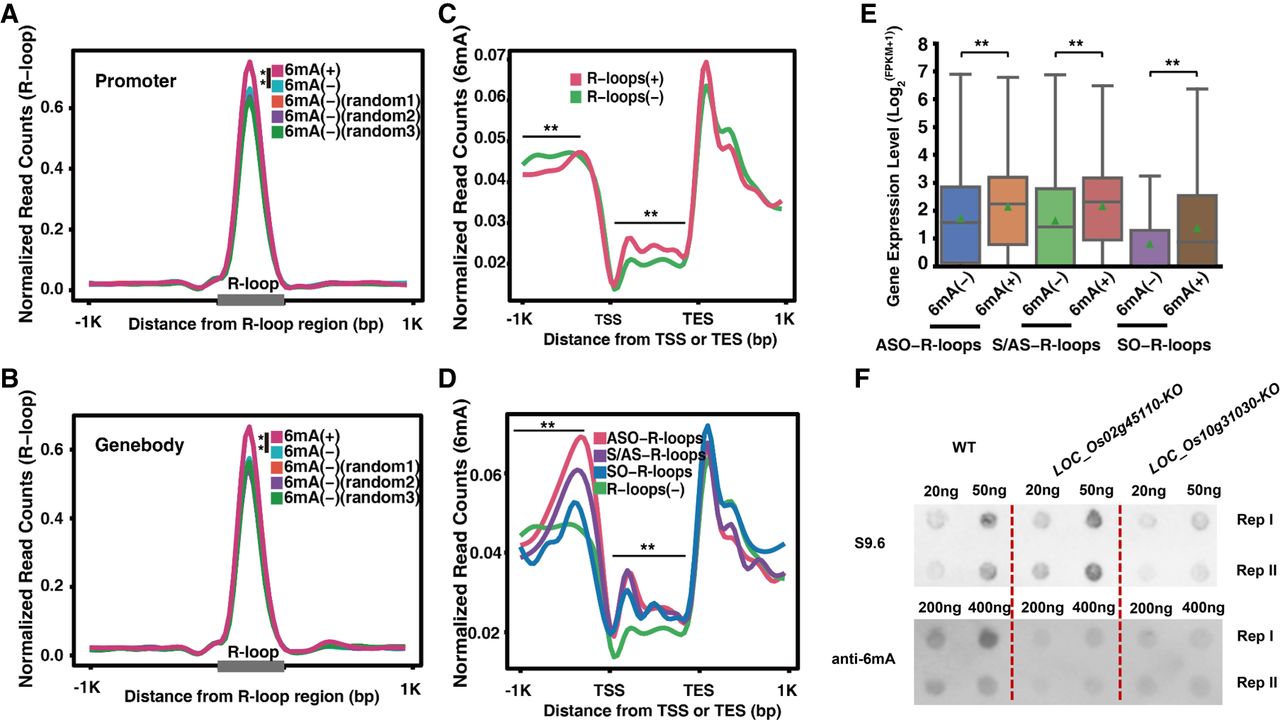
The relationships among DNA 6mA, R-loops, and gene expression. (A) Distribution of normalized read counts for R-loops with 6mA (+) or/without 6mA (−) and ±1-kb flanking regions when R-loops in promoters. (B) As in A, except R-loops in gene bodies. Each random set in both A and B contained the same number of R-loops as those contained in the 6mA+ or 6mA− sets. (C) Distribution of normalized read counts in genes with 6mA+ that overlapped R-loops or non-R-loops. Regions from 1 kb upstream of TSSs and 1 kb downstream from TESs of these genes are shown. (D) Distribution of normalized read counts in genes with 6mA+ that overlapped three types of R-loops or without R-loops. (E) Box plots showing the median (black lines) and average (green triangles) expression levels of genes with 6mA (6mA+) or without 6mA (6mA−) that overlapped different types of R-loops. Significance was determined using the Wilcoxon rank-sum test. (**) P-values < 0.01. (F) The dot blotting assays with anti-S9.6 and anti-6mA antibodies. Each sample had two technical repeats per blot. Dot signals were cut from the original blot that can be found in Supplemental Figure S10.


