
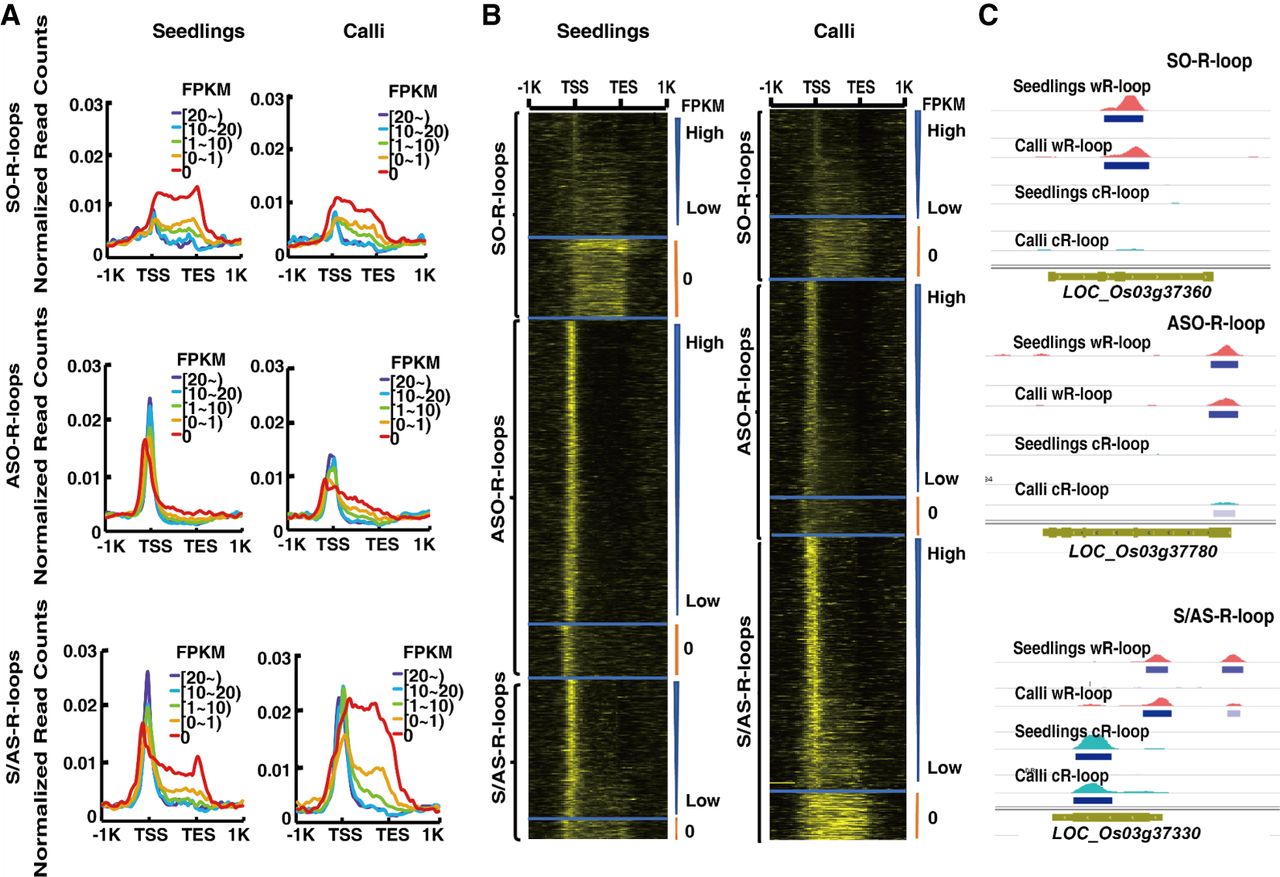
The relationship between R-loops and expression levels of non-TE genes. (A) Curve plots showing the distribution of R-loop read densities from 1 kb upstream of the TSS to 1 kb downstream from the TES. Genes with each type of R-loops (SO-, ASO-, S/AS-R-loops) were classified into one of five bins based on their FPKM values (0, 0–1, 1–10, 10–20, and more than 20). (B) Heatmap showing the distribution of R-loop read counts from 1 kb upstream of the TSS to 1 kb downstream from the TESs of genes that were arranged in descending order based on FPKM values. The transition from black to yellow corresponds to R-loop read intensities from low to high levels. (C) Representative genic loci associated with SO-R-loops, ASO-R-loops, and S/AS-R-loops, respectively.


