
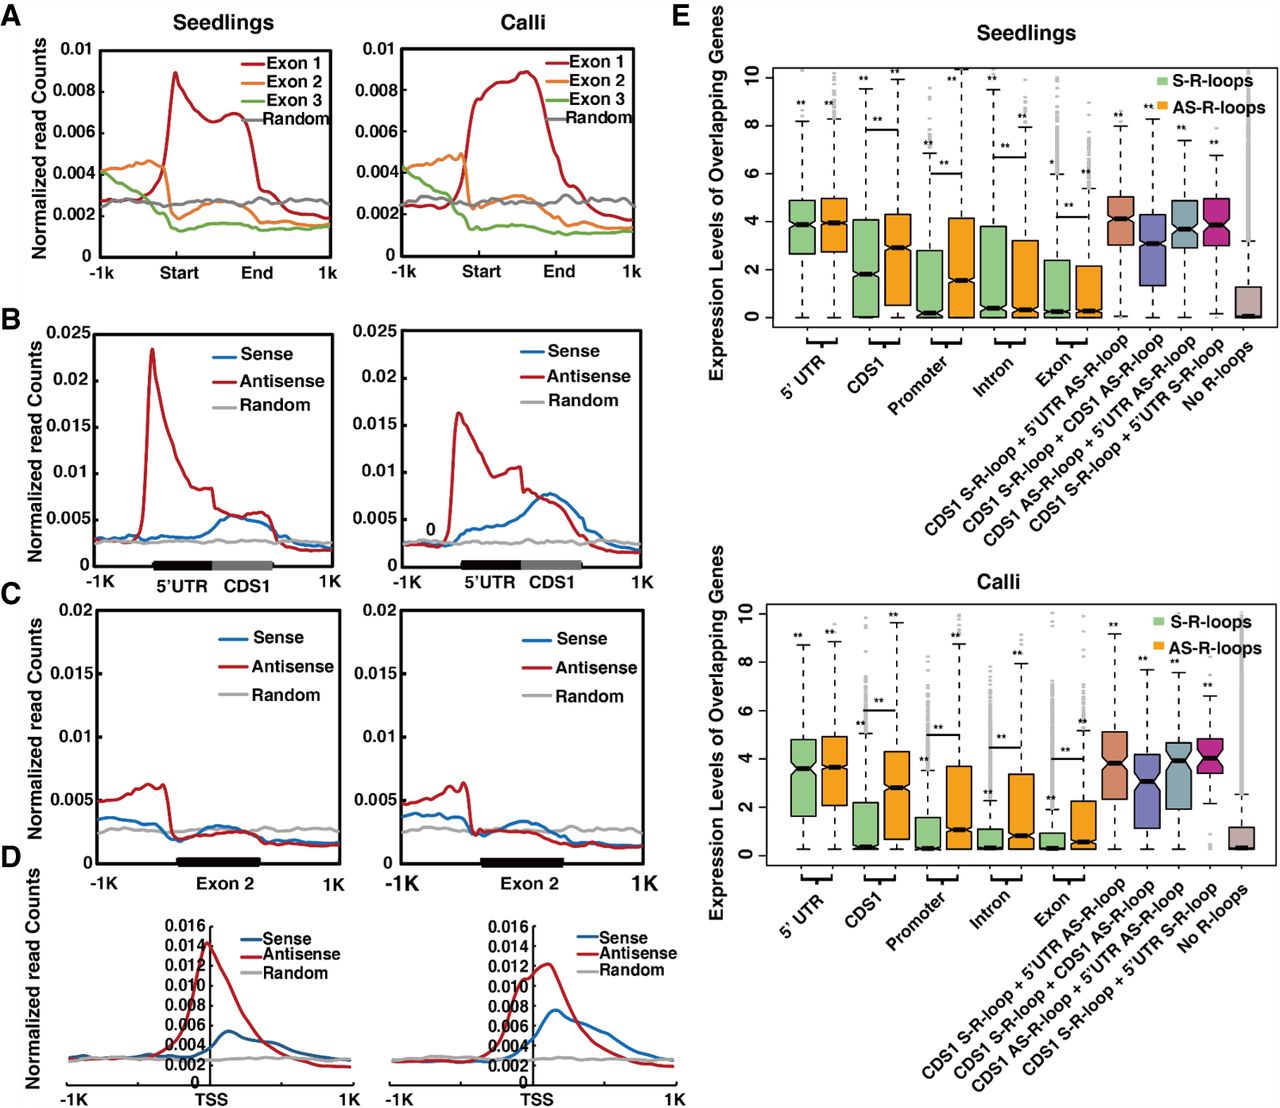
Genic distribution of R-loops and their effects on gene expression. (A) Distribution of R-loop read densities in the first three exons (Exon 1, 2, and 3) and ±1-kb flanking regions in seedlings and calli. (B) Distribution of S- and AS-R-loop read densities around 5′ UTRs, CDS1s, and ±1-kb flanking regions in seedlings and calli. (C) Distribution of S- and AS-R-loop read densities around Exon 2 and ±1-kb flanking regions in seedlings and calli. (D) Distribution of S- and AS-R-loop read densities within ±1 kb of TSSs in seedlings and calli. Ten thousand shuffled genic loci were used as the random control. (E) Boxplots displaying the expression levels of genes with R-loops in different subgenic regions. Green and orange boxes represent genes with only one S- or AS-R-loop, respectively. (CDS1 S-RL + 5′ UTR AS-RL) One S-R-loop in the first CDS and one AS-R-loop in the 5′ UTR; (CDS1 S-RL + CDS1 AS-RL) one S-R-loop and one AS-R-loop in first CDS; (CDS1 AS-RL + 5′ UTR AS-RL) one AS-R-loop in the first CDS and another one in the 5′ UTR region; (CDS1 S-RL + 5′ UTR S-RL) one S-R-loop in the first CDS and another one in the 5′ UTR region. P-value < 0.05 (*) and P-value < 0.01 (**) were determined by the Wilcoxon rank-sum test.


