
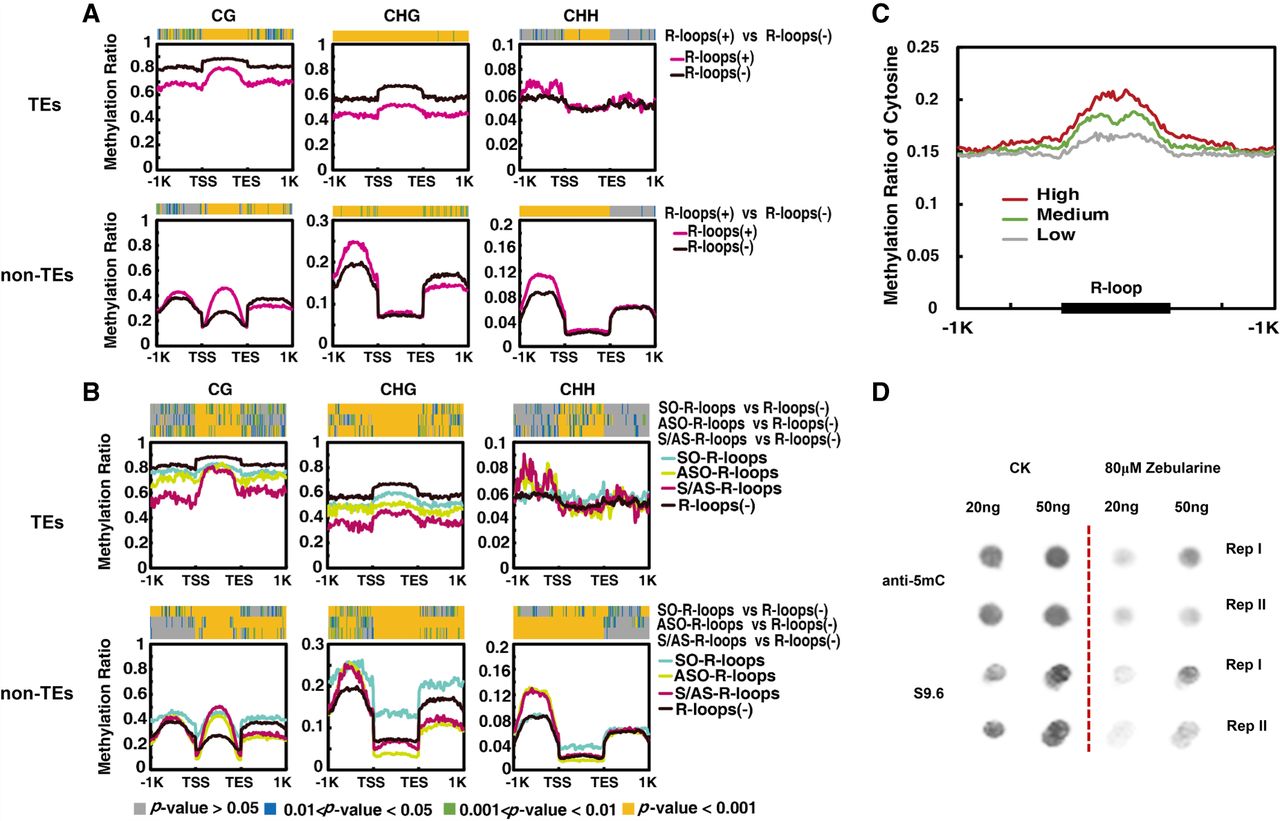
CG, CHG, and CHH methylation levels in TEs and non-TE genes in relation with R-loops. (A) Average ratios of CG, CHG, and CHH methylation between the TSS and TES and in ±1-kb flanking regions. Methylation ratios are shown with light red or black lines corresponding to genes with or without R-loops, respectively. The window size in flanking regions was 20 bp, and gene-body regions were equally divided into 50 bins for calculation of DNA methylation rates. The colored strips at the top of each plot reflect P-values from the Wilcoxon rank-sum test. Gray bands represent P-values > 0.05; blue bands, 0.05 < P-values < 0.01; green bands, 0.001 < P-values < 0.01; and yellow bands, P-values < 0.001. (B) As in A, except methylation ratios are shown with cyan, yellow, red, and black lines when the genes have SO-R-loops, ASO-R-loops, S/AS-R-loops, or no R-loops, respectively. (C) R-loop peak levels (high, medium, or low) and their corresponding total cytosine methylation ratios in rice. The window size in flanking regions was 20 bp, and all R-loop peaks were equally divided into 50 bins for calculating DNA methylation rates. (D) Dot blotting assays of normal and zebularine-treated plants with anti-5mC and anti-S9.6 antibodies. Each sample had two technical repeats in each blot. Dot signals were cut from the original blot that can be found in Supplemental Figure S10. Zebularine is known as a methylation inhibitor.


