
A probabilistic method for testing and estimating selection differences between populations
- 1Chinese Academy of Sciences Key Laboratory of Computational Biology, Chinese Academy of Sciences–Max Planck Society Partner Institute for Computational Biology, Shanghai Institutes for Biological Sciences, Chinese Academy of Sciences, Shanghai 200031, China;
- 2State Key Laboratory of Genetic Engineering and Ministry of Education Key Laboratory of Contemporary Anthropology, Collaborative Innovation Center for Genetics and Development, School of Life Sciences, Fudan University, Shanghai 200433, China
- Corresponding authors: lijin{at}fudan.edu.cn, yunganghe{at}picb.ac.cn
Abstract
Human populations around the world encounter various environmental challenges and, consequently, develop genetic adaptations to different selection forces. Identifying the differences in natural selection between populations is critical for understanding the roles of specific genetic variants in evolutionary adaptation. Although numerous methods have been developed to detect genetic loci under recent directional selection, a probabilistic solution for testing and quantifying selection differences between populations is lacking. Here we report the development of a probabilistic method for testing and estimating selection differences between populations. By use of a probabilistic model of genetic drift and selection, we showed that logarithm odds ratios of allele frequencies provide estimates of the differences in selection coefficients between populations. The estimates approximate a normal distribution, and variance can be estimated using genome-wide variants. This allows us to quantify differences in selection coefficients and to determine the confidence intervals of the estimate. Our work also revealed the link between genetic association testing and hypothesis testing of selection differences. It therefore supplies a solution for hypothesis testing of selection differences. This method was applied to a genome-wide data analysis of Han and Tibetan populations. The results confirmed that both the EPAS1 and EGLN1 genes are under statistically different selection in Han and Tibetan populations. We further estimated differences in the selection coefficients for genetic variants involved in melanin formation and determined their confidence intervals between continental population groups. Application of the method to empirical data demonstrated the outstanding capability of this novel approach for testing and quantifying differences in natural selection.
When anatomically modern humans emerged from Africa (Mellars 2006) and subsequently colonized throughout the world (Hellenthal et al. 2008; Mellars et al. 2013), they encountered many challenges, including essential environmental alterations, food resource shifts, and infectious diseases (Hancock et al. 2010, 2011; Leffler et al. 2013). The current large size and wide distribution of modern human populations demonstrate the evolutionary success of human beings, which intrigues and attracts geneticists to investigate the natural selection and genetic adaptation of human populations. Studies of natural selection, especially directional selection, focus mainly on beneficial heritable traits and related genetic alterations (Williams 2008; Fu and Akey 2013). In recent years, genetic alterations under directional selection have attracted more attention than ever before. Consequently, some highly irregular genetic variants were discovered and further explored using various approaches (Sabeti et al. 2006, 2007; Grossman et al. 2010; Bhatia et al. 2011; Xu et al. 2011; Kamberov et al. 2013; Vitti et al. 2013; Xiang et al. 2013).
Directional selection usually involves genetic adaptation to local environments. Comparison of selection differences between populations is therefore important in genetic studies of directional selection. Differences in allele frequencies are indicators of possible selection differences between populations. As a measure of frequency difference, genetic distance, such as FST, is the most popular statistic in studies of natural selection (Lewontin and Krakauer 1973; Akey et al. 2002). The two-dimensional site frequency spectrum (2D-SFS) method was also designed to compare frequency differences between populations and thus to identify selection differences (Nielsen et al. 2009). Selection differences can also be detected by comparing selective sweeps in different populations, such as cross-population extended haplotype homozygosity (XP-EHH) and cross-population composite likelihood ratio methods (XP-CLR) (Sabeti et al. 2007; Chen et al. 2010). Unfortunately, these methods lack efficient strategies to identify statistical outliers from the “background noise” of genetic drift. Theoretical distributions of these statistics are not known in closed-form expressions. All the methods determine confidence levels based on empirical data distribution or computer simulation with limited prior knowledge of the demographic history (Akey et al. 2002; Sabeti et al. 2007; Nielsen et al. 2009; Chen et al. 2010). Although computer simulation can handle complicated genetic scenarios, it is unlikely that the “real” population genetic history can be accurately represented in computer simulations (Teshima et al. 2006). Furthermore, existing approaches do not provide effective solutions to quantify selection differences between populations.
In this report, we present a probabilistic method for estimating and testing selection differences between populations. The theoretical distribution of the involved statistics is well known and easy to compute. It enables us to conduct strict hypothesis testing without tedious computer simulation. Our approach supplies estimates and their confidence intervals for differences in selection coefficients. To demonstrate the capability of our approach, we conducted statistical hypothesis testing on a whole-genome data set including samples of Han Chinese and Tibetan populations. The results regarding the EPAS1 and EGLN1 genes rejected the null hypothesis and confirmed their significant differences in selection between the populations. We further estimated differences in the selection coefficients between continental populations for genetic variants involved in melanin formation.
Results
Model
In a scenario with two populations, we assumed that populations A and B have the same ancestral population O. For a given locus, we denoted the frequencies of mutated allele in the three populations as pOm, pAm and pBm and frequencies of wild-type allele as pOw pAw and pBw respectively. In a deterministic approximation with selection, the difference of logarithm ratio of frequencies was determined
by divergence time t and selection coefficient s in the populations, say  and
and  Therefore, the difference of selection coefficients with uncertainty can be presented as
 where
where  indicates uncertainty due to genetic drift (for details, see Supplemental Material).
Estimating
Numbers of chromosomes sampling from populations A and B with mutated alleles are denoted CAm and CBm, with those carrying wild-type alleles are denoted as CAw and CBw When population divergence time t is large, the general effect of genetic drift Ω will approximate a normal distribution with mean zero following the central
limit theorem (Feller 1968). The differences in the strength of natural selection between populations A and B can be estimated as
 (1)
where Odds=(CAm CBw)/(CAw CBm). Variance of the estimation could be calculated as
(1)
where Odds=(CAm CBw)/(CAw CBm). Variance of the estimation could be calculated as
 (2)
Consequently, 95% confidence interval of the estimation is determined as
(2)
Consequently, 95% confidence interval of the estimation is determined as 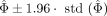 .
.
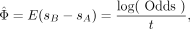
For a neural locus i, we have 
 . Therefore, when a sample has n neural loci and the n is large, the general effect of genetic drift between population A and B can be estimated as
 where the variance of the log-odds ratio could be effectively approximated as var[log(Odds)=1/CAm + 1/CBw + 1/CAw + 1/CBm.
Testing
It is straightforward to propose a statistic for natural selection of a candidate locus, as follows:
 (3)
Under the null hypothesis that differences in natural selection are absent, the statistic δ follows a central χ2 distribution with a degree of freedom = 1. Under the alternative hypothesis with a selection difference, the statistic δ
has a noncentral χ2 distribution with noncentrality parameter
(3)
Under the null hypothesis that differences in natural selection are absent, the statistic δ follows a central χ2 distribution with a degree of freedom = 1. Under the alternative hypothesis with a selection difference, the statistic δ
has a noncentral χ2 distribution with noncentrality parameter  and a degree of freedom = 1.
The aforementioned statistical test for a single candidate locus could be generalized for a scenario with multiple linked
loci to boost its power for detecting differences. We can rewrite the statistic as
 where X is a vector with elements
 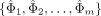 , and Σ is the covariance matrix of the vector with elements
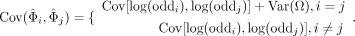
The covariance of two correlated log-odds ratios is given as (Bagos 2012)

The notations for the covariance calculation are defined in Table 1. When testing for multiple linked loci, the statistic δ approximates a central χ2 distribution under the null hypothesis, and the degree of freedom is the same as the number of involved loci (De Maesschalck et al. 2000).
Notations for the covariance calculation
Connection with case-control studies and its statistical power
The theoretical framework presented above bears an intrinsic conceptual and statistical connection with population-based association studies, as presented in Figure 1. The left panel illustrates the conceptual framework of the null hypothesis and alternative hypothesis in a genetic association study with the population stratification described by Devlin et al. (2001). Genetic association studies detect indirect associations between genetic markers (G) and phenotype (Y) that are mediated by correlations between the genetic cause (X) and phenotype (Y). A special approach, such as genomic control (GC), is capable of eliminating sporadic associations due to genetic confounding effects (C). The right panel presents the framework of the null hypothesis and alternative hypothesis in our method. The difference between the panels is that our method focuses on the difference in selection (D) but not phenotype (Y). Our method can distinguish selection differences from genetic background noise (B). GC controls type I errors using an inflation factor λ, while our method considers differences in the genetic background in the variance calculation by introducing Var(Ω) (Equation 2). The GC method remains the same as a regular association test if λ ≈ 1; our method also degenerates to a regular association test if Var(Ω) approximates zero.
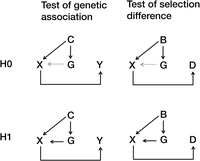
Conceptual framework of statistical tests for an association study and our method. (Left) Conceptual framework of an association study in the presence of population stratification. (Right) Conceptual framework of our method in the same manner. (Top) Conceptual frameworks for the null (H0) hypothesis. (Bottom) Conceptual frameworks of the alternative (H1) hypothesis. Genetic background noise (B), confounding effects (C), difference in selection (D), genetic markers (G), genetic cause (X), phenotype (Y).
As the statistic of our method follows a χ2 distribution, the statistical power of the research design can be conveniently calculated. In this study, with a given difference in selection coefficients of 5.0 × 10⁻³ per generation, we show examples to demonstrate how sample size, genetic drift, and divergence time contribute to the statistical power of our method. Given a population divergence time of 300 generations, our calculation indicates that the statistical power effectively increases with an increase in the sample size (Fig. 2A). With a sample size of 500 chromosomes for each of the paired populations and genetic drift per generation Var(Ω) = 1.0 × 10⁻⁶, the statistical power of our method is as high as 0.98 (Fig. 2A). The power increase, however, is limited with an increase in the sample size when genetic drift is large. With genetic drift per generation Var(Ω) = 5.0 × 10⁻⁵, power is only about 0.20, even if we have a sample size as large as 500 chromosomes for each population (Fig. 2A).
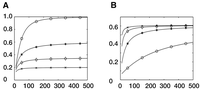
Statistical power of our single-variant method increasing with an increase in the sample size. Statistical power is represented on the y-axis; sizes of the involved haplotypes, on the x-axis. Allele frequency of one population was given to be constant at 0.9, and frequency of the other population was determined by differences in selection coefficients of 5.0 × 10⁻³ per generation and divergence time. (A) Power curve with a constant divergence time of 300 generations is marked by different symbols for different drift variances: (o) Var(Ω) = 1.0 × 10⁻⁶, (*) Var(Ω) = 5.0 × 10⁻⁶, (◊) Var(Ω) = 1.0 × 10⁻⁵, and (x) Var(Ω) = 2.0 × 10⁻⁵. (B) Power curve with constant drift variance Var(Ω) = 5.0 × 10⁻⁶ is marked by different symbols for different divergence times: (o) t = 100 generations, (*) t = 300 generations, (◊) t = 600 generations, and (x) t = 1000 generations.
We also investigated the relationship between the population divergence time and statistical power. The increase in power with an increase in the sample size is prominent when the divergence time of involved populations is small (Fig. 2B, power curve marked by “o” or asterisk). When the divergence time is large, however, an increase in the sample size has only a minor effect on statistical power (Fig. 2B, power curve marked by ◊ or “x”). This could be due to the fact that accumulated genetic drift contributes significantly to the statistic's variance in this scenario. Because our method is based on allele frequencies of individual loci, but not a strict selective sweep, it is especially helpful for studying a “soft sweep.” Other selection sweep–based methods, such as XP-EHH and XP-CLR, cannot work as well without significant linkage disequilibrium. We therefore strongly suggest that both our method and selection sweep–based methods should be applied as complementary methods to selection identification. Furthermore, our method supplies an estimate for differences in selection coefficients, whereas the others do not.
Testing selection differences between Tibetan and Han genomes
We applied our method of hypothesis testing on genotype data of Tibetan and Han Chinese. Because several genetic loci are reported to be involved in adaptation to high altitude, most of these were not further verified by strict hypothesis testing but solely by inspection in simulation-based inference. A QQ plot of our single-variant testing showed that the obtained P-value was well fitted to the expectation (Fig. 3), suggesting that our theoretical model handled genetic divergence of populations well, as least for this example. In particular, population divergence between Han and Tibetan populations did not lead to inflation of the type I error in our hypothesis testing.
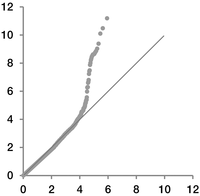
QQ plot of single-variant analysis of Han-Tibetan data. Observed significance levels are represented on the y-axis on a scale of −log10(P-value). Expected quartile is represented on the x-axis on the same scale.
The criterion to declare a genome-wide statistical significance is given by P-value ≤1.0 × 10⁻⁸ in this study. Nineteen variants of the EPAS1 gene have P-values that fit the criterion (Fig. 4A). This observation agrees with previous reports suggesting that the EPAS1 gene plays a major role in the high-altitude adaptation of Tibetan people (Simonson et al. 2010; Peng et al. 2011; Xu et al. 2011). We also conducted our aforementioned multivariant analysis on single nucleotide polymorphism (SNP) bins with different sizes. With a bin size of 5, 10, or 15 SNPs, SNP bins in the EGLN1 gene region showed significant selection differences between the populations in our genome-wide hypothesis testing (Fig. 4B). The power increase was consistent with previous reports that a multivariant analysis could be more powerful than a single-variant approach in statistical tests of genetic data (Akey et al. 2001; He et al. 2011). These results support previous findings that both EPAS1 and EGLN1 genes are critical to high-altitude adaptation of the Tibetan population (Lorenzo et al. 2014). We obtained no positive findings in other gene regions, except for EPAS1 and EGLN1. Other reported candidate genes should be further verified when more genetic data becomes available.
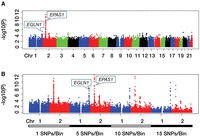
Manhattan plots of significance levels for analysis of Han-Tibetan data. Chromosomes are shown on the x-axis; y-axis shows significance levels in −log10(P). (A) Manhattan plot of single-variant analysis of all autosomes. (B) Manhattan plots of single- and multivariant analysis of Chromosomes 1 and 2. Bin sizes are shown under the x-axis.
Estimating differences in selection
We estimated differences in the selection coefficients for several genetic variants of melanin formation between continental populations (Table 2). In this study, we assumed a simplified stepping stone model with four worldwide population groups (Fig. 5). Selection differences were compared between neighboring groups, while mutated alleles of the ancestral group served as a reference to determine the direction of the selection differences (Equation 1).
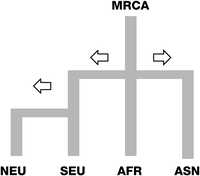
Simplified stepping-stone model of four population groups. Details of genetic demographic history were ignored in the model, such as backward gene flows and genetic admixture, etc. The four continental population groups are North Eurasian (NEU), South Eurasian (SEU), African (AFR), and Asian (ASN). Divergence of African and non-African groups was assumed to be 5000 generations. We further assumed that NEU and SEU have a divergence time of 400 generations.
Candidate sites involved in our estimation
Our estimations and their 95% confidence intervals suggested that most of the involved variants had similar selection coefficients
in south and north Eurasian groups, except variant rs12913832 of the OCA2 gene had an obvious difference  (Fig. 6). For south and north Eurasian groups, 95% confidence intervals of the estimations were larger than those of population-group
pairs involving both African and non-African groups (Fig. 6). This finding indicated that sampling variance contributed to the variance of the estimations of the south and north Eurasian
groups. Therefore, the estimations could be further improved by increasing the sample sizes. Selection coefficients had only
minor differences between Asians and Africans (Fig. 6), suggesting that there are other genetic variants having a critical role in melanin formation in Asians (Edwards et al. 2010). The observed directions of the selection differences suggest that mutated alleles of the variants involved in melanin formation
were more favorably selected in non-African populations (Wilde et al. 2014).
(Fig. 6). For south and north Eurasian groups, 95% confidence intervals of the estimations were larger than those of population-group
pairs involving both African and non-African groups (Fig. 6). This finding indicated that sampling variance contributed to the variance of the estimations of the south and north Eurasian
groups. Therefore, the estimations could be further improved by increasing the sample sizes. Selection coefficients had only
minor differences between Asians and Africans (Fig. 6), suggesting that there are other genetic variants having a critical role in melanin formation in Asians (Edwards et al. 2010). The observed directions of the selection differences suggest that mutated alleles of the variants involved in melanin formation
were more favorably selected in non-African populations (Wilde et al. 2014).
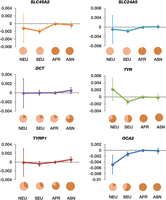
Differences in selection coefficients between population groups. Estimated differences in selection coefficients are represented on the y-axis. Error bars, 95% confidence interval. Estimation for each neighboring group pair is marked by a group name and allele-frequency pie chart of the corresponding descendant group. Frequency of the derived allele is represented by the light color in the pie chart. North Eurasian population (NEU) is a combination of the 1000 Genome populations CEU, FIN, and GBR; South Eurasian population (SEU), a combination of populations IBS and TSI; African population (AFR), combination of populations YRI and LWK; and Asian population (ASN), a combination of populations CHB, CHS, and JPT.
Discussion
We measured the differences in allele frequencies between populations using their logarithm odds ratios. Because genetic association studies usually present the effect size of risk alleles in odds ratios with estimated confidence intervals, this study revealed a statistical connection between our approach and classical genetic association studies. The close connection further allowed us the opportunity to explore natural selection in a genome-wide statistical test. There are other statistics with statistical properties better than logarithm odds ratio, especially when sample size is limited. As we present in this report, however, the logarithm odds ratio is an estimate of differences in the selection coefficient, while the other statistics lack a direct connection with selection difference. Further, performance of logarithm odds ratio was acceptable in the presented case of the Han–Tibetan comparison, demonstrating the merits of logarithm odds ratio. When population divergence is small, variance of our estimate is due mainly to sampling variance but not genetic drift (Equation 2) (Fig. 2). It is therefore possible to significantly improve the power of the statistical test by increasing the sample sizes. In this scenario, the benefit introduced by the large sample size is similar to that in genetic association studies. The statistical power of the hypothesis test using our method can be calculated for a specified study design. This provides a great advantage for determining the technical details of a research design, especially for determining sample sizes. When the evaluated locus is neutral in one of the two involved populations, our method provides estimation for selection coefficient in the rest population.
In our genetic model, the overall effects of demographic impact are summarized by variance in genetic drift (Equation 2). It is therefore unnecessary to separately consider the scale and duration of each demographic event in the analysis. The scales and durations of demographic events of the populations are often unknown, although some consensus has been reached in the research community. Tedious computer simulation is unnecessary in our approach, while simulation is the only way to determine the confidence level in most previous reports. This simulation-free feature is a significant advantage for selection studies because actual population history is unlikely to be accurately represented by computer simulation. It should be noted that our method of modeling genetic drift differs from the Wright-Fisher process. We use total variance Var(Ω) to capture the overall effect of genetic drift but not effective sample sizes.
There are other statistics that measure the differences in allele frequencies between populations, such as FST and ΔDAF. Both FST and ΔDAF have been applied to studies of natural selection (Akey et al. 2002). There is a close relationship between our logarithm odds ratio with FST and ΔDAF. When FST or the absolute value of ΔDAF is larger, we generally have a larger positive or smaller negative logarithm odds ratio. Theoretical distributions of the FST and ΔDAF statistics, however, are not available in straightforward approaches. It therefore hinders their application in testing of selection difference. Furthermore, in the presence of population stratification, there is no convenient approach for quantifying the contribution of natural selection to FST and ΔDAF of individual variants. There lacks a perfect quantitative correlation between the statistics.
In our genetic model, we considered only the mutations that occurred before the population stratification. This assumption holds for most genetic variants of the human genome, given its short evolutionary history. Our method is therefore applicable to populations with limited genetic divergence (Fig. 2). When the frequency of an allele is low and the sample size is small, minor alleles may be missing from the samples. In these cases, we suggested a continuity correction in the calculation of the logarithm odds ratios and the variance (Friedrich et al. 2007). Consequently, differences in selection coefficients may be underestimated in this scenario. This potentially biased estimation could be partially improved in two ways. First, a larger sample size may be helpful for counting the minor allele; second, Bayesian estimation may be helpful for determining the frequency of the missing allele.
To summarize, we developed a probabilistic method for testing and estimating selection differences between populations. This method offers a statistical solution to study directional selection without tedious computer simulation. It is very powerful when the populations under investigation have close genetic connection. This method can be used to quantify differences in selection coefficients but not genotype fitness. Efficient estimation of genotype fitness remains a difficult task when no time-serial data are available.
Methods
Data
Genotype data for 137 Han Chinese and 123 Tibetan unrelated individuals from three previous studies of human high-altitude adaptation were analyzed in this report (Xu et al. 2011; Xing et al. 2013; Wuren et al. 2014). All involved individuals were genotyped using Affymetrix genome-wide human SNP array 6.0. To investigate differences in the selection of genetic variants involved in melanin formation, genotype data of worldwide populations were downloaded from the website of the 1000 Genomes Project (The 1000 Genomes Project Consortium 2010).
Computing
Haplotypes of the individuals were reconstructed using BEAGLE (version 4.0) (Browning and Browning 2007). Other computing works of this report were conducted in R (version 2.14.2) (R Core Team 2015), a free software environment for statistical computing and graphics.
Acknowledgments
We thank three anonymous reviewers for their comments to improve this work. This work was supported by grants from National Natural Science Foundation of China (91331109 and 31171279 to Y.H.; 31271338 and 31330038 to L.J.; 91331204 and 31171218 to S.X.). S.X. was also supported by the Strategic Priority Research Program of the Chinese Academy of Sciences (XDB13040100). L.J. was also supported by Shanghai Leading Academic Discipline Project (B111) and the Center for Evolutionary Biology at Fudan University. Y.H. also thanks the support of the SA-SIBS scholarship program and the Youth Innovation Promotion Association of Chinese Academy of Science.
Footnotes
-
[Supplemental material is available for this article.]
-
Article published online before print. Article, supplemental material, and publication date are at http://www.genome.org/cgi/doi/10.1101/gr.192336.115.
- Received March 22, 2015.
- Accepted October 13, 2015.
This article is distributed exclusively by Cold Spring Harbor Laboratory Press for the first six months after the full-issue publication date (see http://genome.cshlp.org/site/misc/terms.xhtml). After six months, it is available under a Creative Commons License (Attribution-NonCommercial 4.0 International), as described at http://creativecommons.org/licenses/by-nc/4.0/.


