
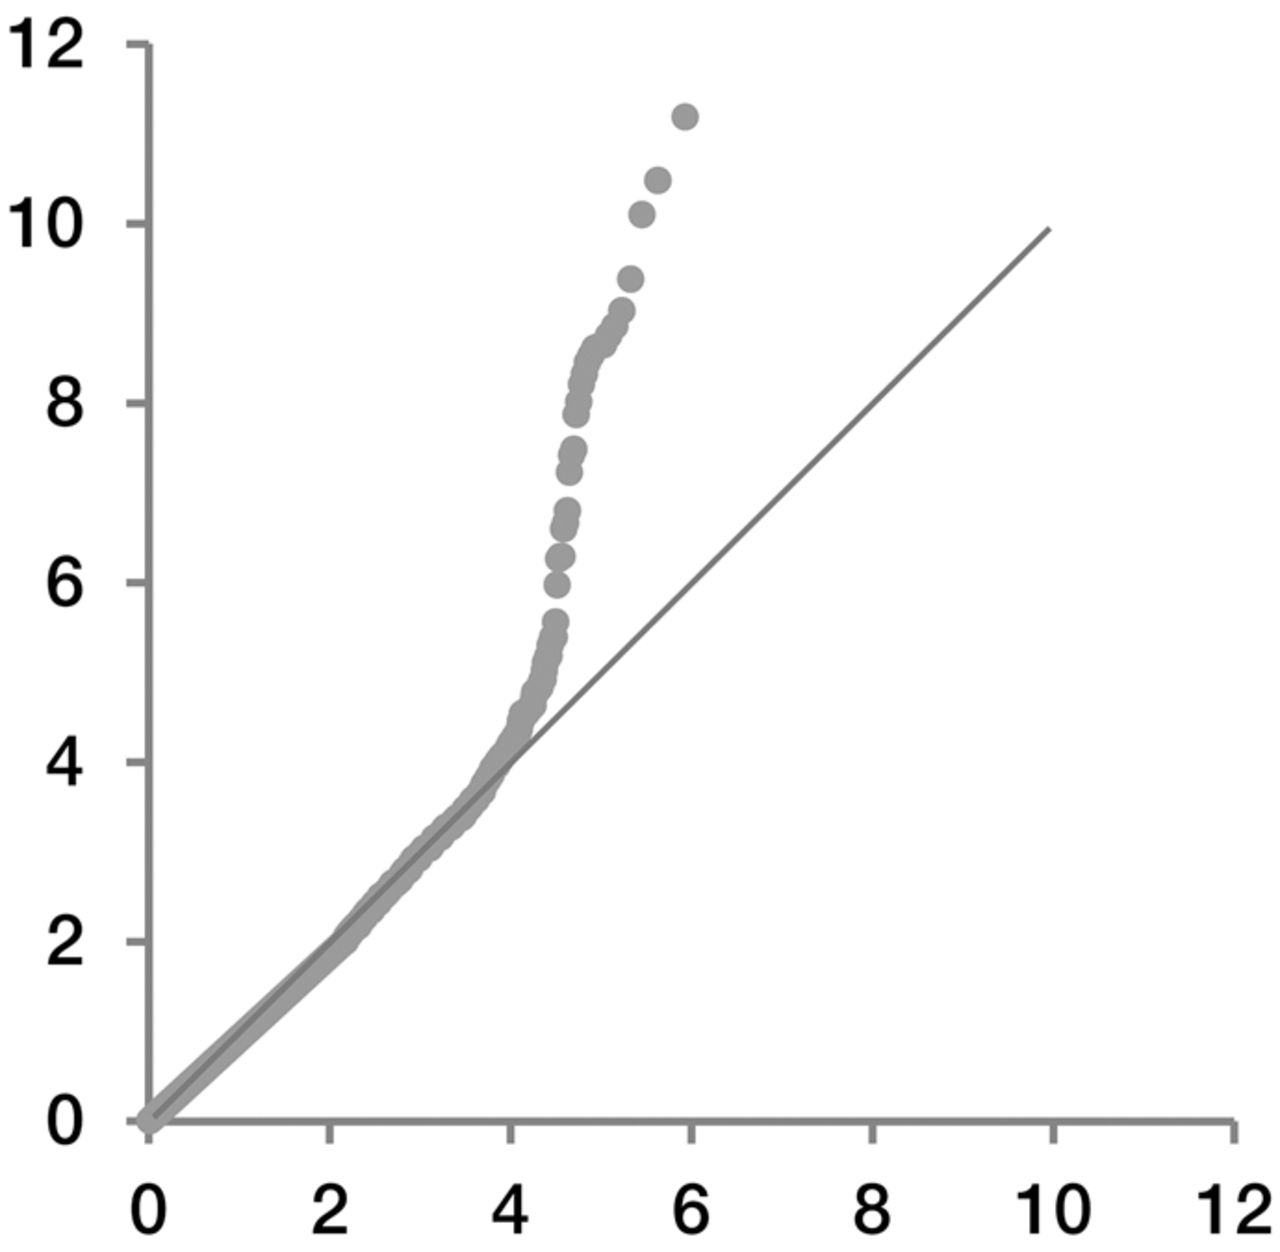
Figure 3.
QQ plot of single-variant analysis of Han-Tibetan data. Observed significance levels are represented on the y-axis on a scale of −log10(P-value). Expected quartile is represented on the x-axis on the same scale.
(Downloading may take up to 30 seconds. If the slide opens in your browser, select File -> Save As to save it.)
Click on image to view larger version.
QQ plot of single-variant analysis of Han-Tibetan data. Observed significance levels are represented on the y-axis on a scale of −log10(P-value). Expected quartile is represented on the x-axis on the same scale.
 CiteULike
 Delicious
 Digg
Digg Facebook
 Google+
 Reddit
 Twitter
