
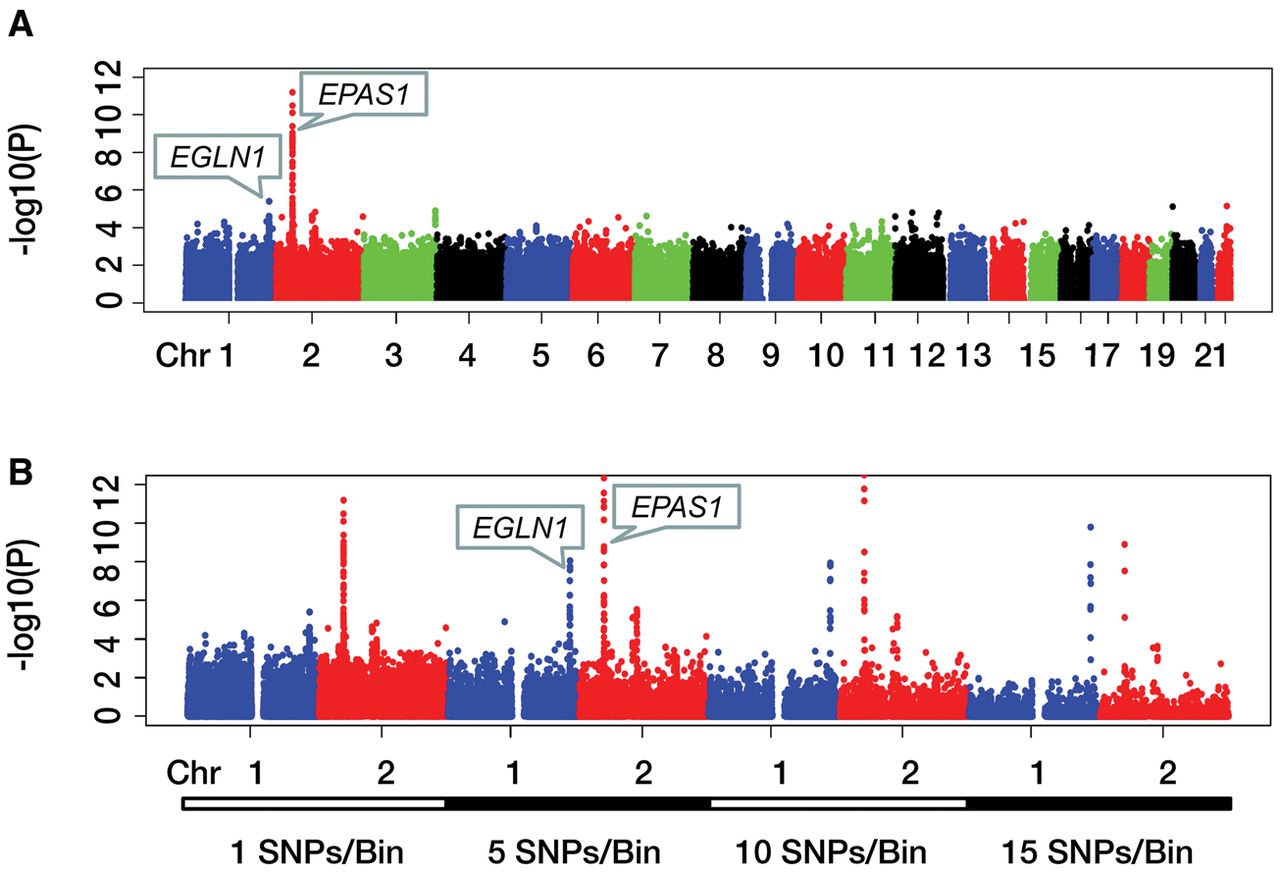
Figure 4.
Manhattan plots of significance levels for analysis of Han-Tibetan data. Chromosomes are shown on the x-axis; y-axis shows significance levels in −log10(P). (A) Manhattan plot of single-variant analysis of all autosomes. (B) Manhattan plots of single- and multivariant analysis of Chromosomes 1 and 2. Bin sizes are shown under the x-axis.


