
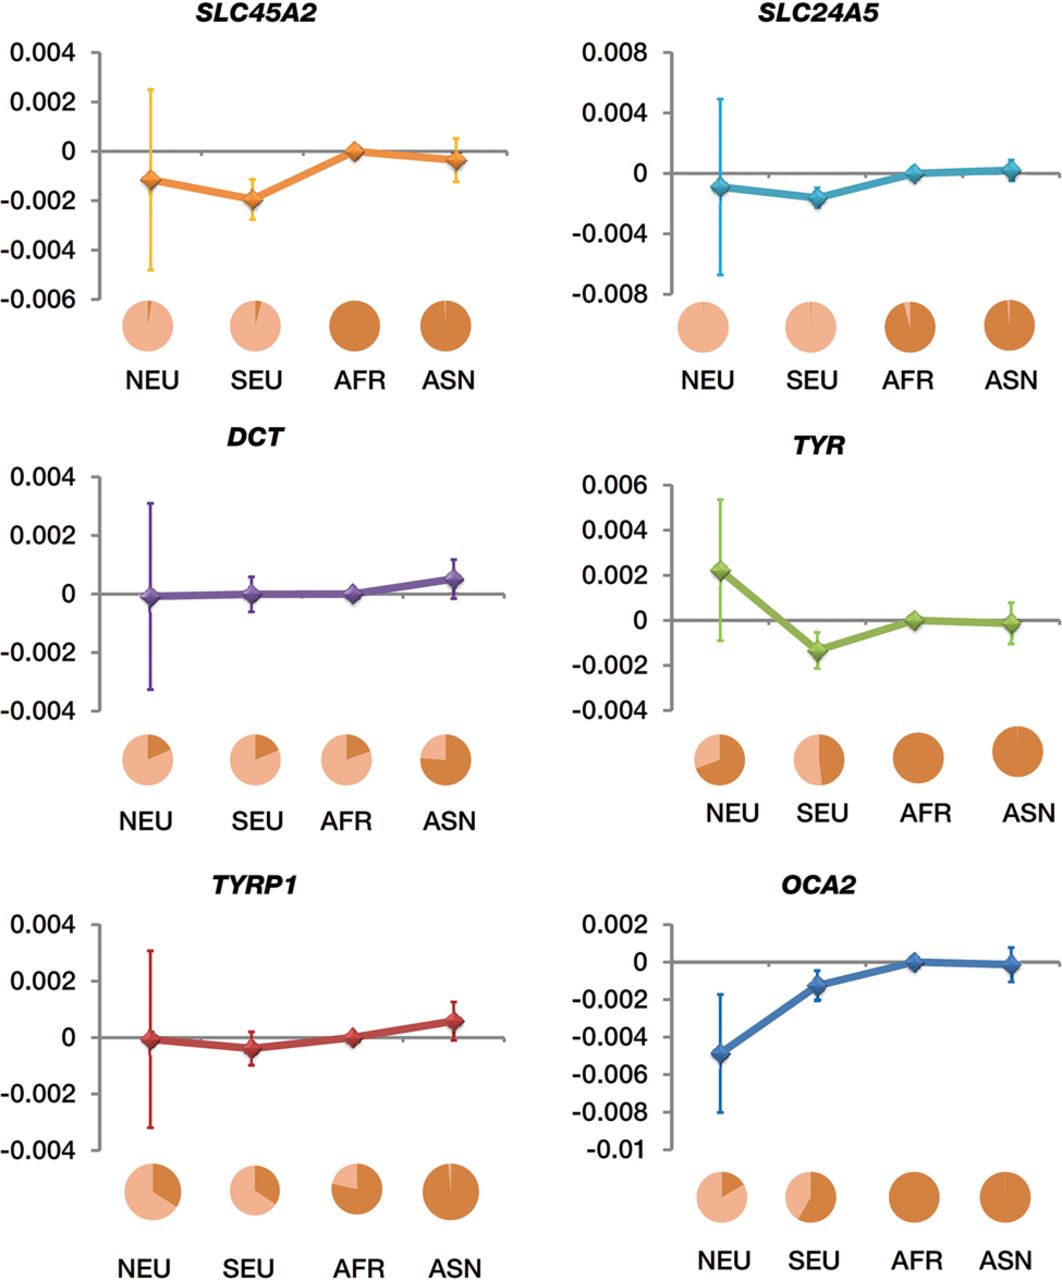
Differences in selection coefficients between population groups. Estimated differences in selection coefficients are represented on the y-axis. Error bars, 95% confidence interval. Estimation for each neighboring group pair is marked by a group name and allele-frequency pie chart of the corresponding descendant group. Frequency of the derived allele is represented by the light color in the pie chart. North Eurasian population (NEU) is a combination of the 1000 Genome populations CEU, FIN, and GBR; South Eurasian population (SEU), a combination of populations IBS and TSI; African population (AFR), combination of populations YRI and LWK; and Asian population (ASN), a combination of populations CHB, CHS, and JPT.


