
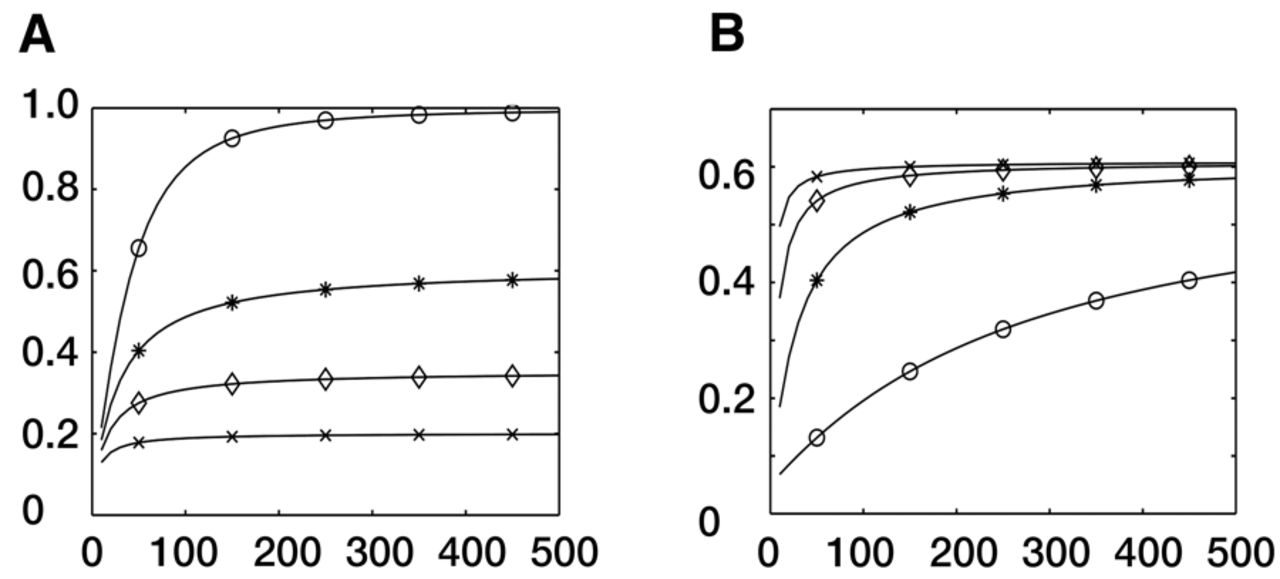
Statistical power of our single-variant method increasing with an increase in the sample size. Statistical power is represented on the y-axis; sizes of the involved haplotypes, on the x-axis. Allele frequency of one population was given to be constant at 0.9, and frequency of the other population was determined by differences in selection coefficients of 5.0 × 10⁻³ per generation and divergence time. (A) Power curve with a constant divergence time of 300 generations is marked by different symbols for different drift variances: (o) Var(Ω) = 1.0 × 10⁻⁶, (*) Var(Ω) = 5.0 × 10⁻⁶, (◊) Var(Ω) = 1.0 × 10⁻⁵, and (x) Var(Ω) = 2.0 × 10⁻⁵. (B) Power curve with constant drift variance Var(Ω) = 5.0 × 10⁻⁶ is marked by different symbols for different divergence times: (o) t = 100 generations, (*) t = 300 generations, (◊) t = 600 generations, and (x) t = 1000 generations.


