
Abstract
A combinatorial genetic perturbation strategy was applied to interrogate the yeast kinome on a genome-wide scale. We assessed the global effects of gene overexpression or gene deletion to map an integrated genetic interaction network of synthetic dosage lethal (SDL) and loss-of-function genetic interactions (GIs) for 92 kinases, producing a meta-network of 8700 GIs enriched for pathways known to be regulated by cognate kinases. Kinases most sensitive to dosage perturbations had constitutive cell cycle or cell polarity functions under standard growth conditions. Condition-specific screens confirmed that the spectrum of kinase dosage interactions can be expanded substantially in activating conditions. An integrated network composed of systematic SDL, negative and positive loss-of-function GIs, and literature-curated kinase–substrate interactions revealed kinase-dependent regulatory motifs predictive of novel gene-specific phenotypes. Our study provides a valuable resource to unravel novel functional relationships and pathways regulated by kinases and outlines a general strategy for deciphering mutant phenotypes from large-scale GI networks.
The budding yeast Saccharomyces cerevisiae represents a powerful model system for exploring the roles of eukaryotic gene families. The yeast kinome, consisting of ∼130 protein kinases, has been interrogated globally by large-scale mass spectrometry studies (Breitkreutz et al. 2010), consensus phosphorylation site analysis (Mok et al. 2010), and phosphoprotein identification (Ficarro et al. 2002; Chi et al. 2007; Smolka et al. 2007; Albuquerque et al. 2008). Nevertheless, our understanding of the functional roles of kinases and the biological significance of phosphorylation events remains incomplete and invites further systematic exploration.
Our limited understanding of phosphorylation networks reflects the complexity of the biological problem and is illustrated by several key observations: (1) Most eukaryotic proteins are likely phosphorylated (Gnad et al. 2009; Bodenmiller et al. 2010); (2) there are large rosters of kinases in eukaryotic cells—approximately 500 in human cells and 127 in yeast—corresponding to 2% of all genes in each genome (Pawson 2007); (3) kinases typically have many substrates (Sharifpoor et al. 2011), hampering detection of relevant targets; for example, ∼550 distinct phosphorylation sites have been identified on 308 proteins whose abundance was influenced by the activity of a single cell cycle kinase (Cdk1) (Holt et al. 2009); (4) Recent mass spectrometric analyses of yeast kinases and phosphatases (Bodenmiller et al. 2010; Breitkreutz et al. 2010), as well as transcriptional profiling of kinase mutants (van Wageningen et al. 2010), have emphasized the complex cross-talk between kinase pathways.
Large biochemical surveys of phosphopeptide profiles provide essential information about the phosphoproteome. Yet, cogent interpretation of these data sets and other information about the kinome demands a complementary genetic approach that provides functional information about kinase regulatory pathways. Synthetic genetic array (SGA) analysis automates the analysis of genetic interactions (GIs), enabling the systematic exploration of gene function (Tong et al. 2001, 2004; Dixon et al. 2008). In particular, SGA has been used extensively to map digenic interactions among deletion alleles of the ∼5000 nonessential yeast genes (Tong et al. 2004; Costanzo et al. 2010). Double mutants with a more severe fitness defect than expected (based on a model for the combined fitness of the individual single mutants) represent a negative GI, with synthetic lethality (SL) as the most extreme case. Conversely, double mutants that display a less severe growth defect than expected identify a positive GI (Baryshnikova et al. 2010b; Costanzo et al. 2010). Most negative and positive GIs connect genes belonging to different pathways, while a relatively small subset overlaps with protein–protein interactions and connects genes in the same pathway or protein complex (Dixon et al. 2009; Costanzo et al. 2010). The global genetic network reveals large mega-clusters of genes within the same general bioprocess and groups specific genes into coherent pathways (Costanzo et al. 2010).
A complementary approach to exploring GIs using loss-of-function alleles is analysis of interactions associated with gain-of-function alleles, including those causing overexpression or misregulation (Sopko et al. 2006a; Dixon et al. 2009). Synthetic dosage lethality (SDL) is based on the concept that increased gene expression levels may not affect growth of a wild-type strain, but may cause a clear phenotype in strains disrupted for specific pathway components or interacting proteins with a related function (Measday et al. 2005; Sopko et al. 2006a). Indeed, we have shown that SDL screening of a cyclin dependent kinase, Pho85, can enrich for substrates as well as components of opposing pathways due to inappropriate gene regulation in sensitized genetic backgrounds (Sopko et al. 2006a,b, 2007; Huang et al. 2009; Zou et al. 2009).
In this study, we explored yeast kinase function using different systematic genetic approaches to identify precise genetic conditions in which specific kinases are required for cellular fitness. With kinase query genes, we performed 92 global SDL screens and 75 systematic SGA GI screens. We used each data set to interrogate kinase pathways and then integrated the two networks to identify recurring motifs that enabled functional predictions focused on kinase regulatory pathways. Our study provides a general framework for predicting phenotypic outcomes from different combinations of genetic mutations, and delineates the functional wiring of complex kinase signaling pathways by identifying highly enriched genetic motifs.
Results
Synthetic dosage lethality screens of the kinome
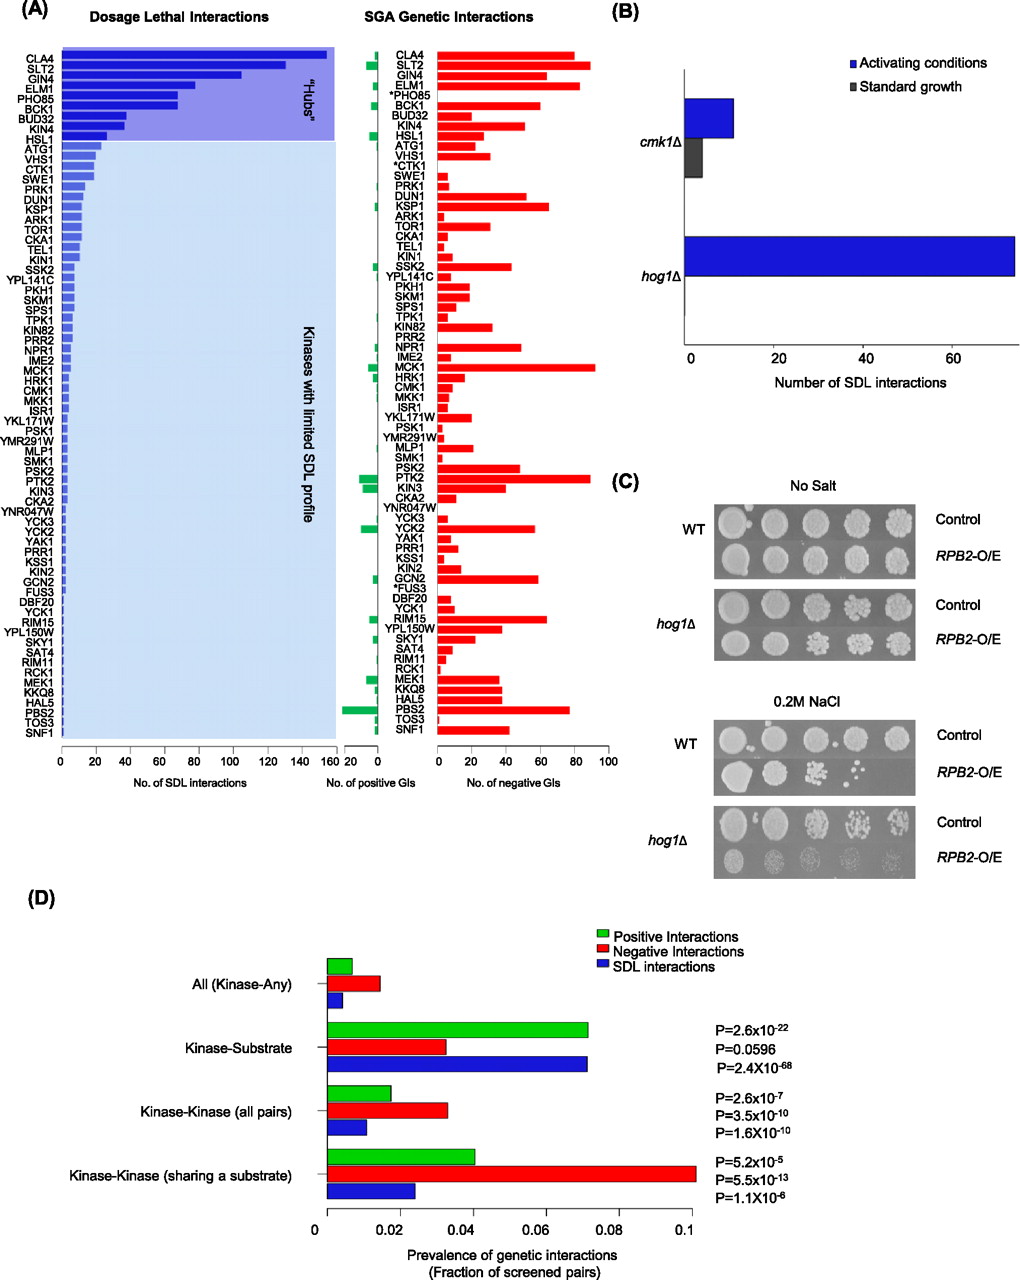
We performed whole-genome SDL screens for 92 nonessential kinase deletion mutants (Supplemental Tables S1, S2), to examine the phenotypes of over 500,000 gene pairs (Supplemental Fig. S1; Sopko et al. 2006a). Dosage lethal interactions were quantified from colony size measurements, using the SGA score (Baryshnikova et al. 2010b). We applied a stringent score threshold (|ɛ| ≥ 0.2 and a P-value <0.05), which resulted in a high-confidence data set consisting of 934 dosage lethal interactions involving 69 different kinases (Fig. 1A; Supplemental Fig. S2A; Supplemental Table S3). To estimate false positive and false negative rates associated with our kinase SDL screens, a random subset of kinase–gene pairs (3000 pairs) that fell both below and above this cutoff were confirmed using an independent assay (re-transformation and serial spot assays; see Methods; Supplemental Table S4). Spot assays were also quantified and assigned confidence scores according to the calculated standard deviation (Supplemental Table S4). Also, interactions were only considered where the quantified growth difference was observed in the kinase deletion strains by eye. In total, we estimated a false discovery rate of ∼46% and a false negative rate of ∼50% (Supplemental Table S4). This analysis confirmed that the quality of our data set was comparable to other large-scale genetic (Baryshnikova et al. 2010b; Costanzo et al. 2010) and physical interaction data sets (Breitkreutz et al. 2010) and uncovered 410 additional SDL pairs that were not identified in our high throughput assay (Supplemental Table S4). In total, our SDL network represents >1300 interactions, of which ∼700 are confirmed by serial spot dilutions as a secondary confirmation assay (See Methods; Supplemental Table S4). Our data set represents the first systematic and quantitative assessment of dosage-sensitive interactions, expanding the roster of dosage-sensitive GIs for yeast kinases by ∼10-fold (Stark et al. 2006; Breitkreutz et al. 2008; Sharifpoor et al. 2011).
Properties of the kinome SDL interaction network. (A) Distribution of SDL (blue), negative (red), and positive (green) GIs across the kinome using the stringent cutoff. The number of interactions for SDL-positive queries is plotted. (*) Kinases that were not screened for GIs. (B) Conditional screening of hog1Δ and cmk1Δ mutants expands the SDL interaction network. SDL screening of a hog1Δ strain was performed on 0.2 M NaCl (osmotic stress) and on 200 mM CaCl2 for a cmk1Δ strain. (C) Representative serial spot dilution assays illustrating the SDL phenotype caused by overexpression of RPB2 in a hog1Δ strain specifically in activating conditions. (D) Bar graph showing the prevalence of positive (green bar) and negative (red bar) GIs at the intermediate SGA cutoff among kinase–gene (all), kinase–substrate, kinase–kinase, and kinase–kinase pairs that share the same target according to the KID gold standard, as a fraction of gene pairs screened. Prevalence of SDL interactions for each subtype is shown in parallel (blue bar).
We recently developed a literature-curated database for kinases (Sharifpoor et al. 2011), termed the Kinase Information Database (KID), which we used to produce a gold standard of 517 kinase–substrate (K–S) pairs (Supplemental Table S5; http://www.moseslab.csb.utoronto.ca/KID/). Since SDL has been used to identify targets of Pho85 (Sopko et al. 2006a), we assessed the number of known K–S pairs in the SDL interaction network. We were able to use 248 of the 517 gold standard pairs in our analysis since (1) many well-characterized substrates in the gold standard are targets of essential kinases that could not be screened using our standard SDL screening pipeline (e.g., >90 targets for Cdc28) (Sharifpoor et al. 2011) and (2) some known substrates were highly toxic when overexpressed or were absent from the array, preventing detection of an SDL phenotype. Of the 248 known K–S pairs that were tested in our SDL screens, 18 shared an SDL interaction (Supplemental Fig. S3A), which represents a highly significant 15-fold enrichment (P < 10−53) compared to other nonsubstrate interacting partners of these kinases in the KID database (KID score <0) where no pairs were SDL. We repeated the analysis using another stringent negative control to avoid any bias. In this test, 248 K–S pairs were randomly shuffled to generate a list of nonsubstrate interacting partners (while preserving the degree distribution of the actual K–S network) and we still observed an enrichment of known substrates among SDL pairs (2.6-fold, P < 10−4). For example, Cla4 phosphorylates septins (Cdc10, Cdc12, and Shs1) during the G1/S transition of the cell cycle (Dobbelaere et al. 2003; Schmidt et al. 2003; Versele and Thorner 2004) and we identified two of the five septins (CDC10 and SHS1) in our SDL screen with a cla4Δ query strain. Also, the SDL screen for DUN1, a DNA damage checkpoint regulator, identified an SDL interaction with the ribonucleotide reductase inhibitor, SML1, which is targeted for degradation by Dun1-mediated phosphorylation during DNA damage (Supplemental Fig. S2A; Zhao and Rothstein 2002). Our analysis indicates that SDL interactions can be indicative of direct K–S relationships, emphasizing the use of this resource in identifying future targets of kinases. However, only a small portion of the kinase SDL network can be explained by known direct substrate relationships (1.3%), emphasizing that an SDL phenotype may also reflect other functional kinase–protein relationships in vivo.
We next assessed the biological relevance of the SDL network through comparison with other complementary large-scale data sets. Genes in the kinome SDL data set were significantly enriched for in vivo phosphoproteins (1.5-fold, P < 10−13; compiled in the PhosphoGRID database; Stark et al. 2010), regulated phosphoproteins in vivo (Bodenmiller et al. 2010) (1.2-fold, P < 0.05), and in vitro phosphorylated proteins identified by protein chip experiments (Ptacek et al. 2005) (1.5-fold, P < 10−5) (Supplemental Fig. S3B,C). While the SDL data set did not show significant overlap with physical interactions identified by traditional affinity purification and mass spectrometry approaches (Gavin et al. 2002, 2006; Krogan et al. 2006), we observed an enrichment for protein–protein interaction (PPIs) identified using two-hybrid (16-fold, P < 10−25) (Ito et al. 2000, 2001; Yu et al. 2008) and protein overexpression–mass spectrometry experiments (fivefold, P < 10−6) (Supplemental Fig. S3D; Breitkreutz et al. 2010), which have recently been shown to detect binary and/or transient interactions (Yu et al. 2008; Breitkreutz et al. 2010), consistent with the transient nature of kinase signaling pathways. Overall, our results show that the SDL data set is not only enriched for direct substrates and phosphorylated proteins, but also for physically interacting partners of kinases and phosphatases, suggesting that the SDL network is functionally informative.
We found that the number of SDL interactions varied significantly for different kinases and for some kinases no SDL interaction was detected. We sorted the 69 kinases exhibiting at least one SDL interaction into two main groups, the “hub” SDL profile subclass, which is composed of nine kinases with >25 interactions, and a larger set of 60 kinases with a limited SDL profile, exhibiting between one and 24 SDL interactions (Fig. 1A; Supplemental Fig. S2A). Hub kinases often coordinate cell cycle progression and cell polarity (Cla4, Elm1, Gin4, Hsl1, Pho85, Bud32, Kin4) or regulate cell wall integrity (Bck1 and Slt2) (11-fold, P < 10−4) and their mutants tend to have phenotypic defects that are detectable in standard growth conditions (e.g., elongated buds, flocculated colonies, aberrant cell wall involving morphologies and fitness defects) (Martin et al. 1996; Edgington et al. 1999; Asano et al. 2006; Breslow et al. 2008; Watanabe et al. 2009), reflecting their requirement for normal cell cycle progression. Consistent with these observations, the hub kinases were also significantly enriched for interactions with genes involved in cell cycle progression (11-fold, P < 10−4) (Supplemental Fig. S2B), which suggests that high connectivity in the SDL network may reflect a requirement for active kinases throughout the cell cycle (Bodenmiller et al. 2010).
Condition-specific SDL screens reveal expanded kinase SDL profiles
The SDL interactions derived from the hub kinase screens alone overlapped with gene pairs co-annotated to the same biological functions as frequently as the complete set of SDL interactions identified from screening 92 kinase mutants (Supplemental Fig. S2C). This observation suggests that almost all of the functional connections associated with the SDL interactions identified are derived from the hub kinase genes and that most kinases may only be activated under specific genetic or environmental conditions. To address this hypothesis, we performed SDL screens for a subset of kinases under gene-specific biological conditions.
We first screened a hog1Δ kinase mutant strain for SDL interactions in the presence of salt stress. Hog1 is required for the high osmolarity glycerol response and translocates to the nucleus to activate gene expression in response to osmotic stress (Reiser et al. 1999). HOG1 failed to show any SDL interactions under standard growth conditions (Fig. 1B). In contrast, a hog1Δ screen in the presence of 0.2 M NaCl identified 78 SDL interactions (Fig. 1B; Supplemental Table S6). The salt-specific hog1Δ SDL profile was enriched for genes involved in transcription and chromatin remodeling (P = 1.2 × 10⁻⁴), consistent with known features of Hog1, which include binding to the RNA polymerase subunit Rpb2 at gene promoters (Supplemental Fig. S4A; Alepuz et al. 2003; Mas et al. 2009). Spot dilution assays were used to confirm all SDL interactions, including Rpb2 (Fig. 1C).
A second condition-specific SDL screen with a calmodulin-dependent protein kinase, CMK1, also uncovered relatively few interactions in standard growth conditions. CMK1 has reported roles in stress response and is sensitive to calcium levels (Pausch et al. 1991). We identified 11 new SDL interactions when the CMK1 SDL screen was conducted in the presence of calcium (Fig. 1B; Supplemental Table S6) and the confirmed SDL interactions were enriched for factors including vesicle-mediated transport genes required for calcium signaling (P = 5 × 10⁻³) and calcium-responsive proteins (Supplemental Table S6; Supplemental Fig. S4B). Thus, our results suggest that the apparent resistance of many kinase mutants to gene overexpression reflects the requirement for kinases only in certain activating conditions and that conducting screens in a variety of biologically relevant conditions will substantially increase our view of kinase biology, particularly regarding kinase dosage sensitivities.
Loss-of-function SGA genetic interaction screens of the kinome
In addition to environmental cues, SDL interaction degree is likely dependent on the extent of functional redundancy shared between different kinases. Thus, we also assembled genome-wide surveys of the kinase genes that displayed SDL profiles for loss-of-function SGA GIs. We included GI data for 45 kinases from Costanzo et al. (2010) (37 of which provided SDL interactions) and performed genome-wide SGA screens for an additional 30 kinase queries (Supplemental Table S7; Supplemental Fig. S5). In total, we identified 2789 unique negative and 203 positive high-confidence interactions (SGA score: ɛ < −0.12, ɛ > 0.16, P < 0.05) (Supplemental Table S7). Many different kinase mutants displayed a relatively large GI profile, revealing the genetic conditions under which these kinases are required for cellular fitness. For example, while HOG1 failed to show any SDL interactions under standard growth conditions, it showed a substantial number of negative SGA GIs (Supplemental Figs. S2, S5).
In a previous study, Fiedler et al. (2009) assessed GIs among a selected subset of ∼400 genes encoding kinases, phosphatases, and potential pathway components. They report a bias toward the occurrence of positive GIs between kinases and their substrates. We observed a similar trend using our genome-wide approach and a new gold standard list of K–S pairs (Fig. 1D). Our results also indicate that both positive and negative GIs are enriched amongst kinase–kinase (K–K) pairs, including those that share the same target (Fig. 1D).
To address whether K–K redundancy was contributing to the lack of an SDL phenotype, we assessed the number of positive and negative GIs amongst K–K pairs, including those that share the same substrate. We found that the ratio of positive to negative GIs remains unchanged for K–K pairs (P = 0.45, Fig 1D) when being compared with kinase-any pairs. In fact, negative interactions between K–K pairs and between random gene pairs occurred at the same frequency when assessed across the genome (∼2%) (90 negative interactions among 4359 unique tested pairs). Also, of the 99 K–K pairs in the SGA data set that share at least one substrate in our K–S gold standard (Supplemental Table S5; Sharifpoor et al. 2011), 10 kinase pairs showed a negative (P < 10−12) GI with each other, while four pairs displayed a positive interaction (P < 10−4), corresponding to a seven- and sixfold enrichment, respectively. This analysis suggests that K–K pairs in general can have both positive and negative GIs (Fig. 1D), including those that share the same target. Consistent with a complex model of GIs between K–S and K–K pairs, we found that genes encoding proteins that physically associate with kinases may positively (threefold enrichment, P < 0.005) or negatively interact with the kinase (threefold enrichment, P < 10−4) (Breitkreutz et al. 2010). Together, our analysis shows that redundancy among kinases at a digenic level is not a major contributor to the buffering effect of kinase pathways and that K–K pairs regulating the same target can have either positive or negative GIs with each other. Interestingly, when we assessed the patterns of K–S and K–K enrichments for SDL interactions, we found that not only are K–S pairs more likely to show an SDL interaction than random, but also SDL interactions are highly enriched amongst K–K pairs including those that share the same substrate (Fig. 1D). Our combined analysis suggests a highly complex model of regulation in kinase pathways that requires more detailed network analysis for understanding kinase interactions.
Integration of the SDL and SL data sets produces a functionally informative meta-network
Consistent with other work (Kelley and Ideker 2005; Lee et al. 2008), we reasoned that integration of our kinase data sets should enable identification of regulatory motifs that provide insight into the complexity of kinase pathways and kinase function. This is particularly interesting in the context of SDL, since many SDL interactions could not be explained by literature-curated K–S relationships. Therefore, we first leveraged the SDL interaction network with the complementary SGA data set to produce a GI meta-network. Next, we super-imposed our literature-curated K–S data set onto our meta-network to search for triplet sub-networks involving all possible combinations of SDL and double deletion mutant interactions (See Methods). In total, the meta-network was based on 69 SDL and 75 SGA kinase screens and includes 1344 dosage interactions, 7427 double mutant interactions, and 517 literature-curated K–S pairs (Sharifpoor et al. 2011). We also included 71,886 interactions among gene pairs if the pair was one-hop away from a kinase in the global GI network (Costanzo et al. 2010). We applied an automated network motif detection algorithm to identify three-gene motifs that are significantly overrepresented in our integrated genetic network. Triplet motifs derived from our integrated network were statistically enriched compared with motifs derived from randomized networks (P < 0.05). We identified 2685 motifs consisting of 12 different combinations of SDL, SGA, and literature-curated interactions (Fig. 2; Supplemental Fig. S6; Supplemental Table S8). We reasoned that each motif in this resource may be associated with a specific biological interpretation from which mutant phenotypes and regulatory relationships can be inferred. Therefore, we tested three of the five most common motifs for biological relevance.
Overrepresented SDL motifs identified through combined analysis of SDL, SL/SSup GI data sets, and gold standard kinase–substrate pairs. Five types of sub-networks were enriched against the randomized data set: (A) counteracting; (B) balancing co-regulation; (C) converging regulation; (D) diverging regulation; and (E) SDL cascades. The number and fold-enrichment of triplet gene pairs identified are listed, as well as examples of known and novel motifs for each group. Possible mechanistic models describing each motif are highlighted. Some motifs fall under more than one subtype.
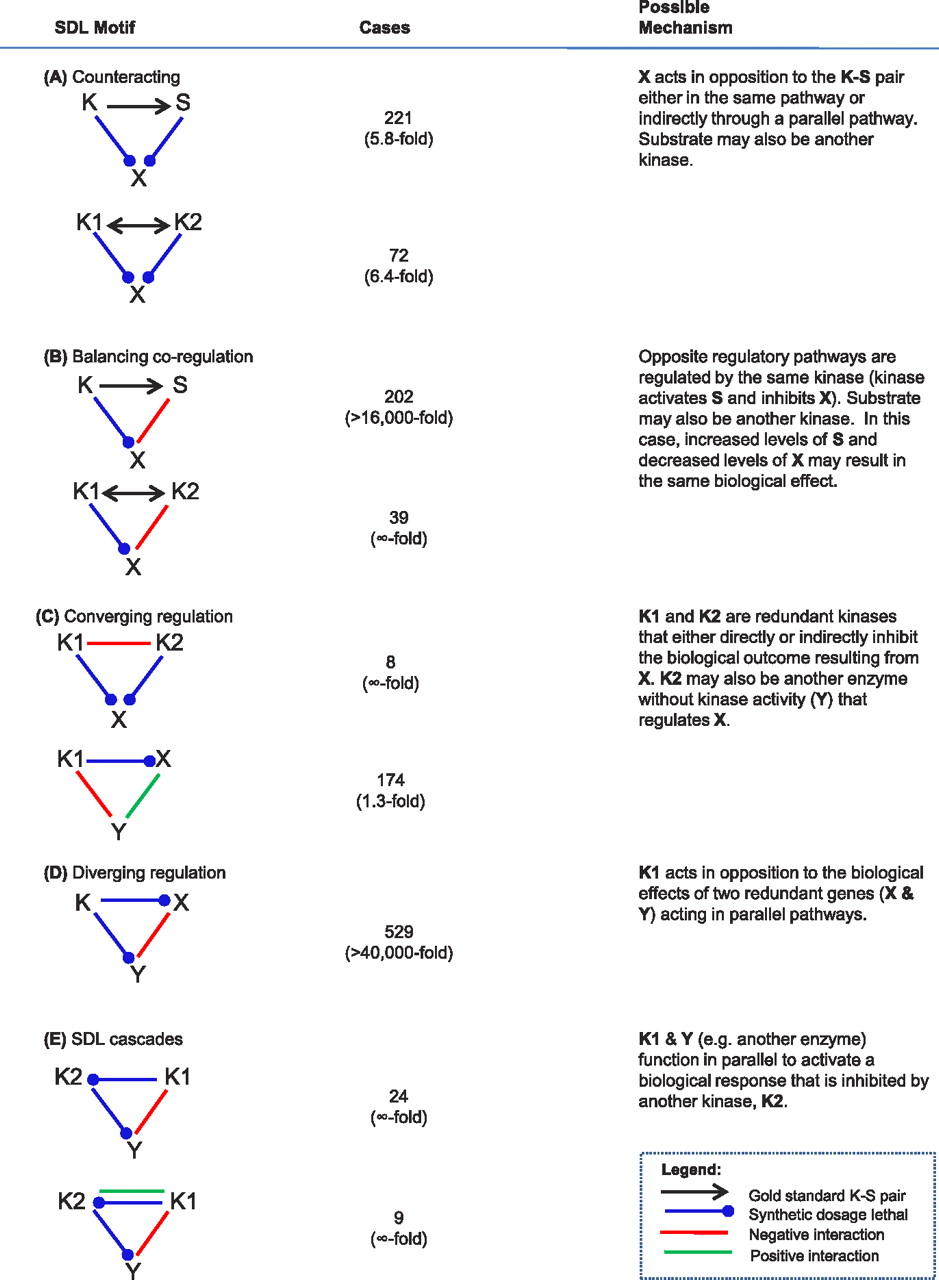
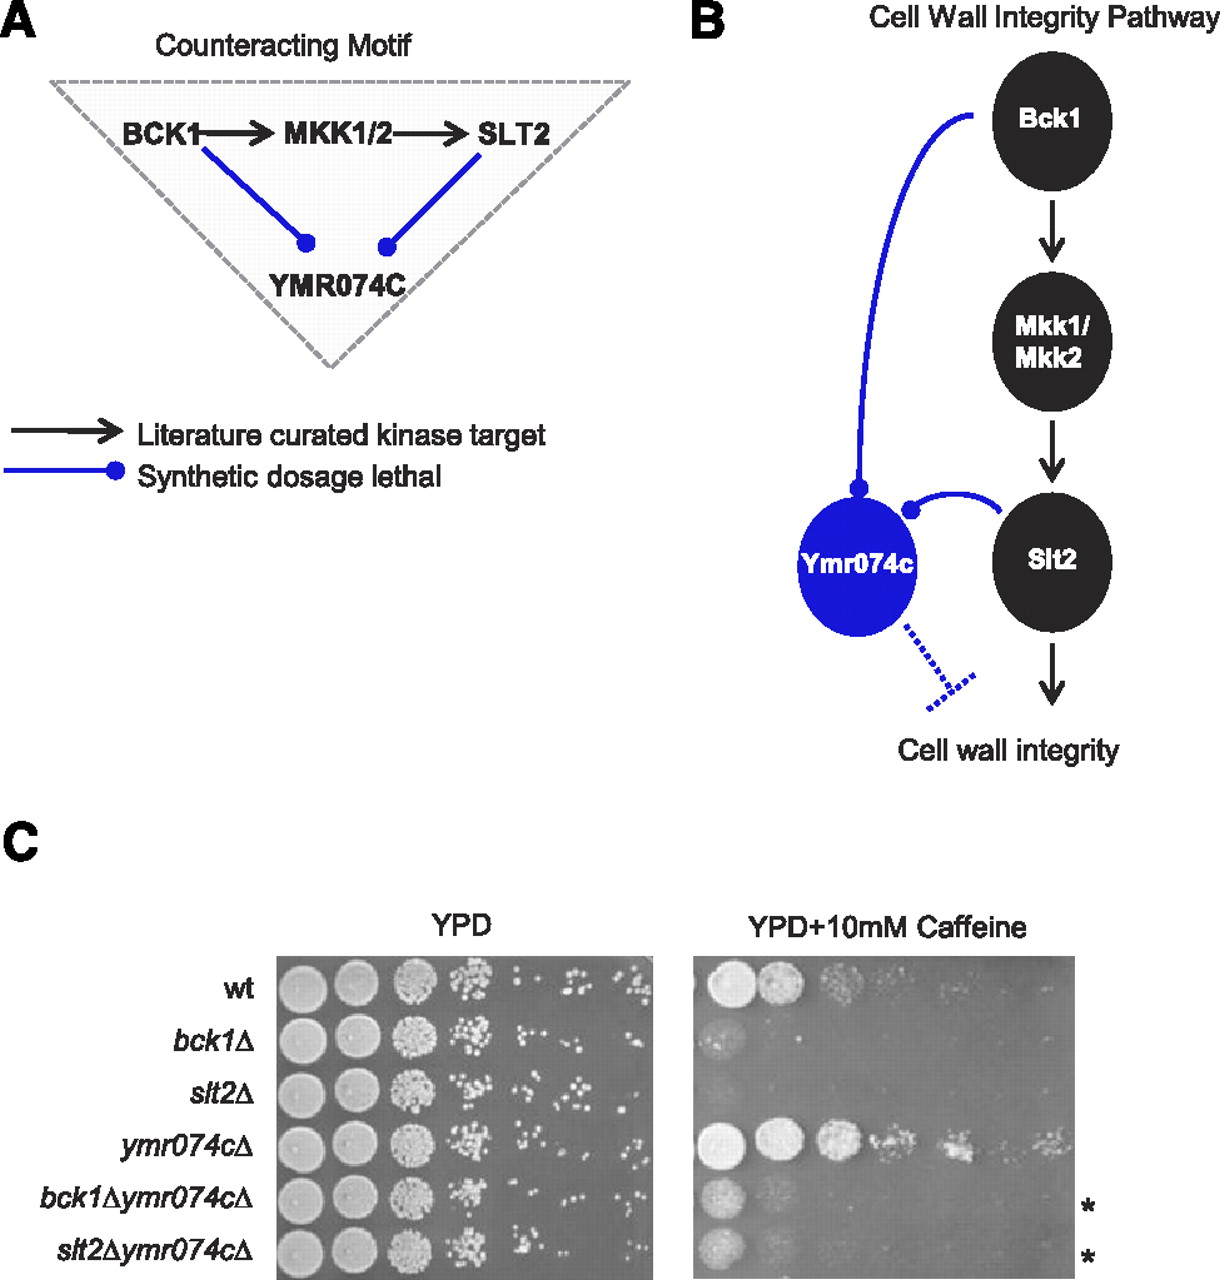
First, we examined what we have dubbed the “counteracting” motif category which involves two SDL interactions connected by a known K–S pair, where the substrate may also be another kinase, such as an interacting downstream kinase within a cascade (Fig. 2A, 5.8-fold). For example, Bck1, a MAP kinase kinase kinase (MKKK), is connected indirectly to the cell wall integrity MAP kinase (MAPK) Slt2 through the Mkk1/2 MAP kinase kinases (MKK). Both Bck1 and Slt2 showed SDL interactions with an uncharacterized gene YMR074C, encoding a protein with homology with human PDCD5, which is expressed in tumor cells during apoptosis (Fig. 3A; Hong et al. 2009). A simple model for SDL interactions predicts that Slt2 may negatively regulate the function of Ymr074c, perhaps through direct phosphorylation. Alternatively, Ymr074c may act in opposition to inhibit the cell wall integrity pathway (Fig. 3B). In tests for a functional connection between Slt2 signaling and Ymr074c, we found that deletion of YMR074C partially suppressed the fitness defect of both bck1Δ and slt2Δ deletion alleles in the presence of caffeine, a stress-inducing reagent (Fig. 3C). Importantly, we tested all 30 genes that showed a similar pattern of interaction with bck1 and slt2 for sensitivity to caffeine and a second cell wall stressor, Calcofluor White (CFW), and found that deletions of six genes (SNF7, COQ1, KRE6, PEP7, CHO2, SBE22; Supplemental Table S9) suppressed the sensitivity of bck1Δ and/or slt2Δ strains to cell wall damaging agents (twofold enrichment, P < 0.03). Thus, the motif produced by analysis of our integrated genetic network was highly predictive of the mutant phenotypes of kinase regulated genes.
YMR074C is an inhibitor of the Slt2-MAP kinase cell wall integrity pathway. (A) Overrepresented triplet motif that identified YMR074C to be SDL with two kinases of the cell wall integrity pathway, Bck1, and its downstream target Slt2. (B) Model describing the role of Ymr074c as an inhibitor of cell wall integrity. (C) Overnight cultures of bck1Δ, slt2Δ, ymr074cΔ, single or double mutants were serially diluted and spotted onto YPD medium in the absence (left) and presence (right) of 10 mM caffeine. (*) Phenotypic rescue.
We refer to another significantly enriched motif as “balancing co-regulation” (Fig. 2B, 16,000-fold, P < 10−10). This motif involves a gene connected to both a kinase and one of the kinase substrates by an SDL and a negative GI, respectively. We suspect that this motif may identify proteins or protein complexes regulated by the same kinase, but in different ways (positive versus negative regulation). For example, one “balancing co-regulation” motif involved the Cla4 kinase, which is required for phosphorylation and proper localization of Lte1, a surface-localized mitotic exit regulator (Hofken and Schiebel 2002; Seshan et al. 2002; Yoshida et al. 2003). CLA4 showed an SDL interaction with BEM1, which in turn had a negative GI with LTE1 (Supplemental Table S7). Bem1 also physically interacts with Cla4 (Gulli et al. 2000; Bose et al. 2001) and this complex is required for phosphorylating Cdc24 (the guanine nucleotide exchange factor for the master regulator of cell polarity Cdc42), a modification that ultimately inhibits bud growth. The CLA4-LTE1-BEM1 balancing co-regulation motif (Fig. 2B) suggests that Cla4 inhibits its target, the Bem1–Cdc24 complex, but activates Lte1 in the mitotic exit network, thereby coordinating cell polarized growth with cell division. In this case, our motif analysis accurately identified known regulatory relationships in a complex pathway controlling mitotic exit, validating the approach. We further predicted phenotypes for genes belonging to seven “balancing co-regulation” motifs involving the cell wall integrity kinases Bck1 and Slt2 and found that deletion of four out of seven tested genes (SMY1, EDE1, PEX19, CHO2; Supplemental Table S9) suppressed the sensitivity of bck1Δ and slt2Δ mutants to cell wall damaging agents (5.5-fold enrichment, P < 0.003), suggesting that these genes are likely involved in cell wall integrity (Supplemental Table S9).
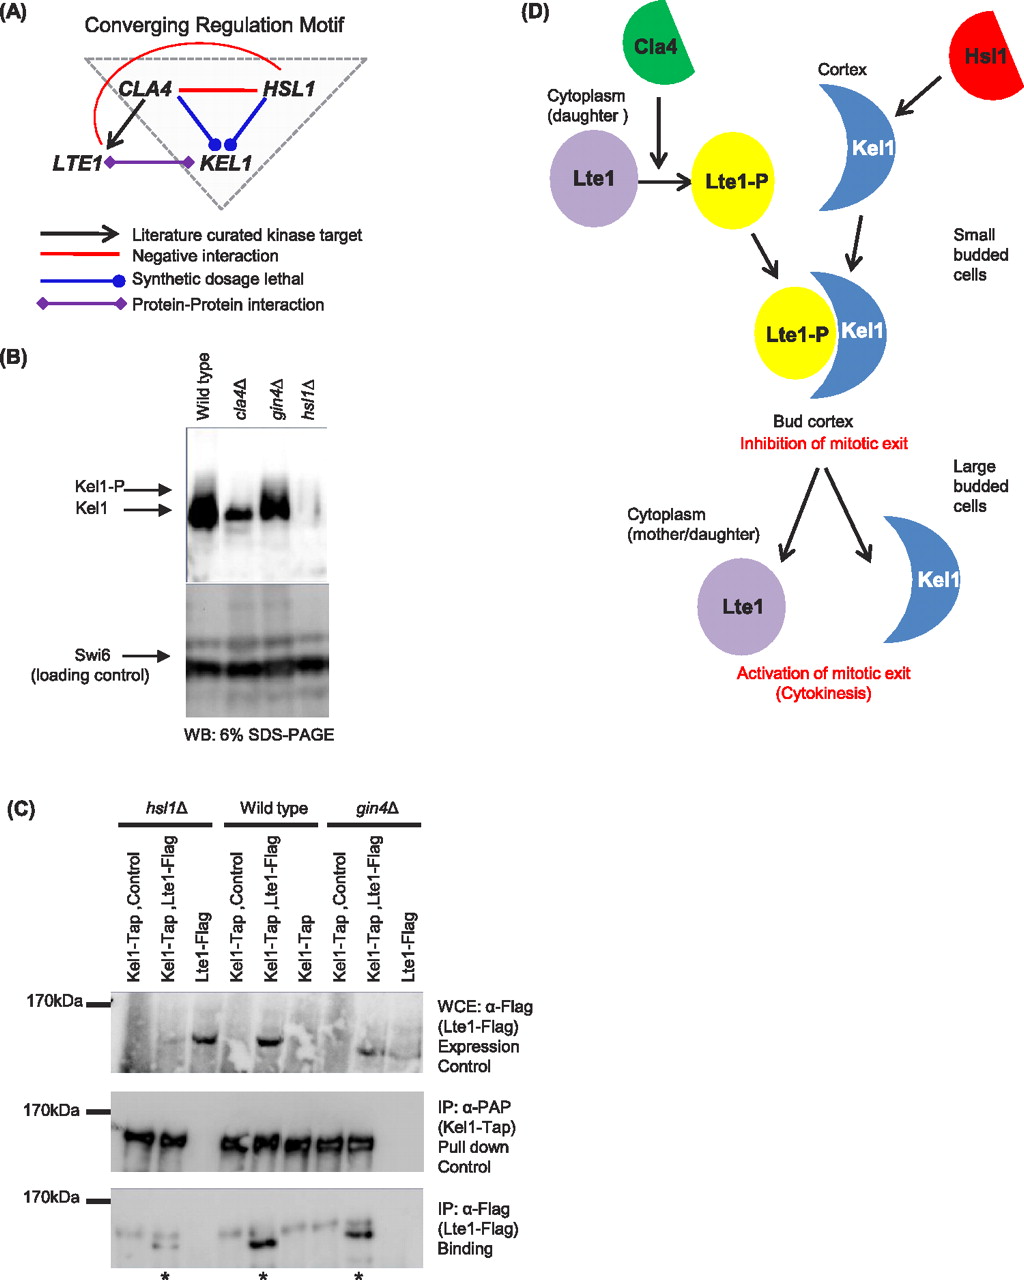
We called a third highly enriched motif “converging regulation” (Fig. 2C), in which a kinase pair, or a kinase–gene pair, negatively interact and both share an SDL interaction with a third gene. This motif class may identify kinases or enzymes that act synergistically to control a biological outcome through the same gene. Alternatively, kinases involved in the same motif may regulate each other to then influence a downstream target. We explored converging regulation motifs by testing regulatory relationships predicted by another motif involving Cla4. As noted earlier, Cla4 is required for phosphorylation and proper localization of Lte1 in vivo during mitotic exit (Hofken and Schiebel 2002; Seshan et al. 2002; Yoshida et al. 2003). Localization of Lte1 to the cortex also requires its physical association with the scaffold protein, Kel1 (Seshan et al. 2002). We identified a converging regulation motif in which the genes encoding Cla4 and Hsl1, another cell polarity kinase, showed a negative GI with each other and shared an SDL interaction with KEL1 (Fig. 4A). This motif led us to make two predictions: (1) Cla4 and Hsl1 have a synergistic and direct role in regulating Kel1; (2) Hsl1 may have a previously unappreciated role in Kel1 regulation; since the primary role for Kel1 during the cell cycle is to anchor Lte1 to the cortex (Hofken and Schiebel 2002; Seshan et al. 2002), it follows that Hsl1 may regulate the association between Kel1 and Lte1. We tested these predictions by analyzing Kel1 protein and its association with Lte1 in cla4 and hsl1 mutant strains (Fig. 4B,C). First, we analyzed Kel1 protein by Western blot and saw reduced Kel1–TAP fusion protein in both hsl1Δ and cla4Δ deletion mutant strains (Fig. 4B), but not in a strain deleted for gin4Δ, another budneck kinase that is also SDL with KEL1 (Supplemental Fig. S7). Slow migrating isoforms of Kel1 were also reduced in the cla4 mutant, consistent with a kinase–substrate relationship (this could not be assessed in the hsl1 mutant, since protein levels were so low). Second, we used coimmunoprecipitation to show that the interaction between Kel1 and Lte1 (Hofken and Schiebel 2002; Seshan et al. 2002) was substantially reduced in an hsl1Δ mutant but not a gin4Δ mutant, indicating a requirement for Hsl1 in Kel1 function (Fig. 4C). Taken together, these data confirm the predictions of the converging regulation motif and suggest that Hsl1 and Cla4 may function together to regulate Kel1 function in mitotic exit.
Kel1 protein is co-regulated by budneck kinases. (A) Overrepresented motif (gray triangle), supporting a functional connection between Kel1 and the two budneck kinases Cla4 and Hsl1 in a converging regulation model. (B) Endogenous Kel1 protein levels are reduced in hsl1Δ and cla4Δ but not in gin4Δ mutant strains. Kel1-TAP protein was immunoprecipitated from the indicated budneck kinase mutant strains and Western blots were probed with anti-PAP to detect total Kel1 protein. Electrophoretic mobility shift of Kel1 protein is shown (Kel1-P). Swi6 was used as a loading control. (C) Integrated Kel1-TAP protein was immunoprecipitated in the presence of Lte1-Flag and association of Lte1 with Kel1 was detected using α-flag antibody. The amounts of Lte1-Flag in the whole cell extract (WCE; top panel) and in the Kel1 immunoprecipitate (bottom panel) are shown. (Middle panel) The amount of Kel1-TAP in the immunoprecipitate (anti-PAP). Immunoprecipitation assays were performed in wild-type, hsl1Δ, gin4Δ background strains. cla4Δ strain was not tested, due to severe toxicity upon Kel1-TAP expression. (D) Model for regulation of Kel1 by budneck kinases. Lte1 is phosphorylated by Cla4, which triggers binding to its anchor, Kel1. Hsl1 regulates the stability of Kel1 protein, which allows the anchor to become available for binding to Lte1-P. Together, the complex inhibits mitotic exit possibly to delay budding to allow the cell to reach the correct size. Later, Cdc14 phosphatase releases Lte1 from its anchor in the cortex into the cytoplasm in order to activate mitotic exit in large budded cells.
Discussion
Here, we describe an integrated genetic network combining comprehensive SDL interactions with positive and negative GI data for yeast kinases. Our analysis identified several general properties of kinase–SDL interactions: (1) kinase–SDL interactions are enriched for known K–S pairs, physically interacting partners of kinases, and phosphoproteins; (2) many SDL interactions cannot be explained by direct kinase–substrate relationships, suggesting that the SDL interactions also probe other aspects of kinase biology and complement existing biochemical surveys of kinase targets; (3) kinases with extensive SDL profiles tend to have constitutive roles throughout the cell cycle; (4) the majority of yeast kinases are relatively insensitive to dosage lethal interactions under standard growth conditions. The results of our SGA loss-of-function GI analysis and other work (Fiedler et al. 2009; Costanzo et al. 2010; van Wageningen et al. 2010) suggest that kinase redundancy, at least at the double mutant level, does not explain the limited SDL interaction profiles for most kinases. Rather, our findings suggest that condition-specific requirements may explain the resistance of many kinases to gene overexpression in standard growth conditions, a result that is consistent with other studies (Harrison et al. 2007). Thus, in principle, to understand the full scope of kinase biology, HTP assays will need to be performed in multiple conditions.
Importantly, in addition to condition specificity, kinases exhibit extensive functional redundancy with other cellular pathways as demonstrated by our SGA analysis (Fig. 1A,D). On average, a single kinase exhibits 29 synthetic lethal/sick interactions (SGA stringent score lower than or equal to −0.12; Supplemental Table S7) indicating that there are ∼29 genetic backgrounds that require the activity of a given nonessential kinase to maintain a wild-type level of fitness. Thus, systematic SGA analysis has identified a defined set of genetic conditions to explore and expand the kinase SDL interaction network.
Our SDL and SGA profiles for yeast kinase mutants are clearly rich in functional information, since we see many biologically relevant effects. However, we do expect some allele-specific effects for individual GIs with overexpression data, since we made use of the GST-tagged alleles in our systematic SDL screens. For example, overexpression of either an N-terminally GST-tagged- or C-terminally HA-tagged allele of KEL1 caused a clear SDL phenotype in cla4, hsl1, and gin4 deletion mutants, but the degree of toxicity was sometimes dependent on the KEL1 allele (Supplemental Fig. S7). In a similar experiment, we assayed overexpression toxicity for kinases carrying either an N-terminal GST or a C-terminal HA tag; of the 23 toxic kinases, 12 exhibited a clear fitness phenotype with both alleles, although the degree of growth defect depended on the tag in some cases (data not shown). Since SDL interactions measure overexpression phenotypes in different genetic backgrounds, we would anticipate a comparable degree of overlap between our SDL data set and screens done using a differentially tagged or untagged collection. We note that these results are comparable to allele-specific effects seen in other large-scale studies. For example, GI profiling of essential genes using DAmP versus temperature-sensitive alleles revealed clear and significant overlap in GI profiles but individual GIs varied for the alleles (∼50% overlap in individual GIs) (Davierwala et al. 2005). Although allele-specific effects are expected, our experiments illustrate the value of considering both individual GIs and GI profiles (as in our motif analysis) to draw novel biological conclusions.
Previous reports using a relatively small subset of kinase pathway mutants suggested a bias toward positive GIs between K–S pairs (Fiedler et al. 2009), which is consistent with simple cascade models of kinase signaling. Although we confirmed such an enrichment using our genome-wide approach, our additional systematic screens suggest that kinases more often participate in multifaceted networks. Several lines of evidence support this idea: (1) K–K pairs that share the same target in the gold standard have both negative and positive GIs; (2) K–S pairs are mostly enriched for positive GIs, but may show negative GIs; (3) kinase pathways show a large number of GIs with other enzymes; (4) there is a surprisingly small number of redundant kinase pairs; (5) combinatorial motif analysis revealed enrichment for both diverging and converging genetic motifs; (6) differential physical associations can often dictate the multifunctional properties of a kinase (Breitkreutz et al. 2010). These results emphasize the importance of performing complementary genome-wide screens and the use of accurate gold standards to define kinase–substrate pairs, in order to accurately assess the functional relationships between regulatory proteins and their targets. Our model agrees with recent phosphoprotoemic analysis of kinase pathways that does not support simplistic linear signaling modules among kinases and phosphatases (Bodenmiller et al. 2010; Breitkreutz et al. 2010).
Motif analysis using the meta-network of kinase GIs in combination with our literature-curated K–S gold standard list was key in providing an informative view of regulatory relationships between kinases, their substrates, and other proteins. For example, one “balancing co-regulation” motif predicted a previously unappreciated regulatory relationship between the budneck kinases Hsl1 and Cla4 and the Kel1 scaffold protein. In this case, computational analysis of our meta-network prompted experiments that led us to discover that (1) Kel1 protein stability is regulated by Cla4 and Hsl1; (2) optimal association of Kel1 with Lte1, which it anchors to the cell cortex, requires Hsl1 kinase. These and other experiments lead us to propose that Hsl1 regulates Kel1 protein levels to coordinate Cla4 activation of Lte1, with the presence of the Kel1 anchor required for mitotic exit. In the hsl1 mutant, where binding of Kel1 to Lte1 is reduced, excess levels of Kel1 may force binding of unphosphorylated Lte1 to the membrane to induce premature mitotic exit (Fig. 4D). Our functional motif predictions, combined with biochemical data, strongly suggest that Hsl1 is a key regulator of Kel1 and that the cell has adopted mechanisms to co-regulate the levels of active Lte1 protein and its anchor, Kel1 (Fig. 4D).
In addition to the three motif categories tested—counteracting, balancing co-regulation, and converging regulation—we discovered nine additional predictive motifs that were enriched in the meta-network (Fig. 2; Supplemental Fig. S6). These included “diverging regulation” motifs where SL gene pairs share an SDL interaction with the same kinase (Fig. 2D), possibly predicting gene pairs co-regulated by the same kinase and “SDL cascades” comprised of two ordered SDL interactions between kinase pairs connected to a SL interaction between one of the kinases and another gene (Fig. 2E). The latter motif predicts a scenario where a kinase–gene pair may function in parallel to activate a biological response that is inhibited by another kinase. Other highly enriched motifs involving only positive and negative GIs and known K–S pairs (many of which are supported by published data) include those that identify upstream and downstream regulators of K–S pathways, diverging targets of the same kinase, converging kinases regulating the same target, and triply redundant genes (Supplemental Fig. S6; Supplemental Table S8). Together, the presented motifs provide a resource for additional focused small-scale and bioinformatics analyses that will expand our knowledge of kinase biology.
In general, our study outlines a framework for combining systematic loss- and gain-of-function GI networks to make phenotypic predictions that we anticipate will become an increasingly valuable approach toward understanding the genotype-to-phenotype relationship, as we continue to map GIs in yeast and higher eukaryotes.
Methods
Synthetic dosage lethal screens
The SDL screening protocol was adapted from Sopko et al. (2006a) and is summarized in Supplemental Figure S1 (Sopko et al. 2006a). Refer to the online Supplemental Materials and Methods for detailed SDL screening and confirmation protocol (http://andrewslab.ccbr.utoronto.ca/data/). In brief, a collection of yeast strains deleted for query kinases was constructed in a strain background compatible with SGA analysis (Supplemental Tables S1, S2; Costanzo et al. 2010). Kinase deletion mutants (marked with the NATR cassette) were crossed to a GST-ORF overexpression array (Supplemental Table S2; Sopko et al. 2006a; Costanzo et al. 2010) using the SGA protocol (Tong et al. 2001). Screens were performed in a 1536 colony format, where each colony is represented four times on the array, producing eight replicates per gene. Gene overexpression was induced by pinning the final haploid array onto medium containing 2% galactose and plates were then incubated at 30°C for 2 d. Colony sizes were quantified using an adapted SGA protocol (Baryshnikova et al. 2010a). SDL and SDS interactions were scored using the previously described SGA score method with the assumption that no kinase queries have significant fitness defects on the final selection plates. SDL and SDS interactions were defined as gene pairs that satisfy the following SGA score cutoff: |ɛ| ≥ 0.2, P < 0.05 (Supplemental Table S3). To estimate false discovery rate, we confirmed >3000 interactions by direct transformation both in wild-type and mutant backgrounds followed by serial spot assays where a difference in colony size was observed in the kinase deletion strains by eye. Spot assays were quantified and assigned confidence scores according to the calculated standard deviation (Supplemental Table S4). In total, we estimated a false discovery rate of ∼46% and a false negative rate of ∼50% (Supplemental Table S4), which is comparable to rates observed for other large-scale genetic (Baryshnikova et al. 2010b; Costanzo et al. 2010) and physical interaction data sets (Breitkreutz et al. 2010). Conditional SDL screens were performed as above but final haploid arrays were pinned onto the medium containing the appropriate inducer at a concentration reported to be consistent with viability. Kinase mutants with mating defects (STE7, STE11, STE20) or those otherwise refractory to the SGA protocol (BUB1, IRE1, SSN3, SSK22, SCH9) were excluded in this study. We were unable to make query kinase deletion strains for 10 kinases for technical reasons (Supplemental Table S1).
Negative and positive genetic interaction screens
For analysis of growth defects in double deletion mutants, the kinaseΔ::NATR (Supplemental Table S2) query strains were crossed to the viable haploid deletion array (Giaever et al. 2002; Baryshnikova et al. 2010a) as previously described (Baryshnikova et al. 2010a). Negative and positive SGA GIs were quantified as described elsewhere (Baryshnikova et al. 2010b). An intermediate SGA score cutoff (|ɛ| ≥ 0.08, P < 0.05) was applied to SGA data as recommended elsewhere (Baryshnikova et al. 2010b; Costanzo et al. 2010), unless otherwise indicated. We confirmed a subset of double mutant interactions between K–K pairs identified in our screens by tetrad dissection, and automated liquid growth curve assays.
Literature-curated kinase data set (KID)
We compiled a highly detailed literature-curated database of K–S interactions for all kinases (Kinase Information Database; KID) (Sharifpoor et al. 2011). Biological interactions involving kinase interactions were compiled by a group of eight kinase experts and tagged with their associated PMIDs. KID is a ranked database for kinase interactions that scores K–S pairs by applying likelihood ratios using a known gold-standard K–S list and comparing it to randomized kinase–gene pairs (Sharifpoor et al. 2011). The ranked score on KID is defined as a likelihood ratio of the prevalence of each experimental category in the gold standard K–S set compared with a randomized list of kinase–gene interactions (negative bin). We considered the gold standard K–S pairs as the 517 pairs reported on KID corresponding to the stringent cutoff (P ≤ 0.01) (Sharifpoor et al. 2011). The literature-curated gold standard list of K–S pairs is described in Supplemental Table S5.
Analysis of triplet motifs using double mutant and dosage interactions
We used Fanmod (Wernicke and Rasche 2006) to identify overrepresented three-edge sub-networks in the combined meta-network of (1) literature-curated K–S interactions, (2) the combined confirmed and unconfirmed SDL interactions above our defined cutoff, (3) negative GIs (bidirectional edges), and (4) positive GIs identified both as query genes from our study or as array hits from a previous analysis of fitness defects in double deletion mutants (Supplemental Table S6; Costanzo et al. 2010). Fanmod is a fast network motif detection tool to identify connected subgraphs that occur significantly more often than in random networks. Crucially, Fanmod allows for motif detection in colored networks (i.e., those with multiple edge types). We ran Fanmod with a maximum subgraph size of three (triplet motifs) and four edge types as described. In the first step, Fanmod enumerated all subgraphs of size three and grouped them into isomorphic subgraph classes (Wernicke and Rasche 2006). Next, Fanmod determined the frequency of subgraph classes in randomized graphs. Two-hundred random graphs were generated from the original network by switching edges between vertices (exchanging only edges of the same type) while preserving the number of bidirectional edges (we used this randomization scheme because our combined network is directed). Finally, significance of each subgraph in the network was calculated and those with P < 0.05 were further considered. Significant triplet motifs were extracted using a program implemented in MATLAB that performs an exhaustive search over all possible gene combinations for those fitting each motif. Starting with a list of pairs that fit one line in a triangular motif (e.g., A→B; K–S pair), the script searches through each given rule generated in Fanmod to identify a third gene that relates to the first pair according to any of the stated rules.
Statistical analyses
Overlap of synthetic dosage lethal interactions with other data sets was analyzed as follows. For each pairwise interaction data set (e.g., known kinase–substrate pairs, protein–protein, or GIs) we first assembled a list of gene pairs that have been screened for SDL interaction (either showing or not showing SDL) and for which interaction information from the other data set was also available (e.g., either being a kinase–substrate pair or not displaying kinase–substrate interaction). For kinase–substrate interactions, we defined noninteracting K–S pairs as those which have a negative likelihood ratio score in the KID literature-curated database. For protein–protein interactions, we assumed that nonreported protein pairs do not interact. Next, we computed the significance of the overlap between the SDL and the other interaction data set using χ2 test of independence. Overlaps between loss-of-function genetic interactions (negative and positive GI) and kinase–kinase or kinase–substrate pairs were also investigated in a similar manner. To test the overlap of SDL hits (i.e., list of overexpressed genes that show at least one SDL interaction with a kinase deletion strain) with other gene lists (e.g., list of genes whose protein products are phosphorylated in vitro) we also performed χ2 tests of independence.
Other yeast strains and plasmid construction
Kinase deletion strains carrying a TAP-tagged allele of KEL1 were constructed by crossing a MATa KEL1-TAP-HIS3 strain (Ghaemmaghami et al. 2003; Costanzo et al. 2010) to the MATα kinaseΔ::NATR query strains (Supplemental Table S2). Kinase–gene double deletion strains were constructed by crossing NATR kinase deletion mutants (see above and Supplemental Tables S1, S2) to the kinase deletion strains from the yeast deletion collection (Giaever et al. 2002) (KANR gene deletion strains) and dissecting tetrads. MATa haploids of the desired double mutant genotype were selected for analysis by replica plating segregants onto YEPD media (1% yeast extract, 2% bactopeptone, 0.004% tryptophan, 0.004% adenine, 2% glucose) containing cloNAT and G418.
A LEU2-based plasmid expressing a C-terminally Flag-tagged allele of LTE1 was constructed by cloning LTE1-HA from the mORF collection (Gelperin et al. 2005) into a pRS315 low copy CEN vector using the Invitrogen Gateway cloning technology (Supplemental Table S2). First, LTE1-HA from the mORF collection was transferred to pDONR-221 plasmid, which was then used to transfer the LTE1 cassette into the recipient plasmid pRS315-FLAG-LEU2. The resulting construct, pRS315-LTE1-FLAG-LEU2, was then transformed into the indicated kinase deletion strains in the presence or absence of integrated KEL1-TAP for coimmunoprecipitation assays (see below).
Serial spot dilutions
Standard methods and media were used for yeast growth and transformation. Spot assays were performed by growing yeast cultures in appropriate media to saturation and spotting equal volumes of 15-fold serial dilutions (5 μL) onto plates with appropriate supplements to assess growth. All glucose-containing plates were incubated for 2 d, while galactose-containing plates were grown for 3 d at 30°C. To assess cold sensitivity, YEPD plates were incubated for 7 d at 15°C. To test strain sensitivity to cell wall stressors, we included 10 mM caffeine or 64 μg Calcofluor White in YEPD plates and grew cells for 4 d.
Western blot and coimmunoprecipitation analysis
To prepare samples for Western blot analysis, 50 mL of cells were grown in the appropriate media to an optical density (O.D.600) of 1.0 and washed once with phosphate buffered saline (PBS). Samples were resuspended in 250 μL of solution containing 1% β-mercaptoethanol in 0.25 N NaOH and incubated on ice for 10 min; 160 μL of 50% TCA were added and samples were incubated for another 10 min on ice. After a 10-min centrifugation at high speed, the precipitated protein was isolated and resuspended in 100 μL of 2× SDS sample buffer. Samples were resolved on 6% SDS polyacrylamide gels and transferred to polyvinylidene difluoride (PVDF) membranes following standard procedures for Western blot analysis. Peroxidase anti-peroxidase complex, α-PAP (P3039; Sigma Aldrich), was used to detect TAP-tagged proteins. Flag-tagged proteins were detected using α-Flag M2 (Sigma Aldrich) and α-GST primary conjugate (GE Healthcare) was used to assess migration changes for GST-tagged proteins. Swi6 protein levels were assessed as a loading control using an affinity purified α-Swi6 antibody (Sidorova and Breeden 1993). For analysis of coimmunoprecipitation of tagged Lte1 and Kel1, overnight cultures of BY4798 (MATα ura3Δ::NATR KEL1-TAP-HIS3), BY4800 (MATα hsl1Δ::NATR KEL1-TAP-HIS3), and BY4802 (MATα gin4Δ::NATR KEL1-TAP-HIS3), carrying either the pRS315-LTE1-FLAG or control plasmids, were grown overnight in 2% raffinose and expression of LTE1 was induced by addition of 2% galactose for 9 h. Cells were lysed in Lysis Buffer (50 mM Tris-HCl, pH 7.5, 100 mM NaCl, 1 mM EDTA, 5 mM NaF, and protease inhibitors) and samples were clarified by centrifugation at high speed for 10 min. Total protein was incubated with IgG sepharose (Amersham Biosciences) overnight at 4°C with gentle shaking. IgG resin was washed three times in lysis buffer and resuspended in 2× sample buffer for Western blot analysis.
Data access
Supplemental Tables S1–S9, Figures S1–S7, and Supplemental Materials and Methods can be downloaded directly from the journal website or via the Andrews Lab Supplementary website (http://andrewslab.ccbr.utoronto.ca/data/). Interactive and searchable tables are also available for Tables S3, S7, and S8 on the Andrews Lab Supplementary website. In addition, all SDL and SGA GIs are available on Yeast KID (http://www.moseslab.csb.utoronto.ca/KID/), allowing users to compare the presented data with previously published high throughput (HTP) and low throughput (LTP) data. To access the SDL and SGA data sets via Yeast KID, users must search by the PMID associated with this manuscript.
Acknowledgments
This work was supported by a grant from the Canadian Cancer Society Research Institute (formerly the National Cancer Institute of Canada) to B.J.A. Infrastructure and technical support for SGA analysis in the Andrews and Boone labs is supported by grants from the Canadian Institutes of Health Research (MOP-102629), the National Institutes of Health (1R01HG005853), and the Ontario Research Fund (GL2-01-22). B.P. was supported by grants from The International Human Frontier Science Program Organization, the Hungarian Scientific Research Fund (OTKA PD 75261), and the “Lendület Program” of the Hungarian Academy of Sciences. B.V. and C.L.M. are partially supported by funding from the National Institutes of Health (R01HG005084, R01HG005853) and the National Science Foundation (DBI 0953881).
Authors' contributions: S.S., M.C., A.B., B.J.A., and C.B. prepared and edited the manuscript. SDL screening was performed by S.S. and D.vD. and results were confirmed by S.S. SGA screens were performed by M.C., A.B., and C.B. Scoring and quantification of the SDL and SGA screens was performed by A.B. Statistical analysis of both data sets including motif analysis was performed by B.P. and C.L.M. B.V. and C.L.M. contributed to the motif extraction. J.-Y.Y., A.C.D., and H.F. performed literature curation of kinase–substrate pairs. A.C.D. confirmed a portion of the conditional screens. Motif predictions were tested by D.vD. and S.S.
References
- ↵CP Albuquerque, MB Smolka, SH Payne, V Bafna, J Eng, H Zhou. 2008. A multidimensional chromatography technology for in-depth phosphoproteome analysis. Mol Cell Proteomics 7: 1389–1396.
- ↵PM Alepuz, E de Nadal, M Zapater, G Ammerer, F Posas. 2003. Osmostress-induced transcription by Hot1 depends on a Hog1-mediated recruitment of the RNA Pol II. EMBO J 22: 2433–2442.
- ↵S Asano, JE Park, LR Yu, M Zhou, K Sakchaisri, CJ Park, YH Kang, J Thorner, TD Veenstra, KS Lee. 2006. Direct phosphorylation and activation of a Nim1-related kinase Gin4 by Elm1 in budding yeast. J Biol Chem 281: 27090–27098.
- ↵A Baryshnikova, M Costanzo, S Dixon, FJ Vizeacoumar, CL Myers, B Andrews, C Boone. 2010a. Synthetic genetic array (SGA) analysis in Saccharomyces cerevisiae and Schizosaccharomyces pombe. Methods Enzymol 470: 145–179.
- ↵A Baryshnikova, M Costanzo, Y Kim, H Ding, J Koh, K Toufighi, JY Youn, J Ou, BJ San Luis, S Bandyopadhyay, . 2010b. Quantitative analysis of fitness and genetic interactions in yeast on a genome scale. Nat Methods 7: 1017–1024.
- ↵B Bodenmiller, S Wanka, C Kraft, J Urban, D Campbell, PG Pedrioli, B Gerrits, P Picotti, H Lam, O Vitek, . 2010. Phosphoproteomic analysis reveals interconnected system-wide responses to perturbations of kinases and phosphatases in yeast. Sci Signal 3: rs4. doi: 10.1126/scisignal.2001182.
- ↵I Bose, JE Irazoqui, JJ Moskow, ES Bardes, TR Zyla, DJ Lew. 2001. Assembly of scaffold-mediated complexes containing Cdc42p, the exchange factor Cdc24p, and the effector Cla4p required for cell cycle-regulated phosphorylation of Cdc24p. J Biol Chem 276: 7176–7186.
- ↵BJ Breitkreutz, C Stark, T Reguly, L Boucher, A Breitkreutz, M Livstone, R Oughtred, DH Lackner, J Bahler, V Wood, . 2008. The BioGRID Interaction Database: 2008 update. Nucleic Acids Res 36: D637–D640.
- ↵A Breitkreutz, H Choi, JR Sharom, L Boucher, V Neduva, B Larsen, ZY Lin, BJ Breitkreutz, C Stark, G Liu, . 2010. A global protein kinase and phosphatase interaction network in yeast. Science 328: 1043–1046.
- ↵DK Breslow, DM Cameron, SR Collins, M Schuldiner, J Stewart-Ornstein, HW Newman, S Braun, HD Madhani, NJ Krogan, JS Weissman. 2008. A comprehensive strategy enabling high-resolution functional analysis of the yeast genome. Nat Methods 5: 711–718.
- ↵A Chi, C Huttenhower, LY Geer, JJ Coon, JE Syka, DL Bai, J Shabanowitz, DJ Burke, OG Troyanskaya, DF Hunt. 2007. Analysis of phosphorylation sites on proteins from Saccharomyces cerevisiae by electron transfer dissociation (ETD) mass spectrometry. Proc Natl Acad Sci 104: 2193–2198.
- ↵M Costanzo, A Baryshnikova, J Bellay, Y Kim, ED Spear, CS Sevier, H Ding, JL Koh, K Toufighi, S Mostafavi, . 2010. The genetic landscape of a cell. Science 327: 425–431.
- ↵AP Davierwala, J Haynes, Z Li, RL Brost, MD Robinson, L Yu, S Mnaimneh, H Ding, H Zhu, Y Chen, . 2005. The synthetic genetic interaction spectrum of essential genes. Nat Genet 37: 1147–1152.
- ↵SJ Dixon, Y Fedyshyn, JL Koh, TS Prasad, C Chahwan, G Chua, K Toufighi, A Baryshnikova, J Hayles, KL Hoe, . 2008. Significant conservation of synthetic lethal genetic interaction networks between distantly related eukaryotes. Proc Natl Acad Sci 105: 16653–16658.
- ↵SJ Dixon, M Costanzo, A Baryshnikova, B Andrews, C Boone. 2009. Systematic mapping of genetic interaction networks. Annu Rev Genet 43: 601–625.
- ↵J Dobbelaere, MS Gentry, RL Hallberg, Y Barral. 2003. Phosphorylation-dependent regulation of septin dynamics during the cell cycle. Dev Cell 4: 345–357.
- ↵NP Edgington, MJ Blacketer, TA Bierwagen, AM Myers. 1999. Control of Saccharomyces cerevisiae filamentous growth by cyclin-dependent kinase Cdc28. Mol Cell Biol 19: 1369–1380.
- ↵SB Ficarro, ML McCleland, PT Stukenberg, DJ Burke, MM Ross, J Shabanowitz, DF Hunt, FM White. 2002. Phosphoproteome analysis by mass spectrometry and its application to Saccharomyces cerevisiae. Nat Biotechnol 20: 301–305.
- ↵D Fiedler, H Braberg, M Mehta, G Chechik, G Cagney, P Mukherjee, AC Silva, M Shales, SR Collins, S van Wageningen, . 2009. Functional organization of the S. cerevisiae phosphorylation network. Cell 136: 952–963.
- ↵AC Gavin, M Bosche, R Krause, P Grandi, M Marzioch, A Bauer, J Schultz, JM Rick, AM Michon, CM Cruciat, . 2002. Functional organization of the yeast proteome by systematic analysis of protein complexes. Nature 415: 141–147.
- ↵AC Gavin, P Aloy, P Grandi, R Krause, M Boesche, M Marzioch, C Rau, LJ Jensen, S Bastuck, B Dumpelfeld, . 2006. Proteome survey reveals modularity of the yeast cell machinery. Nature 440: 631–636.
- ↵DM Gelperin, MA White, ML Wilkinson, Y Kon, LA Kung, KJ Wise, N Lopez-Hoyo, L Jiang, S Piccirillo, H Yu, . 2005. Biochemical and genetic analysis of the yeast proteome with a movable ORF collection. Genes Dev 19: 2816–2826.
- ↵S Ghaemmaghami, WK Huh, K Bower, RW Howson, A Belle, N Dephoure, EK O'Shea, JS Weissman. 2003. Global analysis of protein expression in yeast. Nature 425: 737–741.
- ↵G Giaever, AM Chu, L Ni, C Connelly, L Riles, S Veronneau, S Dow, A Lucau-Danila, K Anderson, B Andre, . 2002. Functional profiling of the Saccharomyces cerevisiae genome. Nature 418: 387–391.
- ↵F Gnad, LM de Godoy, J Cox, N Neuhauser, S Ren, JV Olsen, M Mann. 2009. High-accuracy identification and bioinformatic analysis of in vivo protein phosphorylation sites in yeast. Proteomics 9: 4642–4652.
- ↵MP Gulli, M Jaquenoud, Y Shimada, G Niederhauser, P Wiget, M Peter. 2000. Phosphorylation of the Cdc42 exchange factor Cdc24 by the PAK-like kinase Cla4 may regulate polarized growth in yeast. Mol Cell 6: 1155–1167.
- ↵R Harrison, B Papp, C Pal, SG Oliver, D Delneri. 2007. Plasticity of genetic interactions in metabolic networks of yeast. Proc Natl Acad Sci 104: 2307–2312.
- ↵T Hofken, E Schiebel. 2002. A role for cell polarity proteins in mitotic exit. EMBO J 21: 4851–4862.
- ↵LJ Holt, BB Tuch, J Villen, AD Johnson, SP Gygi, DO Morgan. 2009. Global analysis of Cdk1 substrate phosphorylation sites provides insights into evolution. Science 325: 1682–1686.
- ↵J Hong, J Zhang, Z Liu, S Qin, J Wu, Y Shi. 2009. Solution structure of S. cerevisiae PDCD5-like protein and its promoting role in H2O2-induced apoptosis in yeast. Biochemistry 48: 6824–6834.
- ↵D Huang, S Kaluarachchi, D van Dyk, H Friesen, R Sopko, W Ye, N Bastajian, J Moffat, H Sassi, M Costanzo, . 2009. Dual regulation by pairs of cyclin-dependent protein kinases and histone deacetylases controls G1 transcription in budding yeast. PLoS Biol 7: e1000188. doi: 10.1371/journal.pbio.1000188.
- ↵T Ito, K Tashiro, S Muta, R Ozawa, T Chiba, M Nishizawa, K Yamamoto, S Kuhara, Y Sakaki. 2000. Toward a protein-protein interaction map of the budding yeast: A comprehensive system to examine two-hybrid interactions in all possible combinations between the yeast proteins. Proc Natl Acad Sci 97: 1143–1147.
- ↵T Ito, T Chiba, R Ozawa, M Yoshida, M Hattori, Y Sakaki. 2001. A comprehensive two-hybrid analysis to explore the yeast protein interactome. Proc Natl Acad Sci 98: 4569–4574.
- ↵R Kelley, T Ideker. 2005. Systematic interpretation of genetic interactions using protein networks. Nat Biotechnol 23: 561–566.
- ↵NJ Krogan, G Cagney, H Yu, G Zhong, X Guo, A Ignatchenko, J Li, S Pu, N Datta, AP Tikuisis, . 2006. Global landscape of protein complexes in the yeast Saccharomyces cerevisiae. Nature 440: 637–643.
- ↵I Lee, B Lehner, C Crombie, W Wong, AG Fraser, EM Marcotte. 2008. A single gene network accurately predicts phenotypic effects of gene perturbation in Caenorhabditis elegans. Nat Genet 40: 181–188.
- ↵H Martin, MC Castellanos, R Cenamor, M Sanchez, M Molina, C Nombela. 1996. Molecular and functional characterization of a mutant allele of the mitogen-activated protein-kinase gene SLT2(MPK1) rescued from yeast autolytic mutants. Curr Genet 29: 516–522.
- ↵G Mas, E de Nadal, R Dechant, ML Rodriguez de la Concepcion, C Logie, S Jimeno-Gonzalez, S Chavez, G Ammerer, F Posas. 2009. Recruitment of a chromatin remodelling complex by the Hog1 MAP kinase to stress genes. EMBO J 28: 326–336.
- ↵V Measday, K Baetz, J Guzzo, K Yuen, T Kwok, B Sheikh, H Ding, R Ueta, T Hoac, B Cheng, . 2005. Systematic yeast synthetic lethal and synthetic dosage lethal screens identify genes required for chromosome segregation. Proc Natl Acad Sci 102: 13956–13961.
- ↵J Mok, PM Kim, HY Lam, S Piccirillo, X Zhou, GR Jeschke, DL Sheridan, SA Parker, V Desai, M Jwa, . 2010. Deciphering protein kinase specificity through large-scale analysis of yeast phosphorylation site motifs. Sci Signal 3: ra12. doi: 10.1126/scisignal.2000482.
- ↵MH Pausch, D Kaim, R Kunisawa, A Admon, J Thorner. 1991. Multiple Ca2+/calmodulin-dependent protein kinase genes in a unicellular eukaryote. EMBO J 10: 1511–1522.
- ↵T Pawson. 2007. Dynamic control of signaling by modular adaptor proteins. Curr Opin Cell Biol 19: 112–116.
- ↵J Ptacek, G Devgan, G Michaud, H Zhu, X Zhu, J Fasolo, H Guo, G Jona, A Breitkreutz, R Sopko, . 2005. Global analysis of protein phosphorylation in yeast. Nature 438: 679–684.
- ↵V Reiser, H Ruis, G Ammerer. 1999. Kinase activity-dependent nuclear export opposes stress-induced nuclear accumulation and retention of Hog1 mitogen-activated protein kinase in the budding yeast Saccharomyces cerevisiae. Mol Biol Cell 10: 1147–1161.
- ↵M Schmidt, A Varma, T Drgon, B Bowers, E Cabib. 2003. Septins, under Cla4p regulation, and the chitin ring are required for neck integrity in budding yeast. Mol Biol Cell 14: 2128–2141.
- ↵A Seshan, AJ Bardin, A Amon. 2002. Control of Lte1 localization by cell polarity determinants and Cdc14. Curr Biol 12: 2098–2110.
- ↵S Sharifpoor, AN Nguyen Ba, JY Youn, D van Dyk, H Friesen, AC Douglas, CF Kurat, YT Chong, K Founk, AM Moses, . 2011. A quantitative literature-curated gold standard for kinase-substrate pairs. Genome Biol 12: R39. doi: 10.1186/gb-2011-12-4-r39.
- ↵J Sidorova, L Breeden. 1993. Analysis of the SWI4/SWI6 protein complex, which directs G1/S-specific transcription in Saccharomyces cerevisiae. Mol Cell Biol 13: 1069–1077.
- ↵MB Smolka, CP Albuquerque, SH Chen, H Zhou. 2007. Proteome-wide identification of in vivo targets of DNA damage checkpoint kinases. Proc Natl Acad Sci 104: 10364–10369.
- ↵R Sopko, D Huang, N Preston, G Chua, B Papp, K Kafadar, M Snyder, SG Oliver, M Cyert, TR Hughes, . 2006a. Mapping pathways and phenotypes by systematic gene overexpression. Mol Cell 21: 319–330.
- ↵R Sopko, B Papp, SG Oliver, BJ Andrews. 2006b. Phenotypic activation to discover biological pathways and kinase substrates. Cell Cycle 5: 1397–1402.
- ↵R Sopko, D Huang, JC Smith, D Figeys, BJ Andrews. 2007. Activation of the Cdc42p GTPase by cyclin-dependent protein kinases in budding yeast. EMBO J 26: 4487–4500.
- ↵C Stark, BJ Breitkreutz, T Reguly, L Boucher, A Breitkreutz, M Tyers. 2006. BioGRID: A general repository for interaction datasets. Nucleic Acids Res 34: D535–D539.
- ↵C Stark, TC Su, A Breitkreutz, P Lourenco, M Dahabieh, BJ Breitkreutz, M Tyers, I Sadowski. 2010. PhosphoGRID: A database of experimentally verified in vivo protein phosphorylation sites from the budding yeast Saccharomyces cerevisiae. Database (Oxford) 2010: bap026. doi: 10.1093/database/bap026.
- ↵AH Tong, M Evangelista, AB Parsons, H Xu, GD Bader, N Page, M Robinson, S Raghibizadeh, CW Hogue, H Bussey, . 2001. Systematic genetic analysis with ordered arrays of yeast deletion mutants. Science 294: 2364–2368.
- ↵AH Tong, G Lesage, GD Bader, H Ding, H Xu, X Xin, J Young, GF Berriz, RL Brost, M Chang, . 2004. Global mapping of the yeast genetic interaction network. Science 303: 808–813.
- ↵S van Wageningen, P Kemmeren, P Lijnzaad, T Margaritis, JJ Benschop, IJ de Castro, D van Leenen, MJ Groot Koerkamp, CW Ko, AJ Miles, . 2010. Functional overlap and regulatory links shape genetic interactions between signaling pathways. Cell 143: 991–1004.
- ↵M Versele, J Thorner. 2004. Septin collar formation in budding yeast requires GTP binding and direct phosphorylation by the PAK, Cla4. J Cell Biol 164: 701–715.
- ↵M Watanabe, D Watanabe, S Nogami, S Morishita, Y Ohya. 2009. Comprehensive and quantitative analysis of yeast deletion mutants defective in apical and isotropic bud growth. Curr Genet 55: 365–380.
- ↵S Wernicke, F Rasche. 2006. FANMOD: A tool for fast network motif detection. Bioinformatics 22: 1152–1153.
- ↵S Yoshida, R Ichihashi, A Toh-e. 2003. Ras recruits mitotic exit regulator Lte1 to the bud cortex in budding yeast. J Cell Biol 161: 889–897.
- ↵H Yu, P Braun, MA Yildirim, I Lemmens, K Venkatesan, J Sahalie, T Hirozane-Kishikawa, F Gebreab, N Li, N Simonis, . 2008. High-quality binary protein interaction map of the yeast interactome network. Science 322: 104–110.
- ↵X Zhao, R Rothstein. 2002. The Dun1 checkpoint kinase phosphorylates and regulates the ribonucleotide reductase inhibitor Sml1. Proc Natl Acad Sci 99: 3746–3751.
- ↵J Zou, H Friesen, J Larson, D Huang, M Cox, K Tatchell, B Andrews. 2009. Regulation of cell polarity through phosphorylation of Bni4 by Pho85 G1 cyclin-dependent kinases in Saccharomyces cerevisiae. Mol Biol Cell 20: 3239–3250.
Notes
[1] [Supplemental material is available for this article.]
[2] Article published online before print. Article, supplemental material, and publication date are at http://www.genome.org/cgi/doi/10.1101/gr.129213.111.