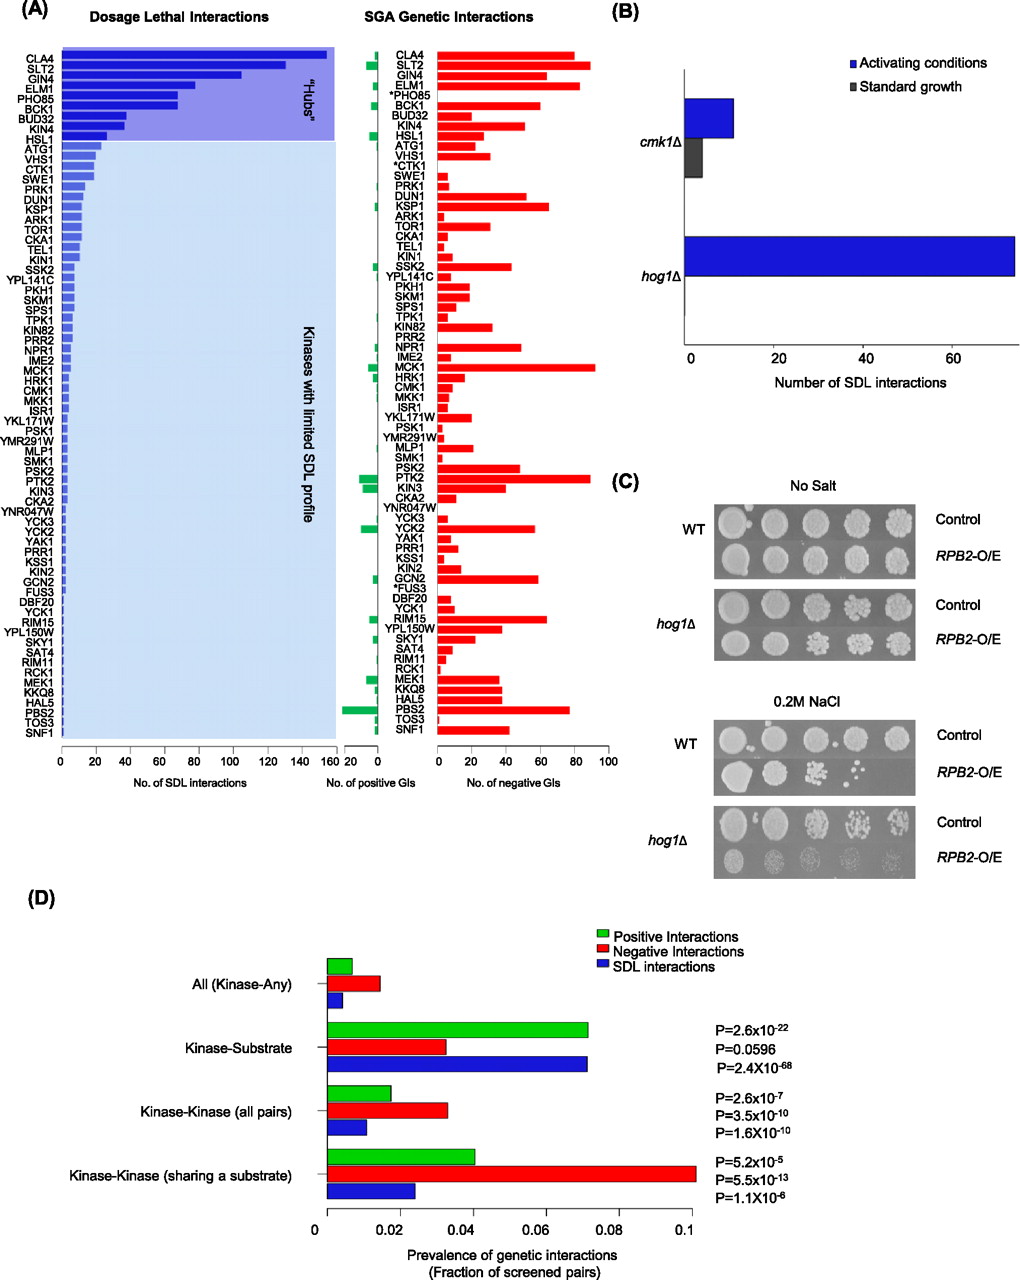
Properties of the kinome SDL interaction network. (A) Distribution of SDL (blue), negative (red), and positive (green) GIs across the kinome using the stringent cutoff. The number of interactions for SDL-positive queries is plotted. (*) Kinases that were not screened for GIs. (B) Conditional screening of hog1Δ and cmk1Δ mutants expands the SDL interaction network. SDL screening of a hog1Δ strain was performed on 0.2 M NaCl (osmotic stress) and on 200 mM CaCl2 for a cmk1Δ strain. (C) Representative serial spot dilution assays illustrating the SDL phenotype caused by overexpression of RPB2 in a hog1Δ strain specifically in activating conditions. (D) Bar graph showing the prevalence of positive (green bar) and negative (red bar) GIs at the intermediate SGA cutoff among kinase–gene (all), kinase–substrate, kinase–kinase, and kinase–kinase pairs that share the same target according to the KID gold standard, as a fraction of gene pairs screened. Prevalence of SDL interactions for each subtype is shown in parallel (blue bar).