
Analysis of the floral transcriptome uncovers new regulators of organ determination and gene families related to flower organ differentiation in Gerbera hybrida (Asteraceae)
- Roosa A.E. Laitinen1,
- Juha Immanen1,
- Petri Auvinen2,
- Stephen Rudd3,
- Edward Alatalo2,
- Lars Paulin2,
- Miia Ainasoja1,
- Mika Kotilainen1,
- Satu Koskela1,
- Teemu H. Teeri1,4, and
- Paula Elomaa1,5
- 1 Department of Applied Biology, FIN-00014 University of Helsinki, Helsinki, Finland
- 2 Institute of Biotechnology, FIN-00014 University of Helsinki, Helsinki, Finland
- 3 Turku Centre for Biotechnology, BioCity, Turku, FIN-20521, Finland
- 4 Department of Biology, University of Tromsø, N-9037 Tromsø, Norway
Abstract
Development of composite inflorescences in the plant family Asteraceae has features that cannot be studied in the traditional model plants for flower development. In Gerbera hybrida, inflorescences are composed of morphologically different types of flowers tightly packed into a flower head (capitulum). Individual floral organs such as pappus bristles (sepals) are developmentally specialized, stamens are aborted in marginal flowers, petals and anthers are fused structures, and ovaries are located inferior to other floral organs. These specific features have made gerbera a rewarding target of comparative studies. Here we report the analysis of a gerbera EST database containing 16,994 cDNA sequences. Comparison of the sequences with all plant peptide sequences revealed 1656 unique sequences for gerbera not identified elsewhere within the plant kingdom. Based on the EST database, we constructed a cDNA microarray containing 9000 probes and have utilized it in identification of flower-specific genes and abundantly expressed marker genes for flower scape, pappus, stamen, and petal development. Our analysis revealed several regulatory genes with putative functions in flower-organ development. We were also able to associate a number of abundantly and specifically expressed genes with flower-organ differentiation. Gerbera is an outcrossing species, for which genetic approaches to gene discovery are not readily amenable. However, reverse genetics with the help of gene transfer has been very informative. We demonstrate here the usability of the gerbera microarray as a reliable new tool for identifying novel genes related to specific biological questions and for large-scale gene expression analysis.
Gerbera hybrida belongs to the large sunflower family of plants and has gained increasing interest as a new model plant for developmental studies in Asteraceae (Daly et al. 2001; Shepard and Purugganan 2002; Buzgo et al. 2004). In gerbera, three different types of flowers form a densely packed inflorescence. Marginal ray flowers are strongly ligulate and zygomorphic (bilaterally symmetrical), with fused, showy petals. In the female ray flowers, anther development is initiated normally, but aborted later. The central disc flowers are hermaphrodite, bearing both anthers and carpels. Unlike in other model plants, including Arabidopsis thaliana, Antirrhinum majus, and Petunia hybrida, the inferior ovary develops below the whorls of floral organs. The corolla (petals) is reduced in the disc flowers, and towards the center of the inflorescence the symmetry changes from bilateral to radial. Gerbera bears a third type of flowers between the ray and disc flowers. These trans flowers are female like the ray flowers, but the length of the petals varies in different varieties. All flowers are surrounded by a hairy structure (pappus bristles), which later forms a parachute for the single seed developing in each flower. Pappus bristles (or scales) are typical of Asteraceae, and it has been argued whether they are structures that originate outside of the flower. Although morphologically highly specialized, our previous work shows that pappus bristles behave as sepals in experiments where flower-organ determination is changed by genetic transformation with MADS-box genes (Yu et al. 1999).
We have previously approached these Asteraceae specific developmental features by investigating to what degree the ABC model of flower development can be applied to a new family of plants not previously studied. With help of transgenic gerbera plants, we discovered that the B and C functions in defining petal, stamen, and carpel identity are conserved in gerbera flower development (Yu et al. 1999). Gerbera has also contributed to the refinement and improvement of the genetic models of flower development. In Arabidopsis, a redundantly acting family of transcription factors (SEP1–3) is needed for petal, stamen, and carpel development. In gerbera, this family has diverged in function. The gerbera GRCD1 is needed for stamen development (Kotilainen et al. 2000) and GRCD2 for carpel development (Teeri et al. 2002; Uimari et al. 2004). In addition, GRCD2 affects meristem determinacy and fate at both the flower and inflorescence level (Uimari et al. 2004). An integrated control over reproductive meristem fate has not been detected in the model systems, which have a different pistil design and normally bear indeterminate inflorescences. Also, the analysis of secondary metabolism in gerbera has revealed gene functions previously not known from other plants. A chalcone synthase related enzyme in gerbera represents a novel class of plant polyketide synthases and is responsible for biosynthesis of defense compounds (Helariutta et al. 1996; Eckermann et al. 1998). Our findings demonstrate how important it is to complement investigations in the universal models with models chosen from different families of flowering plants.
Instead of studying single genes or a few genes at a time, the development of automated DNA sequencing has made larger-scale sampling of the floral transcriptome attractive. High-throughput sequencing of expressed cDNAs (ESTs) has been applied in only a few species within Asteraceae (e.g., Lactuca, Helianthus, and Zinnia) (http://www.ncbi.nlm.nih.gov/dbEST/dbEST_summary.html). In this paper, we report on the analysis of a gerbera EST database constructed from various tissues for gene mining. Furthermore, a UniGene set selected from the ESTs has been used for the construction of a cDNA microarray. In the experiments presented in this paper, we have used the microarray to identify flower-specific genes, as well as genes specific to scape, pappus, stamen, and petal development in gerbera.
Results
Gerbera EST database
Gerbera cDNA libraries were constructed from eight different tissues of variety Terra Regina and one tissue of variety Terra Nero (Supplemental Table 1). After sequencing, altogether 16,994 sequences that passed quality control were entered into a Sputnik EST database (Rudd et al. 2003). Assembly of the EST sequences yielded 8098 UniGenes of which 68% contained a single sequence (singletons) (Table 1). Of the UniGenes, 22% contained two or three ESTs (1267 and 511 clusters respectively), while 1% of the UniGenes (115) contained more than 10 sequences. Analysis of the ESTs, their UniGenes, annotations, and derived peptide sequences was performed within the context of the Sputnik EST database, which can be viewed in its entirety at the OpenSputnik Web site (http://sputnik.btk.fi).
Functional classification of the gerbera EST collection
Functional annotation of gerbera ESTs
Functional assignments were calculated from BLASTX, performed for the functionally annotated proteins from the Arabidopsis genome (the MIPS Funcat). The distribution of the functional classes in each of the libraries is shown in Table 1. In total, 29.2% (2361) of the UniGene sequences were homologous to Arabidopsis proteins of known function, with another 12.4% similar to Arabidopsis proteins of unknown or unclear function. The remaining 58.5% of UniGene sequences without a BLAST match above the threshold were designated as “unknowns”. ESTScan was used to predict protein-coding regions for each of the UniGenes. Regions outside of predicted open-reading frames (ORFs) were interpreted as a probable UTR sequence and were removed from the analysis. This filtering step left a subset of “Novel functionally unassigned CDS”-UniGene sequences that amounted to 44.8% of all sequences. The fraction of sequences with novel CDS in different libraries varied between 36%–46%.
Functional annotation has also been performed using Gene Ontology. Sequences were compared with the SWISS-PROT database of proteins using BLASTX, and the results were again filtered using the expectation value of 1e-10. The SWISS-PROT2Go Gene Ontology classifications were used to assign individual sequences to a given functional class. The GOSlim schema was used to represent the data in a summarized form (Supplemental Table 2).
Comparison with other plant genome and EST databases
The gerbera sequence collection was placed in comparative context with other plant species. As references, the annotated Arabidopsis and rice protein collections were included along with the draft Populus trichocarpa genome and all available Medicago truncatula BAC sequences. To identify putatively lineage-specific sequence families, complete Sputnik clustered EST collections were pooled to form Asterid, Eurosid, Caryophyllid, and monocot collections. Each gerbera UniGene sequence was compared with all these collections using the BLASTP and BLASTN methods (Table 2). While 59% of gerbera sequences have a counterpart in the annotated Arabidopsis proteome, 57% of sequences have a match within the Asterid collection. When the comparison is restricted to Asteraceae (pooled Helianthus, Lactuca, and Zinnia sequences) 54% of gerbera sequences have a match (data not shown). Five percent of gerbera sequences give hits to ESTs found only within the Asterid. However, most of these sequences gave scores <100 and cannot be assigned to functional classes. The sequences are provided in Supplemental Table 3. Of the 8098 gerbera sequences, 2567 sequences (32%) do not have a match to a known sequence (data not shown). Of these, 35% can be excluded as short sequences or sequences likely to represent UTRs (less than 10% of coding potential). This results in 1656 (20%) of gerbera sequences not observed elsewhere within the plant kingdom. Increasing the restrictions by removing sequences with <50% or 75% of coding potential still leaves 17% and 14% of all sequences unassigned, respectively (data not shown).
Comparison of the gerbera UniGene collection with other sequence collections from whole genomes, partial genomes or large EST projects
Microarray analysis of genes upregulated in inflorescence
The longest sequence representing each UniGene was selected to be printed on the gerbera cDNA microarray. For identification of genes specifically expressed in flower tissues, we made a simple gene expression comparison between flower and leaf tissue. The microarray data were first filtered by confidence, using a p-value of 0.05 as a threshold. An additional filtering was applied to reveal genes showing at least a twofold expressional difference between the two samples. Using this approach, we identified 353 cDNAs upregulated in flowers and 369 in leaves (Supplemental Tables 4 and 5). The identified cDNAs mostly originated from the corresponding libraries, indicating that they are likely to represent abundantly expressed tissue-specific genes. Not surprisingly, cDNAs involved in basic metabolism and energy were found to be upregulated in the photosynthetic leaf tissue. However, in flower tissues, cDNAs annotated to the class `transcription,' as well as cDNAs encoding non-specific lipid transfer proteins (nsLTP) were more abundant than in leaves.
Typically, the cDNAs encoding transcription factors upregulated in flowers were MADS-box genes, which are known regulators of flower-organ development (Supplemental Table 4). The gerbera B-function MADS-box genes, GGLO1 and GDEF2, which have previously been shown to be required for stamen and petal development (Yu et al. 1999) showed more than twofold upregulation in flowers as compared to leaves. Also, the previously reported C-function genes GAGA1, as well as the AGL2/SEP-like genes GRCD1, GRCD2, and GRCD3 (Yu et al. 1999; Kotilainen et al. 2000; Teeri et al. 2002; Uimari et al. 2004), were specifically expressed in flowers. In addition to these, we identified three new AGL2/SEP-like MADS-box genes. The first of these (G0000700003A03) is closely related to gerbera GRCD1 and GRCD2 (S. Ruokolainen, unpubl.), while the second (G0000100005G11) is most similar to the petunia FBP9 and groups phylogenetically to the AGL2/SEP clade (gene G1005B02 in Teeri et al. 2002). The petunia FBP9 is highly expressed in ovules (Immink et al. 2002); however, in gerbera, G0000100005G11 is specifically expressed during late petal development (see Table 4 below). The third of the AGL2/SEP-like genes (G0000200057B11) shows similarity to FBP5, required for B and C function activity and ovule development in petunia (Vandenbussche et al. 2003; Ferrario et al. 2003). G0000100021A03, which encodes a TM3-like MADS-box factor similar to the petunia FBP22 (Teeri et al. 2002; Vandenbussche et al. 2003), was also upregulated in flowers and more specifically in late petal development. Only one EST (G0000500009H11) was shown to encode for a leaf-specific MADS-box factor, most similar to the petunia FBP13, which phylogenetically groups to the STMADS11 clade as determined by Vandenbussche et al. (2003). In addition to MADS-domain factors, two cDNAs encoding MYB domain transcription factors (G0000100022G06 and GMYB8) were upregulated in flowers.
Microarray analysis of various flower organs reveals several abundantly expressed tissue-specific genes during late petal development
Gene expression profiling of different flower organs
For the identification of transcripts specific to individual flower organs, gene expression in flower scape, pappus bristles (sepal), petals (early and late developmental stage), and stamens was analyzed. To reveal genes that are specific to or at least strongly enriched for each of the organs, we selected genes showing at least a fourfold expression difference after filtering statistically significant expression differences using the p-value threshold of 0.05. Furthermore, genes that were upregulated in more than one of the organs were not included. All the cDNAs identified from various floral organs using the fourfold threshold level are shown in Supplemental Table 6.
We identified 11 scape-, 35 pappus-, 26 early petal-, 120 late petal-, and 143 stamen-specific genes. Six of the eleven genes specific for flower scape were encoding previously unknown proteins. The scape tissue represents typical green tissue (like leaves), as many photosynthetic genes were upregulated when compared to other floral organs (data not shown). We present below the most interesting findings concerning genes specifically expressed in pappus bristles and stamens, as well as during early and late petal development.
Gene expression specific to pappus bristles
The first whorl of organs in gerbera consists of hairy pappus bristles that are simplified structures lacking, e.g., vascular bundles. In the microarray analysis, a high proportion (18/35) of the upregulated cDNAs detected no similarities in BLAST searches, which may reflect the specific nature of these organs.
Most of the upregulated transcripts are connected to plant secondary metabolism or cell structures (Table 3). N-hydroxycinnamoyl/benzoyltransferases catalyze the first reaction of biosynthesis of phytoalexins, which are defense compounds induced by plant pathogens (Yang et al. 1997). cDNAs encoding homologs of dihydroflavonol reductases and glucosyltransferases represent genes of the phenylpropanoid pathway and may functionally be involved in anthocyanin biosynthesis or in lignan and lignin biosynthesis (Humphreys and Chapple 2002). We also detected two cDNAs encoding laccases. Lignans are mainly involved in a plant's defense (as antioxidants and biocides) whereas lignins are major cell wall components. However, lignification of the plant cell wall is also a typical defense response.
Microarray analysis of various flower organs reveals several abundantly expressed tissue-specific genes in pappus and stamens
Furthermore, we identified several cDNAs encoding other cell wall related proteins such as xyloclucan endotransglycosylase (XET) related protein, putative microtubule associated protein, and cellulose synthase subunit protein in pappus bristles (Table 3). Applying a twofold threshold, we identified cDNAs encoding arabinogalactan protein, expansin, cellulase, chitinase, and β-galactosidase (data not shown). These all have putative roles in cell wall extension or degradation (Darley et al. 2001; Brummel and Harpster 2001).
Stamen-specific gene expression
Only the disc flowers of gerbera are hermaphrodite, while the ray and trans flowers are female. Stamens were collected at developmental stages 6 and 8, when the anthers are still covered by petals, and at stage 9 when the two outermost rings of anthers are visible and pollen is released (Helariutta et al. 1993). Filtering the data with a fourfold difference revealed 143 cDNAs specific for stamen development, of which 67 were still revealed with an eightfold difference. Of these, 60% represented genes encoding unknown proteins.
Many cell wall related genes were upregulated in stamens (Table 3). However, as a result of our way of analysis, those listed here are encoded by different gene family members than those identified in pappus bristles or in other organs. Cellulases, pectinmethylesterases, and exopolygalacturonases (pectinases) are all enzymes involved in cell wall weakening or degradation (Darley et al. 2001). Cytoskeleton-associated ESTs encoding actin depolymerising factor (ADF) and tubulin were also upregulated in gerbera stamens. In Arabidopsis, the ADF genes form a large family consisting of at least nine members (Dong et al. 2001). Gerbera cDNA microarray includes nine ESTs encoding ADFs, for which we detected three distinct expression profiles (data not shown). There was one stamen-specific ADF, but also two ADF2-like genes that were specifically expressed during late petal development. A homolog of the Arabidopsis AtADF4 gene showed pappus-specific expression in gerbera. In addition to actin filaments, the cytoskeleton is composed of microtubules that mediate organized cell growth, division, and morphogenesis (for review, see Meyer and Jürgens 2002). The gerbera cDNA microarray contains 27 tubulin encoding cDNAs (14 α-tubulin, 11 β-tubulin, and one leaf-specific γ-tubulin). The majority of these did not show any significant expressional differences in the organs studied (data not shown), but there were also cDNAs showing tissue specificity, such as EST G0000400021E04 encoding α-tubulin, which was highly upregulated during stamen development. ESTs encoding transcription factors similar to the LIM domain proteins PLIM1 and PLIM2 were more than eightfold upregulated in gerbera stamens, but not expressed at all in other organs (Table 3). As with their animal counterparts, the LIM domain proteins of plants are suggested to participate in the organization of the actin cytoskeleton in the cytoplasm as well as in transcriptional regulation in the nucleus (Eliasson et al. 2000; Mundel et al. 2000). In the sunflower (Helianthus annuus), PLIM1 and PLIM2 have been shown to be pollen-specific (Baltz et al. 1992; Eliasson et al. 2000), as are the homologs in petunia and Arabidopsis (Guyon et al. 2000; Becker et al. 2003).
Several putative senescence-associated and pathogenesis-related genes were upregulated in gerbera stamens (Table 3). The vignain precursor gene encodes a cysteine proteinase associated with proteolytic cleavage during senescence and programmed cell death (Ueda et al. 2000; Eason et al. 2002; Bhalerao et al. 2003). We also observed upregulation of a cDNA encoding S-adenosylmethionine decarboxylase involved in polyamine biosynthesis. Polyamines, however, act opposite to ethylene and have been reported to slow down the senescence process, although they may also be connected to plant defense responses (for review, see Pandey et al. 2000). In populus, a homolog of early light-induced protein has been previously shown to be more than 13 times abundant in the senescing autumn leaf library than in the young leaf library (Bhalerao et al. 2003). The highly upregulated defense-related cDNAs encode thaumatin-like (PR5-like) protein and PR-1 protein.
Genes specific for developing petal
Gerbera petal development was divided into early and late stages. The early petal sample covers developmental stages 1–4, and the late petal sample stages 5–9 (Helariutta et al. 1993). During the early stages of development, ray flower petals grow from <5 mm to -20 mm in length (Helariutta et al. 1993). During this rapid elongation stage, the petal is expanding both longitudinally and laterally (Kotilainen et al. 1999b). Anthocyanin pigmentation starts at stage 4, proceeds basipetally, and at stage 7, the ray and trans flower petals are fully pigmented (Helariutta et al. 1993). The rapid opening of the inflorescence takes place between stages 7 and 8 and is connected with the cessation of petal cell growth (Kotilainen et al. 1999b).
A comparison of the early petal sample with the other flower organs revealed only 26 upregulated ESTs (Supplemental Table 6). Four of these were annotated as unknowns. Several cDNAs encoding histones H2A, H2B, H3, and H4 were shown to be specific for the early petal development, while cDNAs encoding histone H1 were equally expressed in all organs (data not shown). Histone mRNA and proteins are synthesized in a cell-cycle dependent manner at the beginning of the S phase (Old and Woodland 1984). This mode of synthesis would explain the high abundance of histone mRNA in the actively dividing tissues of young inflorescences and during the early stages of petal development.
A larger number of cDNAs (120) were upregulated during late petal development (Table 4, Supplemental Table 6). Of these, 45% were annotated as unknown sequences. We identified several cDNAs encoding enzymes of plant secondary metabolism. These include homologs of glycosyltransferases, isoflavone reductases, and flavonol synthases of the phenylpropanoid pathway. A putative tropinone reductase involved in tropane alkaloid biosynthesis (Fucchini 2001) was also upregulated during late petal development. Tropinone reductase encoding cDNAs have previously been identified from Iris tepals (van Doorn et al. 2003). Several MADS-box transcription factors showed flower-specific expression in comparison with leaf tissue in our previous analysis. In the organ comparison, the cDNA encoding MADS-box transcription factors similar to petunia FBP9 (G0000100005G11) and the TM3-like cDNA (G0000100021A03), as well as several putative zinc finger proteins, were upregulated in the late petal sample, suggesting a specific role during petal development.
Interestingly, a single group of cDNAs, encoding non-specific lipid transfer proteins (nsLTPs), forms one of the largest functional classes during late petal development. LTPs were already detected as one of the major classes of ESTs in flowers when compared with the leaf tissue. A BLASTX search of the SWISS-PROT database revealed 14 different clusters encoding putative LTPs in the gerbera sequence database. Amino acid sequence comparisons of the consensus sequences retrieved from the individual clusters indicated that they encode at least 10 different LTP cDNAs (Fig. 1A). GLTP1, corresponding to the largest cluster (C_G0000300001A01), was previously cloned from gerbera as a corolla-abundant cDNA in a differential screening against leaf tissue (Kotilainen et al. 1994). Expression analysis shows that the cDNAs encode tissue-specific members of the LTP gene family and that specific gene family members for at least late petal, stamen, and scape can be identified (Fig. 1B).
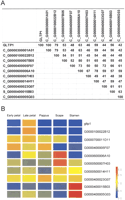
ESTs encoding non-specific lipid transfer proteins are the most abundant transcripts during late petal development in gerbera. Gene mining of the gerbera EST database revealed a gene family composed of at least ten LTP genes. (A) Sequence similarity comparison between the gerbera LTPs based on amino acid similarity (%) of the consensus sequences retrieved from gerbera LTP clusters indicate that the cDNAs are encoding different gene family members. GLTP1 represents the previously isolated gerbera gene [X31588] and corresponds to C_G0000300001A01. (B) Expression analysis of the gerbera LTP genes detected in the microarray comparison of various flower organs reveals several tissue specifically expressed gene family members. The probe for GLTP1 corresponds to C_G0000300001A01. Cluster C_G0000500007B05 is represented by the EST G0000700011D11 on the microarray.
Reliability of the gerbera cDNA microarray and verification of the results
The microarray analyses presented here are composed of two biological replicates (independently collected RNA samples) each of which contained three to four technical replicates. The quality and reliability of the microarray hybridizations were evaluated by calculating the correlation between the technical, as well the biological, replicates (Table 5, Supplemental Figure 1). For each experiment, the correlation between the technical replicates was >0.6 in the first biological sample and >0.4 in the second. Correlation between the two biological replicates was at least 0.7, which is considered to be good when using cDNA microarrays (Tuimala 2003). This confirms that the gerbera cDNA microarray is a reliable tool for large-scale gene expression analysis.
Correlation between the technical and biological replicates
Furthermore, we randomly chose five ESTs showing differential expression in flower versus leaf comparisons and designed primers for quantitative PCR. An EST (G0000100001G09) encoding ubiquitin was used as an internal control, to which gene expression was normalized (ΔCT). The same mRNA samples of flowers and leaves used in the microarray analysis served as templates in real-time RT-PCR. In all cases, the flower versus leaf ratio was in concordance in both analyses, indicating the reliability of the gerbera microarray (Table 6). However, for some of the ESTs, PCR suggested larger differences at expression levels. For example, the EST encoding a polyphenol oxidase showed 2.4-fold upregulation in leaves in the microarray analysis, but PCR repeatedly indicated more than 200-fold differences. This shows the wider dynamic range, sensitivity, and accuracy of the quantitative PCR methods in comparison with the microarray method as also previously reported (Horak and Snyder 2002; Czechowski et al. 2004).
Verification of the expression data retrieved from the microarray comparison of flowers versus leaves with real time reverse transcriptase PCR.
Discussion
Flower development in Gerbera hybrida shows several characteristics that cannot be studied in the traditional model plants. The accumulation of sequence data from taxonomically diverse species evidently benefits the functional analysis of the corresponding genes in all experimental systems, as well as the understanding of plant evolution both from a historical and a mechanistic perspective (Cronk 2001; Albert et al. 2002; Frohlich 2003). Our previous work demonstrates that sequence comparisons, in combination with phylogenetic analyses, reveal functionally related gene groups, but also produce predictions for gene duplication and functional diversification (Helariutta et al. 1996; Eckermann et al. 1998; Teeri et al. 2002; Elomaa et al. 2003; Uimari et al. 2004). Currently, among the top 28 plant species, ESTs for only two species representing Asteraceae (Lactuca sativa and Helianthus annuus) are available (Rudd et al. 2003; http://www.ncbi.nlm.nih.gov/dbEST/dbEST_summary.html), although Asteraceae is among the largest families of plants with more than 23,000 species (Bremer 1994). Comparison of the gerbera EST data with the available plant genomes and pooled EST collections representing evolutionary distinct lineages within the plant kingdom nicely demonstrates the high potential for the discovery of novel genes.
Identification of putative new regulators of flower organ development and differentiation
We identified several transcription factors specifically upregulated in flowers, which strongly suggests putative functions for them in flower organ development and/or differentiation. The gerbera EST database has 18 clusters of sequences showing similarity to MADS-domain transcription factors. These include seven of the nine MADS-box genes that we have previously isolated from gerbera using traditional cDNA library screening or PCR approaches (Yu et al. 1999; Kotilainen et al. 2000; Uimari et al. 2004). The efficiency of EST sequencing is especially reflected in the number of new genes identified in this project, which is still moderate in size. We identified four new MADS-box genes specifically upregulated in flowers, as well as one with leaf-specific expression. In combination with phylogenetic analysis, the precise functional roles for these will be investigated using transgenic approaches.
Gerbera secondary metabolism has been of interest to us both in understanding the regulation of anthocyanin pigmentation (Helariutta et al. 1995; Elomaa et al. 1998; Elomaa et al. 2003) and the biosynthesis of secondary compounds that contribute to pathogen and insect resistance (Helariutta et al. 1995; Eckermann et al. 1998). Microarray comparison of flower tissues with leaf tissue revealed putative new regulators of the general phenylpropanoid pathway, which leads to the biosynthesis of important secondary metabolites such as lignin, flavonoids, and phytoalexins (for review, see Weisshaar and Jenkins 1998). The two gerbera MYB domain transcription factors upregulated in flowers are most similar to Antirrhinum MYB305 and MYB340 and to pea MYB26, which are all specifically expressed in flowers and share similar DNA binding properties (Moyano et al. 1996; Uimari and Strommer 1997; Elomaa et al. 2003). The Antirrhinum MYB305 and MYB340 have been shown to activate phenylalanine ammonia lyase (PAL), chalcone isomerase (CHI), and flavanone 3β-hydroxylase (F3H) gene promoters (Sablowski et al. 1994; Moyano et al. 1996). We also identified the LIM-domain proteins that have been shown to bind phenylpropanoid pathway gene promoters in tobacco and affect the lignin pathway in transgenic plants (Kawaoka et al. 2000; Kawaoka and Ebinuma 2001). Kawaoka et al. (2000) suggested that these might compete with MYB factors in binding to the same promoter elements. However, the gerbera LIM domain proteins were specifically expressed in stamens, where they might have a specific function. The ACBF DNA binding proteins have been postulated to regulate phenylpropanoid pathway genes during xylogenesis and are represented as small gene families in tobacco and Arabidopsis (Séguin et al. 1997). A homolog of an ACBF protein was upregulated during late petal development in gerbera (Table 4). A flower-specific ACBF protein was also identified in Arabidopsis when gene expression was compared in leaf and flowers (Hu et al. 2003).
Flower organ comparison revealed several marker genes related to their differentiation
Flower organ development in gerbera differs in many respects from the basic symmetrical angiosperm flower (e.g., Arabidopsis) and evidently involves both conserved and derived features at the molecular level. In the microarray comparisons, several developmental stages were pooled and, therefore, it is likely that genes that are expressed at a low level, or whose expression is spatially restricted to a limited number of cells or to a narrow developmental window, are not highlighted. Moreover, using a cDNA microarray, we cannot rule out the possibility that due to the cross-hybridization of different gene family members, we may not detect all differentially expressed genes. However, including two biological replicates and using a fourfold expression threshold in the analyses, we consciously aimed to reveal only the truly tissue-specific genes, or at least those highly enriched.
Interestingly, in gerbera, the highest numbers of tissue-specific genes were detected in stamens and in the late petal sample, as well as in pappus bristles. In analyzing gene expression in Arabidopsis homeotic mutants, Wellmer et al. (2004) showed that the majority of organ-specific expressed genes originated from stamens and carpels, while only few were assigned to the organs of perianth (sepals and petals). Unlike, for example, in Arabidopsis, the styles of carpels in gerbera are fine, elongated, non-photosynthetic structures that may also be anthocyanin pigmented like the other floral organs. In gerbera, genetic programs involved in petal and carpel differentiation have shown similarities in several cases (Kotilainen et al. 1999a; Kotilainen et al. 1999b). We did not include carpels in this analysis, although based on the results obtained in Arabidopsis (Wellmer et al. 2004), it would be interesting to compare whether the substantial anatomical differences are reflected at the gene expression level and whether the previously detected expressional similarities between carpels and petals are observed on a larger scale.
In gerbera, the molecular mechanisms involved in the arrest of stamen development in ray flowers are still completely unknown. Typically, the gerbera stamen sample (including pollen) revealed many genes related to the cell wall, which correlates well with the genes identified in stamen or pollen transcriptomes of other plants. In Arabidopsis, 162 genes were selectively expressed in pollen grains in a microarray comparison of hydrated pollen grains to vegetative tissues (Becker et al. 2003). As in gerbera, the identified genes included exopolygalacturonases, pectinesterases, XET, and a putative LIM-domain protein (Becker et al. 2003). We also identified several cell wall related enzymes specific for pappus development. The reason for this could be that the pappus sample comprises stages during which rapid cell expansion is taking place. It remains to be studied whether all of these are involved in cell wall extension or are activated in response to pathogen infection.
Cytoskeletal proteins encoding tubulin and ADF proteins were detected both in the stamen sample and in the late petal sample using a twofold threshold level in the analysis (data not shown). Cytoskeleton-associated ESTs were revealed as pollen-expressed ESTs in Arabidopsis (Honys and Twell 2003). During stamen development, they may be involved in cell elongation and morphogenesis, together with other cell wall related enzymes, as well as with organized cell division (Meyer and Jürgens 2002). During late petal development, they may have a specific functional role during the opening of the inflorescence, which involves substantial changes in cell expansion and results in dramatic morphological changes in the petals (Kotilainen et al. 1999b). We have previously studied the role of GEG during flower opening and shown that it acts as a negative regulator of cell elongation and thus has a central role in determining the shape of the petals and carpels (Kotilainen et al. 1999b). In addition to GEG, using a twofold threshold, we identified members of the extensin and XET gene families upregulated in late petals (data not shown). A more detailed microarray analysis of petal development is facilitated due to the regular shape and large size of gerbera petals.
Abundance of defense related genes in stamens
The upregulation of several defense and pathogenesis related (PR) proteins specifically in the stamen sample suggest that stamens (or pollen) may have a functional role in defense reactions against pathogens. Gerbera is highly susceptible to grey mold, caused by the fungal pathogen Botrytis cinerea, which can directly penetrate undamaged plant tissue through the cuticle (van Kan et al. 1997). We have infected gerbera with B. cinerea in controlled greenhouse conditions and observed that, in flowers, infection sequentially proceeds towards the center of the inflorescence when new whorls of anthers become exposed (S. Koskela, M. Ainasoja, P. Söderholm, P. Vuorela and T.H. Teeri, in prep.). Early findings in strawberries and beans have indicated that pollen has a stimulatory effect on Botrytis spore germination and virulence (Chou and Preece 1968; Mansfield and Deverall 1971). Thaumatin-like protein encodes a pathogenesis-related protein (PR-5) homologous with the permatins that permeabilize fungal membranes and may possess antifungal activities against oomycete fungi (for review, see van Loon and van Strien 1999; Hu and Reddy 1997; Wang and Ng 2002). Similarly, the PR-1 proteins upregulated in gerbera stamens may have antifungal activity, although their mode of action is still largely unknown (van Loon and van Strien 1999). Also, lipid transfer proteins (LTPs, PR-14) are known to inhibit bacterial and fungal pathogens. Defining the putative functions of the identified ESTs upregulated in stamens as defense compounds against fungal diseases would provide valuable information for gerbera breeding.
Lipid transfer proteins are major transcripts present during late petal development
The extremely high expression of genes encoding lipid transfer proteins seems to be unique for gerbera petal development. LTP encoding genes are ubiquitous in higher plants and, for example, in the Arabidopsis genome >40 genes have been identified (Blein et al. 2002). The exceptionally high expression level in gerbera raises questions about the functional role of LTPs during late petal development. Although LTPs have been purified from various plant sources, the exact biological functions of these secreted proteins are largely unclear (Kader 1997; Blein et al. 2002). They have been suggested to have different functions, including cutin biosynthesis, surface wax production, pathogen-defense reactions, or the adaptation of plants to environmental changes (Kader 1997). LTPs may also act as plant defense proteins, and some of them are stress induced. Maldonado et al. (2002) identified an Arabidopsis mutant (dir1-1) that failed to develop systemic acquired resistance (SAR) after inoculation with a virulent pathogen. They suggested that DIR1, which encodes an apoplastic LTP, promotes long-distance signaling during SAR.
High LTP expression during late petal development in gerbera has been detected several times since the isolation of GLTP1 (Kotilainen et al. 1994), and is thus most probably not induced by stress or pathogens during greenhouse growth. It is still possible that GLTPs are encoding proteins related to pathogen defense either by forming hydrophobic protective layers that inhibit fungal growth or by acting as signal molecules. The partial characterization of the large gene family in this study suggests that the various gene family members may have been functionally diverged. A systematic phylogenetic study of LTP sequences and an expressional analysis combined with reverse genetics approaches are required for functional characterization of the individual gene family members.
Methods
Construction of the cDNA libraries
Eight cDNA libraries were constructed from greenhouse grown Gerbera hybrida variety Terra Regina and one library from variety Terra Nero. The various stages of inflorescence development are defined in Helariutta et al. (1993). For leaf development we used the following definitions: stage 1—young leaves, not fully opened, hairy, 10–15 cm; stage 2—half opened, narrow leaves, 20–30 cm; stage 3—almost fully open, already widened leaves, >30 cm; stage 4—fully open leaves, deep intersections, >30 cm. The detailed description of the samples collected for the cDNA libraries are provided as Supplemental material (Supplemental Table 1). Total RNA was isolated using Trizol reagent (Life Technologies/Gibco-BRL) according to the manufacturer's instructions. For mRNA isolation, the polyATtract mRNA isolation system IV (Promega) was applied. cDNA libraries were prepared by using cDNA Synthesis, Uni-ZAP XR Vector, and Uni-ZAP XR Gigapack III Gold Cloning Kits (Stratagene) according to the manufacturers' instructions.
Sequencing of the libraries
For DNA sequencing, bacterial colonies were picked by Q-Pix colony picker (Genetix) to 96 deep-well plates. Inserts were amplified with Reverse and M13–20 primers using bacterial lysates as templates. The PCR products were analyzed by gel electrophoresis and purified on MultiScreen-PCR Plates (Millipore). PCR and sequencing reactions were performed automatically using Genesis RSP100 (Tecan) robotic worktables. Sequencing was performed using the BigDye Terminator Cycle Sequencing kit (Perkin Elmer Applied Biosystems) with T3 sequencing primer. After filter purification (Millipore MAHVN 4550 with G-50 Fine Sephadex), samples were analyzed with ABI 3700 capillary sequencer using 5% performance optimized polymer.
Sequence processing, clustering, BLAST searches and annotation
All the sequences were quality checked before clustering and adding to the Sputnik EST database. Base calling was performed using PHRED with a threshold value of 20. Vector sequences, poor quality sequences, and short sequences (<150 bp) were removed. EST sequence collections were annotated within the Sputnik framework for comparative plant genomics (Rudd et al. 2003; Brenner et al. 2003). Prior to clustering, sequences were masked of simple repeats using RepeatBeater (Biomax Informatics). Sequence clustering was performed using the Hashed Position Tree 2 algorithm (Biomax Informatics) using a similarity threshold of 0.7 and as many network iterations as there are EST sequences in order to maximize the aggregation of sequences within a cluster. Assembly was performed using CAP3, using standard parameters. Peptide sequences were derived for all UniGenes using the ESTScan application (Iseli et al. 1999). Prior to the ESTScan predictions, a gerbera species-specific ESTScan model was created by training with ORFs identified through BLASTX against SWISS-PROT filtered using the expectation value of 1e-10. The peptide predictions were used to estimate the amount of CDS within both individual EST and cluster consensus sequences. Sequences were annotated for homology using the BLASTN and BLASTX algorithms against a non-redundant protein sequence database, the SWISS-PROT database, the Arabidopsis thaliana and Oryza sativa genome databases, and sequence databases containing the aggregated Sputnik consensus sequences for Asterid, Eurosid, Caryophyllid, and monocot genomes. Sequences were additionally functionally characterized in context with the MIPS Funcat and the Gene Ontology. All Sputnik annotations are available through the Sputnik Web server (http://sputnik.btk.fi).
Construction of the cDNA microarray
Initial assembly of the gerbera EST sequences yielded 8757 clusters (data not shown). From each of these clusters, the longest sequences were selected and printed on microarrays. Clones were picked using a Biorobot 3000 (Qiagen) to 96-well plates. Plasmids were purified using Whatman GF/C plates for PCR. The quality of PCR products was checked on 1% agarose gels. Five microliters of the PCR products were reorganized on 384-well printing plates with 3× SSC printing solution. PCR products were printed on poly-L-lysine (Sigma, P8920) coated slides using an Omnigrid high-throughput arrayer (GeneMachines/A1 Biotech) and UV crosslinked after printing. Aliquots of the PCR products were resequenced to confirm the identity of the printed PCR fragments. The gerbera microarray contains 9000 EST probes, spiking controls, and 50 previously cloned gerbera genes that were used as positive and negative controls. PCR products were spotted once on the slides except the 50 control genes, which were printed as duplicates. Detailed information of the array has been submitted to www.ebi.ac.uk/arrayexpress/.
Sample preparation, probe labeling, and microarray hybridization
For the comparison of leaf to inflorescence, the leaf RNA sample was collected from stages 1, 2, 3, and 4, and the inflorescence sample from stages 2, 4, 6, and 8 (Helariutta et al. 1993) and contained all flower types with all whorls of organs. Total RNA was extracted separately from the different stages using Trizol reagent and 150 μg of total RNA from each stage was pooled before mRNA isolation. mRNA was isolated using the NucleoTrap mRNA isolation kit (Clontech). Two biological replicates were done. Each biological sample contained four technical replicates of which two were dye-swapped.
Reverse transcription was started by mixing 4 μg mRNA with 3 μl amino-oligodT and heated 10 min at 65°C. Master mix (6 μl 5× first strand buffer; 3 μl 10 dNTP mix including 5 mM dATP, dCTP, dGTP, 3 mM dTTP, 2 mM aminoallyl-dUTP [Sigma], 3 μl DTT, and 0.5 μl Super RNAse inhibitor [Ambion]; and 1 μl Superscript III [Invitrogen]) was added and the reaction was incubated 1.5 h at 46°C. Two microliters 5M NaOH and 8 μl 0.5M EDTA was added and incubated 15 min at 65°C. Twenty microliters 1 M HEPES (pH 7.5) was added to neutralize the reaction. cDNA was purified using PCR purification kit (Qiagen). Volume was adjusted to 27 μl and dye coupling buffer (3 μl 1M NaHCO3 at pH 9.3) was added. Dye esters (Cy3 and Cy5, Amersham, Biosciences) were diluted (1:15) in DMSO. The dye (4.5 μl) was added to the cDNA and the reaction was incubated for 1 h at room temperature. Four and one half microliters 4 M hydroxylamine (Sigma) was added and the reaction was incubated 15 min at room temperature. Labeled cDNA was cleaned using the Qiagen PCR purification kit and dried completely. The pellet was diluted to 2 μl poly-A (10 mg/ml, Sigma) and 85 μl of preheated (10 min, 65°C) hybridization buffer (Ambion Slide Hyb Buffer #3) was added. The sample was denaturated for 5 min at 95°C. Slides were prehybridized in 6× SSC/0.5% SDS/1%BSA (45 min, 50°C) and boiled thereafter (3 min) and dried (Spectrafuge mini, Labnet). Sample was applied under the lifter slip (Erie Scientific Company). Hybridization was done in a 50°C water bath overnight in hybridization chambers (Gene Machine). The slides were washed for 10 min in 0.1× SSC/0.1× SDS, twice for 5 min each in 0.1× SDS and 1 min in milliQ water and dried.
For organ comparisons, samples were collected the same way as for the respective cDNA library construction (Supplemental Table 1). Hybridizations were repeated with two biological replicates each, including three technical replicates of which one was dye-swapped. The same amounts of total RNA from different developmental stages were pooled before amplification to start with 2 μg of total RNA. Labeling was done with Cy3 and Cy5 dyes (Amersham) according to the aminoallyl messageAmp RNA amplification kit (Ambion). After the dye coupling, prehybridization, hybridization, and washes were done as described above. Each organ sample was compared to a pooled sample containing the same amount of RNA from each of the organs. Hybridization was done with 4 μg of aRNA.
Scanning and data analysis
Microarrays were scanned using the GSI Lumonics ScanArray 5000 to produce two separate TIFF images. Spot finding and quantification of the spots were done by using QuantArray version 2.0 (Packard Biochip). Spots appearing bad due to poor morphology, high local background, or appearing otherwise unreliable were excluded from further analysis. Spots were quantified using an adaptive method. The background was set manually to zero, and results were visually checked to minimize the amount of false positives. GeneSpring 6 (Silicon Genetics) was used for the normalization and further analysis of the microarray data. Due to the non-linearity of the data, the intensity-dependent Lowess normalization was applied in all samples. Cross gene error model (GeneSpring software) has been used as a basis to calculate t-test p-values for different replicates. The p-value of 0.05 was used as a limit for statistically significant differences in expression. Data were then further filtered according to fold difference in expression. At least twofold difference was used in inflorescence/leaf comparison and fourfold in the organ comparison. To evaluate the quality of the microarray hybridizations, Gene-Spring software was used to calculate standard correlation between both technical and biological replicates. Technical replicates of individual experiments were compared against each other and mean values of the correlation coefficients were calculated. Correlation between the two biological replicates was calculated from the mean of the expression ratios of the corresponding technical replicates. CLUSTALW was applied in the sequence analysis of different clusters of LTPs.
Quantitative PCR
Verification of the results was done with real time reverse transcription PCR. Reverse transcription was done using the TaqMan reverse transcription kit (Applied Biosystems). PCR was done using SYBRgreen PCR master mix (Applied Biosystems). Five hundred nanograms of total RNA were used for reverse transcription and 5 μl of cDNA as a template in PCR reactions. PCR was done in triplicate with 50nM of primers and using 7700 cycling conditions as a default. The raw threshold cycle (Ct) values were normalized against a ubiquitin standard to obtain normalized ΔCt values. The ratio of expression between flower and leaf (F/L) was calculated using the formula 2ΔCt flower / 2ΔCt leaf.
Acknowledgments
We thank the teams from the sequencing laboratory and from the microarray laboratory of the Institute of Biotechnology, University of Helsinki for their excellent technical assistance. Beng Janne Backman is thanked for his help in developing the tools for EST data mining. Dr. Outi Monni from the Biomedicum Biochip Center, University of Helsinki is thanked for the printing of the gerbera microarrays. The software for the data analysis was provided by CSC, the Scientific Computing Ltd., Finland. We also thank Anu Rokkanen for her skillful technical assistance in the Gerbera Laboratory and Paula Junikka for the excellent care of the plants at the greenhouse. We sincerely thank Dr. Mikael Brosché for valuable discussions and all the help during this work. This work was supported by the Academy of Finland (grant104608 for P.E.; Finnish Center of Excellence Programme 2000–2005 for T.H.T.) and by the National Technology Agency of Finland (grant 40089/93 to T.H.T.). R. Laitinen is funded by the Viikki Graduate School in Biosciences.
Footnotes
-
[Supplemental material is available online at www.genome.org. The EST database, including the annotations, can be viewed at http://sputnik.btk.fi. The gerbera EST sequences have been submitted to the EMBL Nucleotide Sequence Database under accession nos. AJ750001–AJ766994. The microarray data have been submitted to www.ebi.ac.uk/arrayexpress/ under accession nos. A-MEXP-82, E-MEXP-206, and E-MEXP-207.]
-
Article and publication are at http://www.genome.org/cgi/doi/10.1101/gr.3043705. Article published online ahead of print in March 2005.
-
↵5 Corresponding author. E-mail paula.elomaa{at}helsinki.fi; fax 358-9-19158727.
-
- Accepted January 4, 2005.
- Received July 23, 2004.
- Cold Spring Harbor Laboratory Press


