
Surveying Saccharomyces Genomes to Identify Functional Elements by Comparative DNA Sequence Analysis
Abstract
Comparative sequence analysis has facilitated the discovery of protein coding genes and important functional sequences within proteins, but has been less useful for identifying functional sequence elements in nonprotein-coding DNA because the relatively rapid rate of change of nonprotein-coding sequences and the relative simplicity of non-coding regulatory sequence elements necessitates the comparison of sequences of relatively closely related species. We tested the use of comparative DNA sequence analysis to aid identification of promoter regulatory elements, nonprotein-coding RNA genes, and small protein-coding genes by surveying random DNA sequences of severalSaccharomyces yeast species, with the goal of learning which species are best suited for comparisons with S. cerevisiae. We also determined the DNA sequence of a few specific promoters and RNA genes of several Saccharomyces species to determine the degree of conservation of known functional elements within the genome. Our results lead us to conclude that comparative DNA sequence analysis will enable identification of functionally conserved elements within the yeast genome, and suggest a path for obtaining this information.
Identifying functional elements in DNA sequence is a significant challenge. It is difficult enough to predict correctly protein-coding genes; an even greater challenge is to identify functional sequences that do not code for protein, such as sequences regulating gene expression, sequences governing chromosome replication, structure and stability, and sequences of nonprotein-coding RNAs. This task is complicated by the diverse nature of these sequence elements. For example, sequences that regulate gene expression are usually short, often independent of orientation, and can reside at varying distances from their target gene. Genes encoding RNAs can be difficult to identify because they contain few hallmarks and because their folded structure, rather than their primary sequence, dictates their function.
Because functional sequences are maintained in evolution, they often can be recognized by their conservation among different organisms (Tagle et al. 1988; Hardison et al. 1997). This approach has most often been used to identify functional sequences in proteins, because they are relatively large and evolve relatively slowly, causing their functional elements to remain conserved in diverse organisms. In a few cases potential nonprotein-coding functional sequence elements have been identified by comparing DNA sequences of relatively diverged species (usually from different genera) (Venkatesh et al. 1997; Gellner and Brenner 1999; Wentworth et al. 1999; Gelfand et al. 2000; Kent and Zahler 2000; McGuire et al. 2000). The comparative approach for finding functional nonprotein-coding sequences will likely be more productive with DNA sequences of relatively closely related organisms. We sought to gain experience with this by comparing the DNA sequences of yeasts of the Saccharomyces genus because (1) the completeSaccharomyces cerevisiae genome sequence is available for comparison (Goffeau et al. 1996); (2) the genomes ofSaccharomyces species are relatively small, with relatively compact noncoding sequences (∼30% of the genome); (3) their phylogeny is well characterized, with many related species at various evolutionary distances; and (4) it is possible to test the functionality of sequences with relatively simple and incisive experiments.
The Saccharomyces genus is composed of three subgroups (Barnett 1992). The sensu stricto species are physiologically similar to S. cerevisiae, are capable of forming stable diploids with each other, and have a very similar karyotype. The sensu lato and petite-negative Saccharomyces species are quite diverged fromS. cerevisiae. They have significantly different physiological characteristics, seldom form diploids with S. cerevisiae, and have a smaller number of chromosomes (Petersen et al. 1999). To identify which Saccharomyces species are optimally diverged from S. cerevisiae for comparative DNA sequence analysis, and to evaluate the number of sequences that must be compared to obtain useful information, we determined the sequence of randomly generated genomic clones of seven Saccharomyces species. In addition, we determined the DNA sequences of the regulatory regions of a few specific genes and of a few genes encoding nonprotein-coding RNAs from several Saccharomyces species to determine the degree of conservation of known functional elements in the genome. Our results suggest that comparative DNA sequence analysis will enable identification of many functional gene regulatory elements and other nonprotein-coding sequences, and suggest a path for obtaining this information.
RESULTS
Sequence Summary of Saccharomyces Species
We obtained sequence from ∼1000 genomic DNA clones from each of four species of the sensu stricto group (Saccharomyces bayanus, Saccharomyces paradoxus, Saccharomyces cariocanus, and Saccharomyces mikatae) (Naumov et al. 2000) and from >2000 clones from each of two species of the sensu lato group (Saccharomyces castellii and Saccharomyces unisporus) and the petite-negative species Saccharomyces kluyveri (Table 1). Over 4.3 Mb of unassembled sequence was obtained, a sample sufficient for genomic exploration of the Saccharomyces genus.
Summary of BLASTN Comparisons ofSaccharomyces Species' DNA Sequences to S. cerevisiae DNA Sequence
Comparisons of the nucleotide sequences (using BLASTN, Table 1) and inferred protein sequences (using BLASTX, Table 2) to S. cerevisiae sequence are instructive for determining the relative genetic distance of the species from S. cerevisiae and for identifying which species are likely to yield the most data in sequence comparisons. Most (94.5%–98.2%) of the sensu stricto sequences align to S. cerevisiae coding or noncoding sequence using BLASTN. As expected, the sequences are most similar to S. cerevisiae DNA sequence in protein-coding genes, but the sequences of S. paradoxus andS. cariocanus are also highly conserved within nonprotein-coding regions. S. mikatae and S. bayanushave lower similarity and yield significantly fewer alignments to nonprotein-coding regions of the genome using the sameBLASTN parameters (Table 1).
Summary of BLASTX Comparisons betweenSaccharomyces Species' Protein Sequences and S. cerevisiae Protein Sequence
The sensu lato and petite-negative species seem to lie a similar evolutionary distance from S. cerevisiae, because the average identities of their protein-coding DNA (Table 1) and predicted proteins (Table 2) to S. cerevisiaesequences are similar for each sensu lato species. These species are more diverged from S. cerevisiae than we expected from ribosomal RNA comparisons. Many presumably orthologous DNA sequences (identified by aligning the protein-coding sequences usingBLASTX) do not align to S. cerevisiae sequence with BLASTN, and many of those that do align are near the lower limits of detection by BLASTN.
Although most of the proteins of the sensu stricto group are >80% identical to their S. cerevisiae homologs, 29 alignments show <50% identity (Fig. 1A). These low similarity alignments may indicate rapidly evolving proteins or genes that duplicated in other Saccharomyces species (but not inS. cerevisiae), allowing one copy to diverge from its S. cerevisiae ortholog. A large number of proteins of the sensu lato species (>30%) are <50% identical to their S. cerevisiaehomologs (Fig. 1B), emphasizing the substantial divergence of these species from S. cerevisiae.
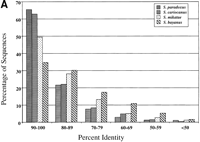
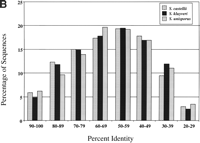
Summary of protein sequence identities between Saccharomycessequences and their S. cerevisiae homologs. (A) Sensu stricto BLASTX comparisons to S. cerevisiae using a PAM40 matrix. (B) Sensu lato and petite-negative comparisons using the BLOSUM62 matrix.
We noted many discrepancies in open reading frame (ORF) boundaries in the different sensu stricto species (data not shown). Some of these are likely caused by sequencing errors (most likely in our sequence, but potentially in the S. cerevisiae sequence); some may possibly be attributable to real DNA sequence differences between these closely related species. ORF length polymorphisms are even more common in the sensu lato alignments, which is not surprising considering the relatively greater divergence of these species from S. cerevisiae.
Species-Specific Sequences
A small percentage of the sequences of sensu stricto species have no significant similarity to any S. cerevisiae sequence at the nucleotide or amino acid levels, regardless of the BLASTparameters that were used. Several of these sequences are predicted to encode proteins similar to those found in other species. For example, we identified a Ty5 transposon protein that is unique to S. paradoxus, and a gene in S. bayanus and S. cariocanus predicted to encode a protein related to an amidase ofS. pombe. Many sensu lato and petite-negative sequences are predicted to encode proteins similar to those in species other thanS. cerevisiae (Table 3). Similar findings have been made in Kluyveromyces lactis(Ozier-Kalogeropoulos et al. 1998) and other hemiascomycete species (Souciet et al. 2000).
Saccharomyces Genes not Present inS. cerevisiae
To verify that these DNA sequences are specific to certainSaccharomyces species, we designed oligonucleotide primers to the amidase-encoding gene identified in S. cariocanus, and to two other unique sequences confined to S. mikatae andS. paradoxus that do not appear to encode protein. The sequences were amplified by PCR from genomic DNA of the corresponding species and produced products of the expected size. (Three other species-specific sequences produced PCR products larger than expected.) The amidase PCR product from S. cariocanushybridized to a specific DNA fragment of S. cariocanus andS. paradoxus DNA in Southern blots (data not shown). TheS. mikatae-specific sequence hybridized to genomic DNA fromS. mikatae, but not to genomic DNA from the other sensu stricto species. Because we determined the DNA sequence of only about 1/32nd of the four sensu stricto species, it is likely that several more Saccharomyces sequences not present in S. cerevisiae remain to be identified.
Identification of Small Protein-Coding Genes
Some of the intergenic regions in the S. cerevisiae genome likely encode small proteins (<100 amino acids) that have not been annotated. Comparisons of S. cerevisiae intergenic sequences to those of the other Saccharomyces species usingTBLASTX revealed many potential protein-coding sequences. Such comparisons of the sensu stricto sequences are not very informative because their relatively high degree of similarity toS. cerevisiae sequence produces many spurious alignments, but the sequences of the sensu lato and petite-negative species are well suited for identification of small ORFs (smORFs, <100 codons) because their significant divergence from S. cerevisiae sequence yields relatively few TBLASTX alignments outside of protein-coding sequences. Most of the high-scoring TBLASTXalignments to S. cerevisiae sequence are extensions or fusions of known ORFs, but we identified 11 alignments of smORFs that potentially encode a protein (TBLASTX P value <1.0e-05; Table 4). Two of the smORFs were predicted previously by searching the S. cerevisiae genome for transcripts that originate from large intergenic regions of the genome (Olivas et al. 1997); two smORFs are similar to small ORFs in other yeast species (Table 4).
Small S. cerevisiae ORFs (smORFs) with Homologs in OtherSaccharomyces species
Yeast Strains Used in this Study
Identifying Functional Non-Protein-Coding Sequences
Our primary goal is to use sequence conservation to identify functional nonprotein-coding sequences. However, much of the similarity of the nonprotein-coding sequences of the sensu stricto species is likely caused simply by an inadequate amount of evolutionary time for the accumulation of sequence changes. Which species are sufficiently diverged so that functional nonprotein-coding sequences are apparent? How many different sequences need to be compared to reveal regions of sequence similarity that are functionally significant? We began to address these questions by searching for nonprotein-coding RNA genes and promoter regulatory sequences in non protein-coding portions of the S. cerevisiae genome.
Identification of Non-Protein-Coding RNAs
Many highly conserved sequences in intergenic regions were identified that are unlikely to encode proteins because no ORF was apparent in the S. cerevisiae genome sequence. In the few cases where we obtained sequences from more than one species that are similar to the same S. cerevisiae sequence, the conserved sequence elements readily stand out from surrounding sequences. Because there are only a few regions of the genome for which we have sequences from multiple species, we determined the DNA sequence of a few genes encoding nonprotein-coding RNAs from many differentSaccharomyces species to compare how quickly they diverge across the genus, and to help us decide which Saccharomycesspecies are best suited for identifying these genes by comparative sequence analyses. We amplified the sequences by PCR using oligonucleotide primers chosen from S. cerevisiae flanking sequences that seemed likely to be conserved. We determined the sequence of SNR39, encoding a C/D box snoRNA required for methylation of the 25s ribosomal subunit (Kiss-Laszlo et al. 1996) andSNR44, encoding an H/ACA box snoRNA involved in pseudouridinylation of ribosomal RNA subunits (Ganot et al. 1997), both of which are located within introns of well-conserved ribosomal protein genes.
All eight SNR39 sequences align well usingCLUSTALW, with 58% of the 93 nucleotides ofSNR39 being conserved among eight Saccharomycesspecies. The C and D boxes as well as the guide sequence are conserved perfectly throughout the genus (Fig. 2). The gene is even readily distinguishable from surrounding intron sequence in most two-way alignments with S. cerevisiaesequence, although it is indistinguishable in an alignment of S. cerevisiae sequence to S. paradoxus (too similar), and is difficult to discern in an alignment to S. exiguus sequence (too diverged).
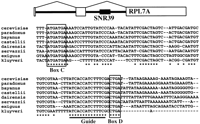
A CLUSTALW alignment of SNR39 sequences (encoding a snoRNA) from eight different Saccharomyces species. Box C and Box D are known functional elements; the “guide” is the sequence complementary to rRNA sequence adjacent to the methylation site. The structure of the RPL7A transcript including the intronic SNR39 gene is shown above the sequence alignment.
The SNR44 gene (encoding an H/ACA snoRNA) sequences also align using CLUSTALW, but are less well conserved thanSNR39 (Fig. 3). The alignment reveals four highly conserved blocks, ranging from 5 to 15 nucleotides in length, which, surprisingly, do not include the ACA sequence (AAA in the sensu stricto species) or the H-box (Fig. 3), known functional elements in this snoRNA
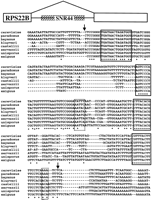
A CLUSTALW alignment of SNR44 sequences encoding an H/ACA box snoRNA. The positions of the start and end of S. cerevisiae SNR44 are marked with arrows. Highly conserved sequences are boxed. The H and ACA boxes are enclosed in dashed lines. The plus symbols in the consensus line indicates that seven of eight nucleotides in the alignment are conserved and were added to highlight conservation of sequence upstream of the H box. The structure of theRPS22B transcript including the intronic SNR44 gene is shown above the sequence alignment.
Identification of Gene Regulatory Sequences
We expect potential gene regulatory sequences to be manifested as short blocks of sequence similarity in intergenic regions of the genome. These are difficult to recognize in the random DNA sequences of the Saccharomyces species for two reasons. On one hand, the sequences of the sensu stricto species are usually so similar toS. cerevisiae sequence that few isolated runs of identical nucleotides are found. In rare cases where we can align DNA sequence of two or more species, the background sequence similarity is reduced and potential regulatory elements begin to stand out (e.g., Fig.4), but these alignments never extend over the entire promoter. On the other hand, the DNA sequences of the sensu lato species are generally too different from S. cerevisiaesequence to align with local alignment algorithms (such asBLASTN or BESTFIT). Some sensu lato sequences can be anchored to their presumed orthologs in S. cerevisiaegene using BLASTX, then extended into the promoter region. Of the 4296 sensu lato sequences that align to S. cerevisiaeproteins with BLASTX, 866 extend >30 nucleotides into the promoter region. We were able to align only 398 of them to theirS. cerevisiae ortholog (using BLASTN, with a word length of five and only 111 of the alignments extend >100 bp into the promoter region. Many potential regulatory elements are apparent in these alignments. For instance, we can clearly see conservation of DNA-binding sites for the Alpha1 and Mcm1 proteins in the MFA2and STE3 promoters of S. castellii (Fig.5A,B). A consensus Hap2 binding site (ACCAATNA; Svetlov and Cooper 1995) is included in one of the three conserved runs of sequence present in the promoter of ATP14(Fig. 5C), a gene that is plausibly regulated by Hap2. Many other alignments contain short runs of conserved sequence that are potential gene regulatory elements.
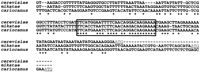
A CLUSTALW alignment of SEC35 promoter sequences of sensu stricto species reveals conserved elements that could function as regulatory elements. The conserved sequences are boxed; the S. cerevisiae ATG start codon and putative start codons for the other species are underlined.
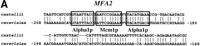
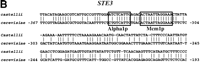
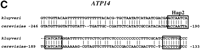
Known functional elements are conserved in BLASTNalignments between S. cerevisiae promoters and orthologous sequences of sensu lato species. (A) An alignment ofMFA2 promoter sequences from S. castellii and S. cerevisiae with known binding sites for Alpha1 and Mcm1 boxed. (B) An alignment of STE3 promoter sequences fromS. castellii and S. cerevisiae with known binding sites for Alpha1 and Mcm1 boxed. (C) An alignment of theATP14 promoter sequences from S. kluyveri and S. cerevisiae showing three conserved runs of sequence, one of which includes a consensus Hap2 (ACCAATNA) binding site. Numbers refer to the position of the S. cerevisiae sequence relative to the ATG start codon.
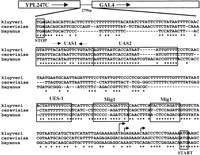
To assess Saccharomyces species more broadly for their suitability for identifying regulatory sequences in gene promoters by comparative DNA sequence analysis, we amplified by PCR and determined the sequences of the promoters of three well-characterized genes from many Saccharomyces species (see Methods for details). Although the sequences of the promoter region between GAL1 andGAL10 of the sensu stricto species align well usingCLUSTALW, the sensu lato species' sequences do not align. We searched for Gal4 and Mig1 protein-binding sites by a simple pattern search [FINDPATTERNS] and, as expected, they are apparent in theGAL1–10 promoter of all 10 species (Fig.6). The spacing of these binding sites is well conserved in the sensu stricto species, with only a few sites missing from some of the species. The spacing and number of Gal4 and Mig1 binding sites are not conserved in the sensu lato species. Of these, only the S. castellii sequence aligned with the S. cerevisiae sequence using local alignment algorithms (BLASTN or BESTFIT).
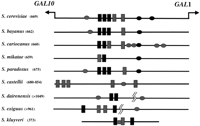
The location of Gal4 and Mig1 regulatory elements in theGAL1–GAL10 promoter sequences from many Saccharomycesspecies. The length of the promoter (where known) is shown in parentheses. Gal4 binding sites are shown as black boxes with gray boxes indicating putative binding sites that are altered by one nucleotide from the consensus site (CGGN11CCG). Potential Mig1 binding sites are shown as ellipses. Black ellipses refer to experimentally verified Mig1 sites (in S. cerevisiae) or Mig1 sites that clearly align to S. cerevisiae sites in pairwise alignments. Gray ellipses refer to putative Mig1 sites (CCCC followed by AT-rich sequence).
We obtained from each species the DNA sequence of at least one of the two nearly identical copies of the divergently transcribed HHTand HHF genes (HHT1–HHF1 andHHT2–HHF2), encoding histones H3 and H4, respectively. In some cases we obtained the sequence of both copies (though they are so diverged from the S. cerevisiae sequence in the sensu lato species that it was usually difficult to distinguish between the two copies using BLASTN alignments). Although conserved blocks of sequence begin to emerge from 3-way CLUSTALW alignments of sequences of the sensu stricto species (data not shown), addition of a sensu lato sequence makes these elements clearly stand out (Fig.7A). Both (TATA) boxes are conserved, as are sequences within and near CCA boxes 1 and 2 that were defined previously as regulatory elements of this promoter (Freeman et al. 1992). One of the conserved sequences (enclosed in dashed lines in Fig.7A) is present only in one of the HHT–HHF copies in each species, so the two pairs of genes may be regulated differently. Other potential CCA boxes (CCA box 3 and 4) that were not recognized previously seem apparent. Using the pattern recognition programAlignAce (Roth et al. 1998), we identified many variations of the CCA box within the histone promoters (60 different motifs in the 13 promoter sequences) some of which were not identified by full-length sequence alignments (Fig. 7B); the logo consensus (Schneider and Stephens 1990) CCA box sequence is shown in Figure 7C. Each copy of the divergent promoter contains three to six of the relaxed CCA box sequence motifs.
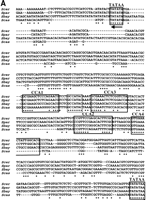
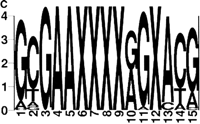
Conserved sequence elements of the HHT2–HHF2 promoter. (A) A CLUSTALW alignment of promoter sequences from S. cerevisiae, S. paradoxus, S. bayanusand S. castellii. Putative TATA boxes are boxed and underlined with arrows, indicating the direction of transcription. A conserved heptamer is enclosed in a dashed box. CCA box 1 and 2 representing elements identified in S. cerevisiae (Freeman et al. 1992) are boxed and numbered. CCA box 3 and 4 are related to the CCA box. Only part of the S. castelli CCA box 4 is captured in this alignment. (B) The location and orientation of putative CCA boxes (identified by AlignAce, Roth et al. 1998) inSaccharomyces promoter sequences. Sequences clearly orthologous to S. cerevisiae Copy 1 or Copy 2 are labeled. Unclear cases are unlabeled (if one copy was obtained from the species) or labeled as a and b (if two copies were obtained). CCA box related elements are shown as black hexagons that depict the direction of the elements. The unfilled, stippled, and vertically dashed boxes depict closely related sequences where the CCA box elements clearly align by pairwise (BESTFIT) or multiple sequence alignments (CLUSTALW). Note the extra CCA box within the S. castellii sequence (striped hexagon). The gray hexagon (in S. bayanus sequence 1) depicts an excellent CCA box that contains a single nucleotide insertion and was not identified byAlignAce, but is apparent in multiple sequence alignments. (C) A “logo” consensus for the CCA box based on 60 related sites identified by AlignAce.
We succeeded in amplifying the GAL4 promoter from only threeSaccharomyces species (presumably because the flanking protein-coding sequences are not well conserved). One of these sequences (from S. paradoxus) is too similar to the S. cerevisiae sequence to be useful, but alignments of the other two sequences (one from the sensu stricto species S. bayanus, the other from the petite-negative species S. kluyveri) seem very informative (Fig. 8). The promoter elements that were previously defined genetically (Griggs and Johnston 1993) clearly stand out as conserved in a CLUSTALW alignment of these sequences with the S. cerevisiae sequence.
A three-way CLUSTALW alignment of GAL4 promoter sequences reveals strong conservation of known regulatory elements. The entire promoter is shown in the alignment, from the stop codon of the upstream gene (YPL247C) to the ATG start codon ofGAL4. Regulatory elements defined by Griggs and Johnston (1993) are boxed and labeled: UAS (upstream activator sequence), UES (upstream essential sequence), and Mig1 binding sites. Transcriptions start sites are depicted as arrows.
DISCUSSION
We have investigated the feasibility of using comparative DNA sequence analysis to identify functional sequences in the genome ofS. cerevisiae, with the goal of identifying regulatory sequences and sequences specifying nonprotein-coding RNAs. We are confident that promoter regulatory sequences, RNA genes, and smORFs could be identified by comparisons of orthologousSaccharomyces sequences.
Analysis of Protein-Coding Genes
Before discussing our analysis of non-protein-coding sequence, a few observations regarding protein-coding genes are worth noting. First, we identified several gene sequences not found in the S. cerevisiae genome (Table 3). These are genes that likely were lost from (or evolved rapidly in) S. cerevisiae, though it is possible they were acquired by the other species after they diverged from S. cerevisiae. Second, we noticed several ORF boundaries that seem to differ among the species. Some of these could be attributable to errors in the S. cerevisiae genome sequence, and some could be real, indicating variations in gene length in the different Saccharomyces species. More interestingly, we identified several small ORFs that likely encode protein, two of which show similarity to proteins found in distantly related organisms (Table4). Based on the number of smORFs identified in the small amount of sequence we analyzed, we estimate that ⋝40 more smORFs will be identified in the S. cerevisiae genome by analysis of the complete genome sequences of a few Saccharomyces species.
Identification of Novel RNA Genes
Non-protein-coding RNA genes can be difficult to recognize in a DNA sequence or to identify experimentally (Eddy 1999), and many surely remain to be discovered. Searches of the yeast genome for potential RNA sequences have identified a few candidates for this type of gene (Olivas et al. 1997; Lowe and Eddy 1999). The comparative sequence approach should greatly speed their identification by revealing potential RNA sequences that can be experimentally evaluated. Indeed, we identified several conserved sequences that may encode functional RNAs and that are good candidates for experimentation to test this hypothesis (data not shown). This approach is validated by the clear conservation of snoRNAs across the Saccharomyces genus (Figs.2 and 3) and by our ability to identify in the random sequences snoRNA-encoding sequences by BLASTN comparison to S. cerevisiae RNA genes (data not shown).
Identification of Regulatory Sequences
Finding gene regulatory sequences is a difficult task because they are often short, independent of orientation, and their position in a promoter can vary greatly. For these reasons, DNA sequences of presumably orthologous promoters often fail to align using tools such as BLASTN or CLUSTALW. Because most comparisons of nonprotein-coding DNA sequence have used relatively diverged species (such as human–mouse or human–puffer fish), we tested the use of closely related yeast species to facilitate identification of promoter elements. As expected, most of the DNA sequences of the closely related sensu stricto Saccharomycesspecies align to cerevisiae sequences, and known promoter regions are conserved in the alignments. Two species (S. cariocanus and S. paradoxus), are too closely related toS. cerevisiae (>80% identity in noncoding regions) to yield much information from the alignments (Table 1), but many S. mikatae and S. bayanus alignments show conservation of short runs of conserved sequence and are nearly as informative as the three-way alignment shown in Figure 8. We believe that many S. cerevisiae regulatory elements could be predicted using sequence alignments of S. cerevisiae sequence to S. mikataeand S. bayanus. Alignment of multiple sequences will be required to add statistical confidence to the predictions.
Less than 2% of the sensu lato and petite-negative species' sequences align to intergenic regions of S. cerevisiae, and many of them are repetitive. By anchoring the alignment to adjacent protein-coding sequence we were able to extend the alignments of 111 sequences (out of 579) ⋝100 bp into the promoter. In this way, ∼20% of the sensu lato promoters can be aligned to their S. cerevisiaeorthologs, and it appears that many regulatory elements are conserved between Saccharomyes species (e.g., Fig. 5). Sensu lato promoters that cannot be aligned accurately to their S. cerevisiae counterparts will require other analysis techniques, such as pattern searching (e.g., CONSENSUS [Hertz et al. 1990], Gibbs sampling [Lawrence et al. 1993], AlignAce[Roth et al. 1998]). Pattern search algorithms were useful for identifying known regulatory sequence elements in the HHT–HHF(Fig. 7) and GAL1–GAL10 (Fig. 6) promoters, where they are conserved through the most diverged Saccharomyces species.
Choosing Saccharomyces Species for Comparative Analysis
Clearly, multiple sequences from several species of various degrees of divergence will be needed to identify conserved sequences. How many sequences will be required for informative sequence comparisons? Which species are optimal for this kind of analysis? The answers depend somewhat on the gene being analyzed, but we believe a few general principles guide the choice of species.
Number of Species for Genome Sequencing
We estimate that at least three sequences of varying degrees of similarity need to be aligned to S. cerevisiae sequence for short blocks of conserved sequence in non-protein-coding DNA to be significant. Consider an alignment of S. cerevisiae noncoding sequence to the two most diverged sensu stricto species (S. mikatae and S. bayanus). The percent identity of their noncoding sequence to S. cerevisiae sequence averages ∼75% for the sequence reads that align with BLASTN (Table 1). Because some reads do not align readily, the overall identity is somewhat less; 70% identity seems like a conservative estimate. The chance of both sequences having the same nucleotide as in the S. cerevisiae sequence at any given position is then ∼0.49 (.7 × .7, or ∼0.5), so the chance of a hexamer aligning perfectly in all three sequences is ∼0.015 (0.56), assuming the sequences are equally diverged from each other, which is approximately true. Thus, a conserved hexamer in this three-way alignment is not very significant, as we expect to find one every 67 base pairs on average. Adding a fourth sequence of similar divergence increases the significance of the alignments only modestly: The chance of a conserved hexamer in a four-way alignment is 0.0016 = (.73)6, or one every 625 base pairs on average. However, if the third sequence added is only 40% identical to the S. cerevisiae sequence (probably a reasonable estimate for the sensu lato non-protein-coding sequences, because few of them align by BLASTN [Table 1]), the expected frequency of an exact hexamer alignment decreases significantly, to .000057, or one approximately every 17,600 nucleotides (1 in ∼5000 nucleotides if the sensu lato sequence is 50% identical to S. cerevisiae).
Indeed, this is close to what we observed in alignments of randomly generated sequence: in many four-way CLUSTALW alignments of sequences (three of them 70% identical to each other; one 40% identical to these), hexamers appeared on average once every 5555 nucleotides; heptamer or longer runs appeared once every 25,000 nucleotides. Because the average intergenic region in S. cerevisiae is ∼600 nucleotides in length, a conserved hexamer is expected to occur by chance about once in every eight promoters on average. We realize that these “back of the envelope” calculations must be interpreted cautiously because it is unlikely that even a probable optimal multiple sequence alignment will correspond precisely to the biological events that generated the sequences being aligned (Thorne and Churchill 1995), but in any case, four-way alignments seem to be the minimum required for efficient recognition of conserved regulatory sequences.
Candidate Species for Comparative Analysis
Which species' sequences will yield the most information? Two considerations need to be balanced in making this decision. The sequences need to be similar enough so that most of them can be aligned with their S. cerevisiae ortholog, a requirement that favors the sensu stricto species, as more of their sequence reads can be aligned to S. cerevisiae sequence (Tables 1, 2). Conversely, if the sequences are too similar the functional elements do not stand out, a consideration that favors the sensu lato species. It seems clear that at least one of each group of species need to be compared.
Two of the sensu stricto species for which we obtained DNA sequence — S. mikatae and S. bayanus — seem like good candidates for large-scale sequence comparisons. S. cariocanus and S. paradoxus seem too similar to S. cerevisiae for this purpose (Tables 1, 2). Another good candidate for comparative sequence analysis is S. kudriavzevii, a recently described species (Naumov et al. 2000), that seems to lie between S. bayanus and S. mikatae in its evolutionary distance from S. cerevisiae (Fischer et al. 2000).
There are few differentiating characteristics for selecting one sensu lato species over another, and sequence information from any of these species will likely be useful. The species that we studied are a similar evolutionary distance from S. cerevisiae. S. unisporus is topologically much closer to S. cerevisiaethan S. kluyveri in most phylogenies, but some show a much longer branch length for S. unisporus (James et al. 1997;Kurtzman and Robert 1991; Oda et al. 1997), consistent with our data. Two species, S. servazzii and S. dairenensis branch closely with species that we studied (S. unisporus and S. castellii, respectively). It is unlikely that any known sensu lato species are significantly closer to S. cerevisiae than the sensu lato species we studied (Petersen et al. 1999). We favor S. kluyveri and S. castellii over S. unisporus for comparative sequence analysis for a few reasons. First, we obtained a few more BLASTX alignments for these species (Table 2), and S. castellii has a significantly greater number ofBLASTN alignments (Table 1) that will help in locating promoter sequences. Second, we identified more snoRNA sequences byBLASTN comparisons from S. kluyveri and S. castellii than from S. unisporus (data not shown). Finally, these two species are estimated to have the smallest genomes within the Saccharomyces genus (Vaughan-Martini et al. 1993;Petersen et al. 1999) thus reducing the amount of sequence that would need to be determined.
METHODS
Sequencing Methods
The DNA sequence of random genomic clones from differentSaccharomyces species was determined by the Washington University Genome Sequencing Center (WUGSC). A brief description of each step follows. Detailed protocols are provided in Mardis (1997), and at http://genome.wustl.edu/gsc/Protocols.
Preparation of Genomic DNA
Derivatives of each yeast species lacking mitochondrial DNA were obtained by plating colonies on YPD agar media containing ethidium bromide (Slonimski et al. 1968) (except in the case of S. kluyveriwhich requires mitochondrial activity for viability). Genomic DNA was extracted from cells (50–100 mL cultures grown overnight to stationary phase in YPD). Cells were harvested and resuspended in 2 cell volumes of cold buffer (50 mM EDTA, 20 mM Tris at pH 8 containing 1 mg/mL ethidium bromide). Glass beads (0.5 mm, acid washed) were added to the cells and the suspension was vortexed for 5 min at 4°C. Sarkosyl (1% final concentration) was added and mixed by inversion. Cell debris was removed by centrifugation (2000 g for 10 min) and cesium chloride was added to the supernatant (1 g/mL). The mixture was centrifuged again (5000 g for 10 min) to remove additional debris. The supernatant was centrifuged at 100,000 G for 6 h in a Beckman TL-100 rotor.
Preparation of Clone Libraries
After quantification, the DNA was sheared by sonication, the ends repaired with mung bean nuclease, and fragments of 1–2 kb were selected by electrophoresis through a 0.8% agarose gel. The DNA fragments were excised and extracted from the gel, ligated to the plasmid (pBC) vector, and introduced by electroporation into competentEscherichia coli DH10B cells. DNA sequence of a representative sample of the resulting plasmid subclones was determined to assess library quality.
DNA Sequencing
Plating and sequencing of plasmid library subclones, as well as sample loading, data collection and processing was done as described byMardis and Wilson, (1997) (description of methods also available athttp://genome.wustl.edu/gsc/Protocols/protocols.shtml.). E. coli colonies carrying plasmid subclones were picked and their plasmid DNA prepared by a simple method that lyses cells with microwaves (Marra et al. 1999). DNA sequencing used “big dye terminator” chemistry in cycle sequencing reactions. Cycle sequencing reactions were ethanol precipitated, resuspended in loading buffer and loaded onto an ABI 3700 capillary sequencing machine. Statistics were monitored constantly, and representative traces were inspected for each run. The data was processed by XGASP (Wendl et al. 1998), a script that directs vector clipping, quality analysis, data transfer, and initial assembly. The traces were processed with PLAN, which performsPHRED basecalling (Ewing and Green 1998; Ewing et al. 1998).
BLAST Sequence Comparisons
Sequence alignments were initially generated using WU-BLAST 2.0 (http://blast.wustl.edu). S. cerevisiae sequence databases were obtained from SGD (http://genome-www.stanford.edu/Saccharomyces). The databases included S. cerevisiae genomic DNA (all_sacchdb.dna),S. cerevisiae protein-coding sequences and genes (orf.trans.fasta and orf_coding.fasta) and a library of intergenic DNA (NotFeature.fasta). This latter database consists of S. cerevisiae DNA from which was removed all genes (encoding both proteins and RNA), LTRs, and transposons. Another library was created by fusing the sequences of a 5′ UTR library (consisting of the 500 bp upstream of the ATG start codon) to the genes sequences in orf_coding.fasta. BLAST output was parsed and processed with ad hoc PERL scripts. Percent identities of BLASTalignments were taken from the highest scoring alignment, to avoid biasing the calculations with low scoring and/or multiple alternative alignments of the same sequence segment.
TBLASTX comparisons used default parameters. Sensu lato and petite-negative sequences were compared to S. cerevisiae“not-feature” DNA sequences (those not known or predicted to encode proteins or functional RNAs) to identify potential protein-coding sequences. High scoring alignments were manually selected from allTBLASTX alignments. S. cerevisiae sequences with interesting alignments were visualized using AceDB(Eeckman and Durbin 1995) to look for potential new ORFs and extensions of known ORFs.
Multiple sequence alignments were created with CLUSTALW(Thompson et al. 1994). Some alignments were edited manually to investigate alternative equal scoring alignments. Local and global sequence alignments were generated using BESTFIT andGAP (GCG Corp.) with default parameters.FINDPATTERNS (GCG Corp.) was used to identify specific motifs within sequences.
Identification of Random Sequences Encoding Proteins Absent from S. cerevisiae
Random genomic sequences were compared with BLASTX to a nonredundant protein database similar to that maintained at NCBI. Because the database contains S. cerevisiae sequences, most of the identified homologs were from S. cerevisiae. In the sensu stricto species only five DNA sequences had significant hits to proteins not found in S. cerevisiae. The situation was more complex for the sensu lato and petite-negative sequences. In addition to finding genes not encoded in S. cerevisiae, we also found many sequences that had more similarity to sequences of species other than S. cerevisiae. Often the proteins with higher similarity are from closely related fungi, but occasionally they are from a distantly related organism, with the S. cerevisiaehomolog showing much weaker similarity.
PCR Amplification and Southern Blotting of Species-Specific Sequences
Sequences were amplified by a standard PCR using the oligonucleotide primers listed below with genomic templates prepared as described by Hoffman and Winston (1987). PCR products were randomly labeled with 32P (Ausubel et al. 1998) and used as probes for Southern blots of HindIII-digested genomic DNA from different species fractionated on a 1% agarose gel and transferred to a charged nylon filter.
S. cariocanus amidase
OM2186 AAACAACACAGCACCAGC
OM2187 TATCCTCAGACGCAGTCG
S. cariocanus unique sequences
OM2196 ATGGTGTGCGTTGTTATC
OM2197 TCAACATGTCTGCATTCG
OM2198 GCTAGTAGTTCCGTGGTG
OM2199 CATCCCGACTCTGTCTTG
S. paradoxus unique sequence
OM2191 GGTACTTGGAGTTCTGTG
OM2192 TGGTGCTTTGGCAACAAG
S. mikatae unique sequence
OM2194 CACGTCCACATTAACCTG
OM2195 GATGTGGACATCATGCTTG
S. bayanus unique sequence
OM2206 CAATAACACGGATGCTCAAC
OM2207 TGTCGGAGGTCACAGGAG
Cloning of Specific Genomic Regions
Yeast genomic DNA was prepared as described by Hoffman and Winston (1987). The sequences of oligonucleotide primers were chosen based on conserved protein-coding regions that flank the sites of interest. Nested primers were used in a second reaction to amplify theGAL1–10 and the GAL4 promoters from some species. Initial PCRs were diluted 1/250 in TE and 1 μL was used as template in the second PCR. PCR products were cloned into a TA cloning vector (pGEMT-EASY [Promega] or pCRII [Invitrogen]). In some cases the PCR products were ligated directly into the vector; in other cases the PCR product was first purified by preparative agarose gel electrophoresis and extracted with QIAGEN gel purification columns. Plasmids were isolated using QIAGEN miniprep columns, checked by restriction digest for inserts of the correct size, and the DNA sequence of the insert was determined on an ABI 377 automated sequencer using universal or T7/SP6 primers and Big-Dye Terminator reactions (ABI). Sequence reads were processed with PHRED (Ewing and Green 1998; Ewing et al. 1998), PHRAP, andCONSED (Gordon et al. 1998). Sequences from S. bayanus and S. paradoxus were obtained from strains NRRL Y-12624 and NRRL Y-17217, respectively.
PCR Primers (asterisks indicate nested primers):
26s rDNA
OM1833 GCATATCAATAAGCGGAGGAAAAG
OM1834 GGTCCGTGTTTCAAGACGG
GAL1–10
OM1975 AGCCGTCAGTTCAAAACATCACC
OM1866* CCATGTATCCAGCACCACC
OM1867 AGTCACAATAATCAATATGTTCACC
GAL4
OM1941 TTCCCACCAATAACATCATTTGACTGGAA
OM1920 TTCCACTTCTGTCAGATGTGCCCTAGTCAGCGG
OM1921* GACTCGAACAAAATCATTATTCTAGATATGAG
OM2208* GATAAACAACATTGCATGGAGGC
S. paradoxus: OM1920-OM1941
S. bayanus: OM1920-OM1941/ OM1920-OM1921
S. kluyveri: OM1920-OM2208
HHT–HHF
OM1837 CACCAGTGGACTTTCTTGCTGTTTG
OM1838 CCACCTTTACCTAGACCTTTACCACCTTTACC
SNR39
OM1959 GAAAAAATCTTGACCCCAGAATCTCAGTTGAAGA
OM1961 CTTGTTAATACCCTTGATTCTGACAACGAA
SNR44
OM1835 TCATCAAGTTTTTACAAGTTATGCAAAAGC
OM1836 CGACAATCTTACCAGATCTGTGGTC
Estimation of Hexamer Frequency in Multiple Sequence Alignments
Random DNA sequences were generated in the computer with Seq-Gen (Rambaut and Grassly 1997). One thousand groups of four sequences (500 nucleotides long) were generated. After the first sequence was generated, two sequences having 70% identity and one having 40% identity to the first sequence were generated. The separate groups were aligned with CLUSTALW and the number of aligned n-mers (n = 1–10) were computed using an ad hoc PERL script.
Acknowledgments
We are indebted to Ed Louis for yeast strains, advice, helpful discussion, and enthusiastic support. We also thank members of the Gish Lab for programming assistance, and Sean Eddy, David States, and Gary Stormo for ongoing advice and for reviewing the manuscript. Linda Riles and Matt Curtis provided technical assistance that was instrumental in the initial phases of the project. This work was supported by funds provided by the James S. McDonnell Foundation. P.F.C. was supported in part by a NHGRI NSRA Fellowship (NIH #IF32HG00218).
The publication costs of this article were defrayed in part by payment of page charges. This article must therefore be hereby marked “advertisement” in accordance with 18 USC section 1734 solely to indicate this fact.
Footnotes
-
Corresponding author.
-
E-MAIL mj{at}genetics.wustl.edu; FAX (314) 362-2985.
-
Article and publication are at www.genome.org/cgi/doi/10.1101/gr.182901.
-
- Received February 1, 2001.
- Accepted April 11, 2001.
- Cold Spring Harbor Laboratory Press


