
First Pass Annotation of Promoters on Human Chromosome 22
Abstract
The publication of the first almost complete sequence of a human chromosome (chromosome 22) is a major milestone in human genomics. Together with the sequence, an excellent annotation of genes was published which certainly will serve as an information resource for numerous future projects. We noted that the annotation did not cover regulatory regions; in particular, no promoter annotation has been provided. Here we present an analysis of the complete published chromosome 22 sequence for promoters. A recent breakthrough in specific in silico prediction of promoter regions enabled us to attempt large-scale prediction of promoter regions on chromosome 22. Scanning of sequence databases revealed only 20 experimentally verified promoters, of which 10 were correctly predicted by our approach. Nearly 40% of our 465 predicted promoter regions are supported by the currently available gene annotation. Promoter finding also provides a biologically meaningful method for “chromosomal scaffolding”, by which long genomic sequences can be divided into segments starting with a gene. As one example, the combination of promoter region prediction with exon/intron structure predictions greatly enhances the specificity of de novo gene finding. The present study demonstrates that it is possible to identify promoters in silico on the chromosomal level with sufficient reliability for experimental planning and indicates that a wealth of information about regulatory regions can be extracted from current large-scale (megabase) sequencing projects. Results are available on-line at http://genomatix.gsf.de/chr22/.
The human genome sequencing project completed the first major milestone with the publication of most of the euchromatic part of human chromosome 22 (Dunham et al. 1999). The consortium identified a total of 545 genes using a careful approach, relying primarily on the mapping of experimental data such as cDNAs and EST clusters. In silico predictions were used to identify genomic data such as CpG islands and repetitive sequence contents.
The promoter of a gene is generally located in its 5′ region and contains vital information about gene expression and regulatory networks, including gene targets of individual transcriptional cascades/signaling pathways. However, cDNAs and EST clusters are often 5′ incomplete and thus do not provide reliable information about promoters. This and the scarcity of experimental data regarding promoters are probably the major reasons why no corresponding annotation for promoters was attempted.
It has not been possible thus far to predict polymerase II promoters in silico with sufficient specificity in the context of large genomic sequences. This problem was highlighted by the publication of the GASP project (Reese et al. 2000). We recently developed a new method calledPromoterInspector (Scherf et al. 2000) to locate genomic regions of about 0.2 kb to 2 kb which contain or overlap with polymerase II promoters. We showed that PromoterInspectoris capable of predicting promoter regions in sequences over 1 Mb in length with high accuracy. Approximately one-half of all predictions were confirmed by gene annotation and 43% of known promoters were detected (Scherf et al. 2000). These results indicate thatPromoterInspector is able to overcome the problem of numerous spurious predictions in long sequences, which hampers all known promoter prediction tools [usually exceeding an error rate of 80% false positive matches (Fickett and Hatzigeorgiou 1997; Scherf et al. 2000]. Therefore, PromoterInspector appears well suited to the analysis of large genomic contigs such as those comprising the sequence of human chromosome 22.
The aim of the present study was to provide high-quality annotation of potential promoters on chromosome 22 specific enough to be useful for subsequent experimental design. PromoterInspector appeared to be an appropriate tool in achieving this goal, because the genomic regions located by PromoterInspector can be expected to contain complete promoters, which are generally less than 1 kb in length, and also because of the high reliability ofPromoterInspector predictions (∼50% correct predictions). Using chromosome 22 as an example, we demonstrate here that the annotation of genomic sequences can now be extended to include identification of promoter regions by in silico methods.
To our knowledge, the specificity of PromoterInspectorhas not been attained in promoter analyses of large genomic sequences to date, and no attempts to predict promoter regions of a whole human chromosome have been reported.
RESULTS
Experimentally Verified Promoters on Human Chromosome 22
To identify experimentally verified promoters on chromosome 22, we performed extensive searches in MEDLINE and GenBank. Because promoters are often referred to by a variety of expressions, we carried out both sequence-based BLAST searches (NCBI) (Altschul et al. 1990) and keyword-oriented text searches. We used genomic fragments containing 2 kb upstream and 500 bp downstream of the annotated gene starts as query sequences for BLAST. GenBank annotation as well as ENTREZ and MEDLINE were searched for entries containing the gene names and/or chromosome 22 annotation in order to include as many promoters as possible. Lastly, we mapped all entries of the Eukaryotic Promoter Database (EPD) (Perier et al. 2000) to the sequence of chromosome 22.
This approach yielded only 20 experimentally verified promoters of known genes on chromosome 22 (Table 1). We compared the location of the 20 promoters with the gene starts annotated by Dunham et al. (1999). In 18 cases, the experimentally verified promoters agreed very well with gene starts. However, two promoters (PLA2G6 and GGT1) were found to be located at a significant distance upstream of the annotated gene starts (12 kb, PLA2G6 and 20 kb, GGT1). We were able to map the 93 bp noncoding first exon of the PLA2G6 mRNA to the genomic sequence of chromosome 22 (ExonMapper, GEMS Launcher package). This exon was not included in the original annotation by Dunham et al. (1999), and the real gene start is located 12 kb upstream of the annotated gene start due to a large first intron. In the case of the GGT1 promoter, no continuous mRNA was available but the promoter sequence matches the chromosome 22 sequence over a stretch of more than 450 bp with just a single mismatch, showing no gaps at all. In summary, experimentally verified data are available for only a very few of the promoters on chromosome 22, even considering that we might have missed a few promoters due to unusual annotation. Therefore, large-scale promoter annotation requires appropriate in silico methods.
Experimentally Verified Promoters on Human Chromosome 22
Sequence Analysis and Promoter Region Predictions
PromoterInspector is an in silico method which is trained to predict the genomic context of polymerase II promoters. Details of the algorithm are as described earlier (Scherf et al. 2000). The application of PromoterInspector to chromosome 22 yielded 465 regions (minimum length 192 bp, maximum 2432 bp, average 555 bp, Table 2).
Length of Predicted Promoter Regions and CpG Islands on Human Chromosome 22
PromoterInspector predicts CpG island- as well as nonCpG island-associated promoter regions. Because 60% of human genes have distinctive CpG islands at their 5′ ends (Cross and Bird 1995) and the chromosome 22 sequence was found to be G + C rich (Dunham et al. 1999), we examined CpG island-associated predictions in more detail.Dunham et al. (1999) reported 553 CpG islands of which 543 were documented on the Web server of the Sanger Centre (http://www.sanger.ac.uk/cgi-bin/cwa/22cwa.pl). The minimum CpG island length is 400 bp, the maximum length is 10,000 bp and the average length is 1074 bp (Table 2).
Comparison of Promoter Region Predictions with Existing Annotation
PromoterInspector, as well as CpG islands predictions, yielded reasonable numbers of matches on chromosome 22 (PromoterInspector: 465 matches, CpG islands: 543 matches). The next step was to compare the results with existing gene annotations in order to determine whether the predictions were reliable.
The quality of the predicted regions was assessed on basis of the 5′ ends of the genes annotated by Dunham et al. (1999). We carried out a correlation analysis of all predicted promoter regions with annotated gene starts with the program packageGenomeInspector (Quandt et al. 1996). The correlation analysis was done with respect to the different quality of gene annotation. We considered three groups of genes which were introduced by Dunham et al. (1999): (1) known genes (genes which are identical to human genes or protein sequences), (2) related genes (genes homologous, or containing a region of similarity, to gene or protein sequences from human or other species), and (3) predicted genes (sequences homologous to ESTs).
Promoter regions were correlated with “known genes” and “related genes” within a region of 2 kb upstream and 0.5 kb downstream of the annotated gene starts (Fig. 1). In the case of the “predicted genes,” the correlation peak was extended up to 6 kb upstream (Fig. 1B). The correlated promoter regions were considered “annotation-supported” promoter regions.
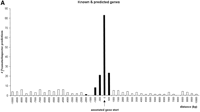
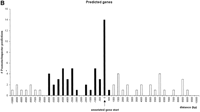
Correlation analysis of PromoterInspector promoter regions with annotated gene starts on chromosome 22 (+ strand shown). They-axis indicates the total number of matches found in relative distance to the annotated gene start. Values on the x-axis with a negative sign mark distances to promoter regions which are located upstream of an annotated gene start, while positive values mark distances to promoter regions which are located downstream from an annotated gene start. The column at distance value 0 marks the number of promoter regions which overlap with an annotated gene start. The range accepted as tolerance is highlighted in black. (A), known and related genes as defined by Dunham et al. (1999). (B), predicted genes as defined by Dunham et al. (1999).
Table 3 summarizes the results ofPromoterInspector predictions and CpG islands. The portion of regions correlated with gene is approximately the same forPromoterInspector predictions (38.7%) and CpG islands (39.4%). The numbers of the annotation-supported promoter regions and CpG islands might still be on the cautious side, especially in the case of EST-based gene annotation, where missing 5′ sequences can easily exceed 10 kb. In order to calculate the percentage of annotation-supported predictions, we set the total number of predictions obtained with each method to 100%. Dunham et al. (1999)identified a group of 134 “pseudo genes;” that is, sequences homologous to a known gene or protein sequence but with a disrupted open reading frame. Given a threshold of 2 kb, only six promoter regions predicted by PromoterInspector were correlated with a gene start in this group.
Correlation of Predicted Promoter Regions and CpG Islands with Gene Annotation on Human Chromosome 22
Because PromoterInspector predicts CpG island- as well as nonCpG island-associated promoters, we tried to improve the CpG island predictions by a filter approach: We considered only those CpG islands which overlapped with a PromoterInspector prediction. The filter approach resulted in 358 CpG islands, and 47.5% of them are correlated with an annotated gene start, as summarized in Table4. In light of these results, the question arose as to whether this improvement could also be reached by filtering CpG islands with other in silico promoter prediction methods. We applied Promoter 2.0 (Knudsen 1999) and NNPP 2.1 (M. Reese, in prep.) and considered only those CpG islands where a promoter was predicted. Table 5summarizes the results. NNPP 2.1 reduced the number of CpG islands without an improvement of predictions. Promoter 2.0 predicted a promoter in only 164 CpG islands, of which 52.2% are correlated with a gene start.
Correlation of CpG Islands Filtered by Predicted Promoter Regions with Gene Annotation on Human Chromosome 22
Correlation of CpG Islands Filtered by Promoter Prediction tools NNPP 2.1 and Promoter 2.0 with Gene Annotation on Human Chromosome 22
Finally, we considered PromoterInspector predictions which are not correlated with CpG islands. As can be seen in Table 1, 20% of the PromoterInspector regions which are correlated with an experimentally verified promoter are nonCpG island predictions. The correlation of nonCpG island PromoterInspector predictions with gene annotations is summarized in Table6.
Correlation of Predicted nonCpG-island Promoter Regions with Gene Annotation on Human Chromosome 22
Gene Prediction Combined with Promoter Prediction
Dunham et al. (1999) applied GenScan (Burge and Karlin 1997), a program for identification of exon/intron structures, to predict genes ab initio. A total of 817 GenScanpredictions were obtained. Although 94% of the annotated genes were at least partially detected by GenScan, all exons were predicted correctly for only 20% of annotated genes. Because of these results, Dunham et al. (1999) stated that “… ab initio gene prediction cannot be used directly to annotate genes in human sequences.”
We examined whether a combination of GenScan andPromoterInspector might improve the ab initio gene prediction. As a first step, we determined the set of composite predictions (i.e., GenScan gene predictions with a 5′ end within or at most 100 bp downstream from aPromoterInspector promoter region). A total of 92GenScan/PromoterInspector predictions fulfilled this requirement. Again we used the gene annotations ofDunham et al. (1999) to estimate the reliability of these predictions.
We found 11 composite predictions where the GenScanprediction did not overlap with an annotated gene, nor was the respective promoter region annotation-supported. Of the remaining 81 composite predictions, 49 (60.4%) had an annotation-supported promoter region and the respective GenScan predicted gene overlapped with the annotated gene. In 32 cases, the promoter regions were not annotation-supported but the respective GenScanprediction overlapped partially with an annotated gene.
From these results we concluded that composite predictions have a high chance (>50%) to correlate with true promoters. In addition, promoter regions appear to be useful markers for delineating the 5′ boundary of subsequences to be analyzed by GenScan. We could verify this for an example, the SLCRA1 gene (Heisterkamp et al. 1995), which was originally not correctly predicted byGenScan. Using the annotation-supported promoter region predicted by PromoterInspector as a 5′ boundary,GenScan correctly recognized all exons of theSLCRA1 gene.
In summary, our results suggest that the 11 additional composite predictions are more likely candidates for real genes than are isolatedGenScan predictions, because GenScan andPromoterInspector independently identify different sequence features. Composite gene predictions might thus be useful as an in silico extension of the chromosome 22 annotation.
DISCUSSION
Promoters contain vital information about gene expression and regulatory networks, including gene targets of individual cascades/signaling pathways. To date, <5% of the promoters in chromosome 22 are known from experimental analysis.
We have shown that in silico promoter annotation of large-scale chromosomal sequences is feasible with a quality that is suitable for experimental design. Every second to third prediction ofPromoterInspector and every second prediction of thePromoterInspector-filtered CpG island predictions can be shown to be correct. Although the annotation derived by our predictions is not complete (about every third annotated gene was correlated with a predicted promoter region), it is, to our knowledge, the first successful large-scale prediction of promoter regions.
As can be seen in Table 3, PromoterInspector and CpG islands led to comparable numbers in gene start correlations. However, a significant difference between these two approaches is that the length of the PromoterInspector regions is, on average, one-half the size of the minimum length of CpG islands. Therefore,PromoterInspector predictions pinpoint gene starts with much more precision. In addition, the results in Tables 1, 4, and 6show that PromoterInspector predicts CpG island- as well as nonCpG island-associated promoters. Our results show a bias ofPromoterInspector predictions towards CpG islands. One reason for this is that ∼60% of the promoter sequences which were used to train the PromoterInspector contained CpG islands. Since the training procedure focuses on the most common patterns in the training set (Scherf et al. 2000), it is clear that the prediction is biased towards C + G-rich patterns. However, our results show that the PromoterInspector approach is (to our knowledge) the only one able to predict promoter regions on the genome level with such a small sequence coverage (i.e., precision). To underline this statement, we compared PromoterInspector with the promoter prediction tools NNPP 2.1 (M. Reese, in prep.),TSSG (Solovyev and Salamov 1997), TSSW(Solovyev and Salamov 1997) and Promoter 2.0 (Knudsen 1999). These approaches focus on the detection of promoter elements like TATA and CAAT boxes rather than promoter regions. Since it is not possible to analyze whole chromosomes with these tools, we randomly extracted and analyzed 10 nonoverlapping sequences with a length of 50,000 bp from chromosome 22. From the obtained results we would expect 11,890 (TSSW), 14,963 (TSSW), 50,233 (Promoter 2.0) and 87,641 (NNPP 2.1) promoter predictions on the chromosome 22 sequence. Assuming that all promoters of the 545 annotated genes of chromosome 22 are included in these predictions, then only every 20th to 140th prediction is expected to be correct. This is certainly not very useful for subsequent experimental design.
Annotated gene starts are not always useful for the identification of promoters because gene annotation might be 5′ incomplete, as suggested by Dunham et al. (1999). We found two examples in which experimentally mapped promoters were located more than 10 kb upstream of annotated gene starts, demonstrating that our methods were able to identify promoter-containing regions with high reliability. The approach of predicting promoter regions independent of gene annotations also provides a new way toward mapping of short first exons that are most frequently missed by both cDNA mapping and gene prediction (Dunham et al. 1999). A prediction upstream of the known gene sequence is very likely to represent the correct promoter and should also be a useful addition for annotated genes.
Reliable promoter prediction can also be used in a more general way to provide a biologically meaningful “chromosomal scaffold” for a variety of further analyses. For example, gene prediction tools such asGenScan perform much better when they are used on segments containing only one gene or at least starting with a gene. Therefore, the combination of promoter region prediction with gene prediction tools like GenScan is a promising way to enhance the specificity of de novo gene prediction. Our data already show a dramatic improvement in the amount of verified gene predictions obtained by simply combining the results of independent gene predictions with promoter predictions.
The next milestone in large-scale promoter analysis will be an in-depth in silico analysis of functional structures of promoters. Promoter function is defined by the specific arrangement of transcription factor binding sites. Promoters often contain subregions called transcriptional modules that are responsible for a specific transcriptional response of a promoter or a promoter group (Kel et al. 1999; Klingenhoff et al. 1999; Werner 1999). We previously showed that specific promoter modeling can yield functional insights into promoter organization in several cases (Frech et al. 1996, 1997, 1998), using a library of currently more than 100 computer models of transcriptional modules (GEMS Launcher). The module analysis will serve as the information base for ongoing research.
METHODS
Promoter Region Prediction
Promoter regions were predicted by PromoterInspector(Scherf et al. 2000). PromoterInspector predicts the genomic context of eukaryotic polymerase II promoter regions based on equivalence classes of IUPAC words. PromoterInspector is available on-line athttp://genomatix.gsf.de/cgi-bin/PromoterInspector/PromoterInspector.pl.
Correlation Analysis
Correlation analysis was realized with theGenomeInspector software package (Quandt et al. 1996).GenomeInspector detects distance correlations between sequence elements on megabases of nucleotide sequences. The method is available on-line at http://www.gsf.de/biodv/software.html.
Exon Mapping
Exon mapping was achieved with the ExonMapper tool, which is an integral part of the GEMS Launcher software package (Genomatix Software GmbH; http://genomatix.gsf.de).
Promoter Mapping
We used the program FASTA (Pearson and Lipman 1988) with default parameters and the multiple alignment programDiAlign (Genomatix Software GmbH;http://genomatix.gsf.de/cgi-bin/dialign/dialign.pl) (Morgenstern et al. 1996) to find experimentally verified promoter sequences on the sequence of chromosome 22.
Gene Prediction
Gene prediction was carried out with the GenScanprogram (Burge and Karlin 1997) with default parameters. The method is available on-lineat http://CCR-081.mit.edu/GENSCAN.html.
Promoter Prediction
Promoter prediction was carried out with NNPP 2.1(M. Reese, in prep.) TSSG (Solovyev and Salamov 1997),TSSW (Solovyev and Salamov 1997) and Promoter 2.0 (Knudsen 1999). All methods are available on-line as follows: NNPP 2.1,http://www.fruitfly.org/seq_tools/promoter.html; TSSG andTSSW, http://genomic.sanger.ac.uk/gf/gf.shtml;Promoter 2.0, http://www.cbs.dtu.dk/services/promoter.
Acknowledgments
We thank Rudi Balling for critical reading of the manuscript. The help of Christian Mirschberger, Ina Stein and Elida Schneltzer is gratefully acknowledged. This work was partially supported by the BMFT Verbundprojekt FANGREB 514–4003–0311641 and DFG WE 2370/1–1.
The publication costs of this article were defrayed in part by payment of page charges. This article must therefore be hereby marked “advertisement” in accordance with 18 USC section 1734 solely to indicate this fact.
Footnotes
-
↵4 Corresponding author.
-
E-MAIL scherf{at}gsf.de; FAX 49 89–5490 8399.
-
Article and publication are at www.genome.org/cgi/doi/10.1101/gr.154601.
-
- Received July 6, 2000.
- Accepted December 29, 2000.
- Cold Spring Harbor Laboratory Press


