
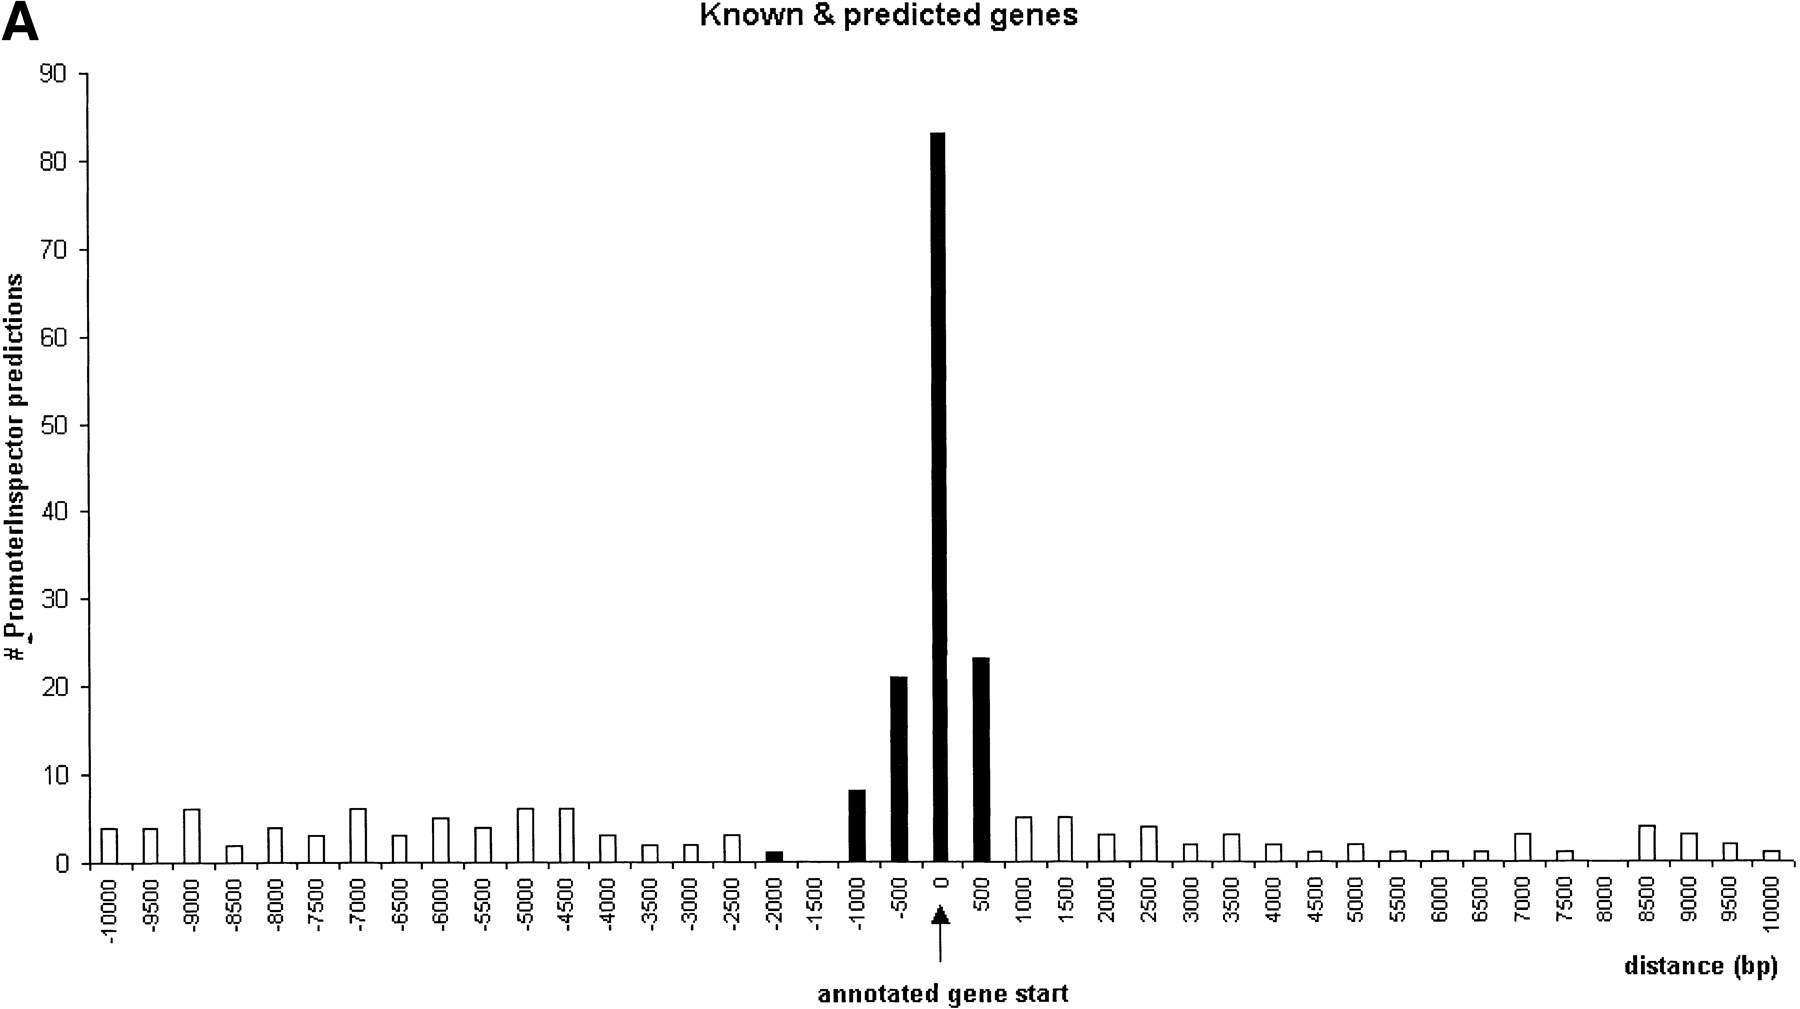
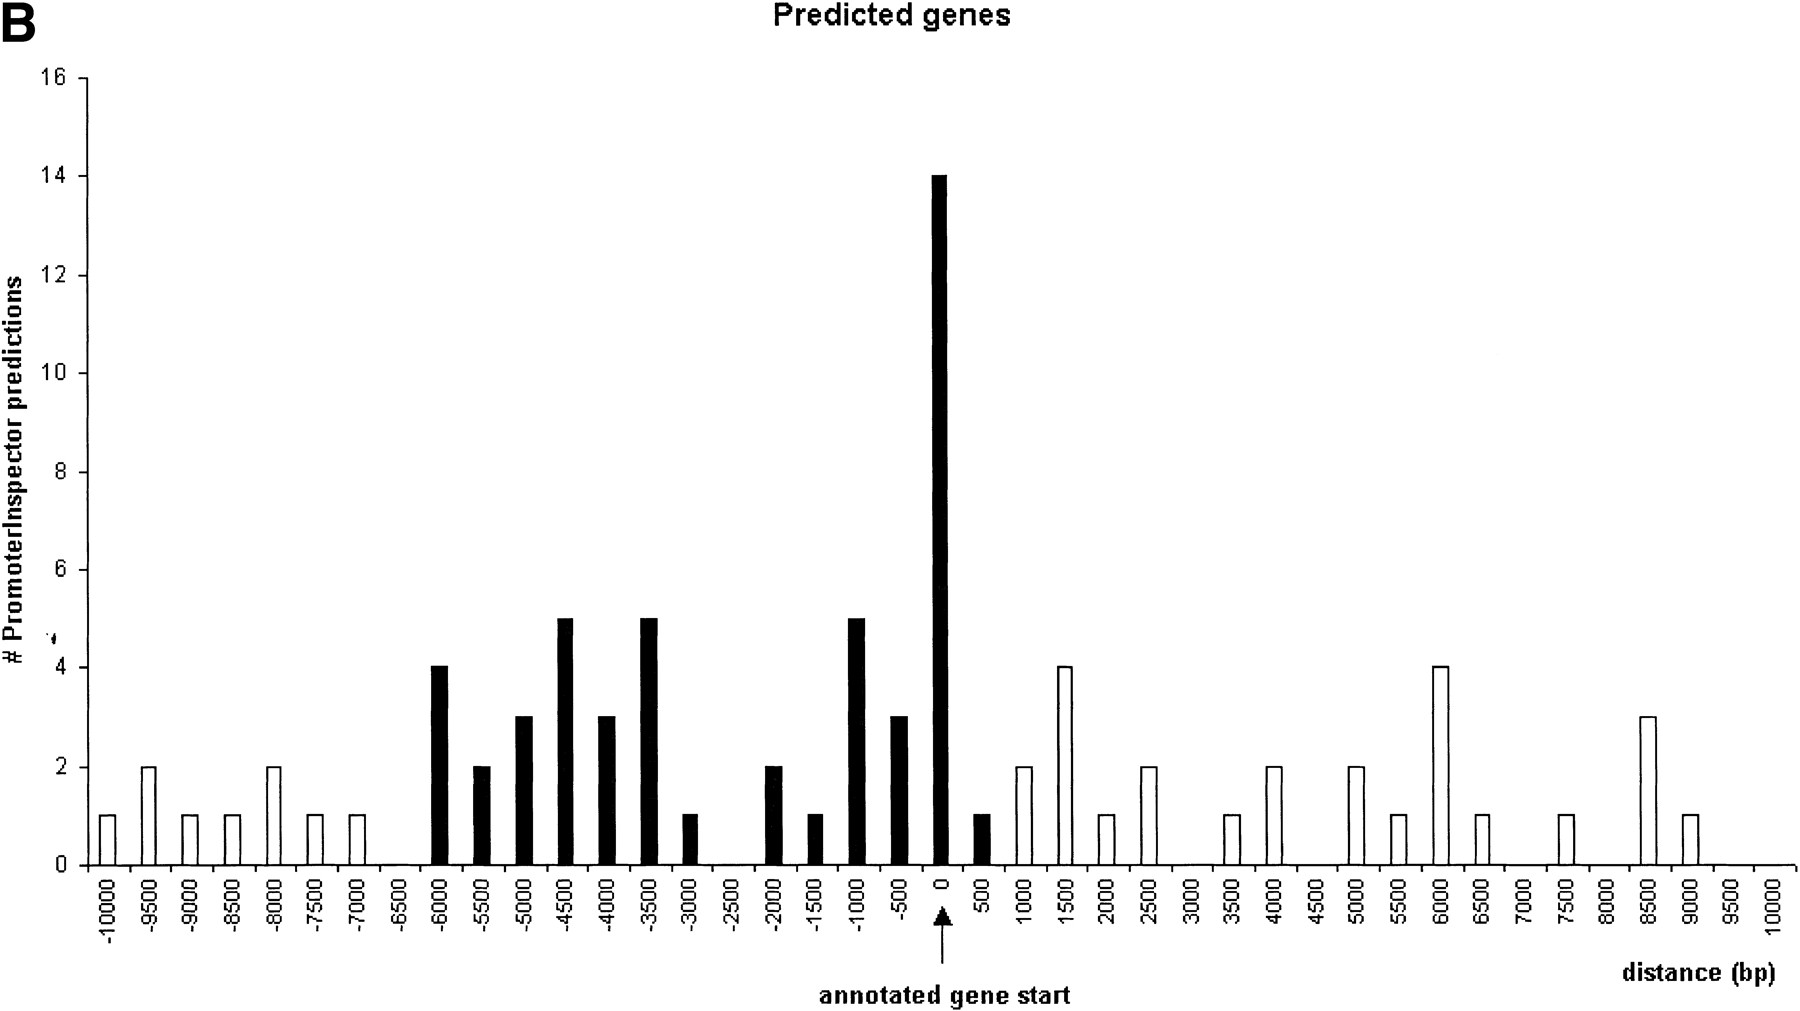
Correlation analysis of PromoterInspector promoter regions with annotated gene starts on chromosome 22 (+ strand shown). They-axis indicates the total number of matches found in relative distance to the annotated gene start. Values on the x-axis with a negative sign mark distances to promoter regions which are located upstream of an annotated gene start, while positive values mark distances to promoter regions which are located downstream from an annotated gene start. The column at distance value 0 marks the number of promoter regions which overlap with an annotated gene start. The range accepted as tolerance is highlighted in black. (A), known and related genes as defined by Dunham et al. (1999). (B), predicted genes as defined by Dunham et al. (1999).


