
BodyMap: A Collection of 3′ ESTs for Analysis of Human Gene Expression Information
- Shoko Kawamoto1,
- Junji Yoshii2,
- Katsuya Mizuno2,
- Kouichi Ito1,
- Yasuhide Miyamoto1,
- Tadashi Ohnishi1,
- Ryo Matoba1,
- Naohiro Hori1,
- Yuhiko Matsumoto1,
- Toshiyuki Okumura1,
- Yuko Nakao1,
- Hisae Yoshii1,
- Junko Arimoto1,
- Hiroko Ohashi1,
- Hiroko Nakanishi1,
- Ikko Ohno1,
- Jun Hashimoto1,
- Kota Shimizu1,
- Kazuhisa Maeda1,
- Hiroshi Kuriyama1,
- Koji Nishida1,
- Akiyo Shimizu-Matsumoto1,
- Wakako Adachi1,
- Reiko Ito1,
- Satoshi Kawasaki1,
- K.S. Chae1,
- Katsuji Murakawa1,
- Masahiro Yokoyama1,
- Atsushi Fukushima1,
- Teruyoshi Hishiki1,
- Akihiko Nakaya3,
- Jun Sese3,
- Norikazu Monma3,
- Hitoshi Nikaido3,
- Shinichi Morishita3,
- Kenichi Matsubara4, and
- Kousaku Okubo5
- 1Institute for Molecular and Cellular Biology, Osaka University, Osaka 565–0871, Japan; 2Hitachi Software Engineering Co., Ltd., Yokohama 231–0015, Japan; 3Department of Genome Knowledge Discovery System, Institute of Medical Science, University of Tokyo, Tokyo 108–8639, Japan; 4Internal Institute for Advanced Study, Kyoto 619–0225, Japan
Abstract
BodyMap is a collection of site-directed 3′ expressed sequence tags (ESTs) (gene signatures, GSs) that contains the transcript compositions of various human tissues and was the first systematic effort to acquire gene expression data. For the construction of BodyMap, cDNA libraries were made, preserving abundance information and histologic resolutions of tissue mRNAs. By sequencing 164,000 randomly selected clones, 88,587 GSs that represent chromosomally coded transcripts have been collected from 51 human organs and tissues. They were clustered into 18,722 independent 3′ termini from transcripts, and more than 3000 of these were not found among ESTs assembled in UniGene (Build 75). Assessment of the prevalence of polyadenylation signals and comparison with GenBank cDNAs indicated that there was no significant contamination by internally primed cDNAs or genomic fragments but that there was a relatively high incidence (12%) of alternative polyadenylation sites. We evaluated the sensitivity and resolution of expression information in BodyMap by in silico Northern hybridization and selection of tissue-specific gene probes. BodyMap is a unique resource for estimation of the absolute abundance of transcripts and selection of gene probes for efficient hybridization-based gene expression profiling. [BodyMap data are available at http://bodymap.ims.u-tokyo.ac.jp.]
In the early phase of its development, the expressed sequence tag (EST) collection (Adams et al. 1993, 1995) primarily served as a catalog to be screened for clones of interest by sequence homology. In the next phase, gene coverage was pursued (Aaronson et al. 1996; Williamson 1999) by using normalized libraries and/or highly complex sources (Soares et al. 1994; Hillier et al. 1996) to use the entries as markers to create a transcript map of the human genome, after clustering redundantly accumulated ESTs into gene units (Schuler et al. 1996). As genome sequencing efforts progress, ESTs have been used for exon identification (Dunham et al. 1999; Hattori et al. 2000), and they are being mapped and organized in the framework of genome sequence at a resolution of single nucleotides. Progress in the integration of ESTs into the genomic sequence will make EST data more of an expression of gene records rather than merely a pool of nucleotide sequences. Reflecting this trend, the major EST collection projects have shifted emphasis from efficiency of identifying novel sequences to meaningful source selection, such as coverage of a majority of cancer types (Strausberg et al. 2000).
BodyMap is a collection of site-directed 3′ ESTs (gene signatures, GSs) designed as an anatomical database of human gene expression in which sequences are used as identifiers (Okubo et al. 1992). Construction of BodyMap began in 1991 (Okubo et al. 1991) and representative human tissues and organs have been incorporated. During the collection of GSs, nonstructural information about the mRNA, including transcript abundance and anatomical distribution, was preserved. The libraries were constructed from well-characterized sources by using methods that minimize the differences in cloning efficiencies among transcripts, and libraries were never amplified before sequencing (Okubo et al. 1991). Accordingly, BodyMap has characteristics distinct from those of other public EST data sets, which were generated as sequence collections at the expense of expression information (Bonaldo et al. 1996). BodyMap has been used in the isolation and characterization of tissue-specific transcripts (Nishida et al 1996; Ohno et al. 1996; Maeda et al. 1997;Shimizu-Matsumoto et al. 1997) and in disease gene identification (Irvine et al. 1997; Nishida et al. 1997). Here we describe the structure and features of 88,587 GSs from human tissues collected in BodyMap.
RESULTS
Sources and Library Construction
The numbers of informative 3′ site-directed ESTs representing chromosomally coded genes are summarized in Table1. We refer to these 3′ ESTs, covering restricted 3′ ends in the sense direction, as gene signatures (GSs) (Okubo et al. 1992). Sources were selected to cover the most representative tissues and cell types. Emphasis was placed on pure connective tissues and epithelial cells, which are underrepresented in dbEST. In every case, tissue preparation was performed carefully, sometimes by microscopy, to minimize contamination by other cell types. For example, human epithelial cells were prepared by careful isolation of a monolayer or layers of cells free from visible contamination by connective tissues and blood cells (Ohnishi et al. 1999). As a result, for example, the sequence of the immunoglobulin λ chain transcript, which was found in 1% (11/870) of clones from colonic mucosa having a thin lining of loose connective tissue (lamina propria), was not identified in 20,440 clones from purified epithelium. Because of the elaborate manipulation steps, libraries were sometimes constructed by direct priming of less than a microgram of total RNA. Nevertheless, contamination by ribosomal RNA was very low (0.26%), probably because of the high specificity of first-strand synthesis with a low concentration vector primer.
The Most Abundant Transcripts in Human Tissues
Validation of Collected GSs
Collected GS sequences were evaluated if they represented true mRNA termini. Of 3928 independent GS sequences that matched GenBank entries, 3470 (88%) represented the most 3′ MboI fragments of the deposited cDNA sequences. The rest represented alternatively polyadenylated mRNAs or internally primed artifacts that cannot be discriminated by sequence inspection of individual cases. Thus, the presence of the poly(A) addition signals upstream of the addition site was used for the validation as mass data. Canonical signal (AATAAA) and sequences with single-base substitutions were examined 10 bp to 50 bp from the poly(A) tail in 4431 independent GS sequences (Fig.1A).1 In 93% of GS sequences, AATAAA or a single base variant was found. The prevalence of AATAAA and single base variants was quite similar to that observed in 1123 GenBank human cDNAs with clear annotations of poly(A) sites. In the case of 3′ ESTs deposited in dbEST, the proportions of signals differed greatly between those starting with a stretch of Ts and those without them (Fig. 1A). The former has very similar signal occurrence, but in the latter the proportion of AATAAA is greatly reduced, indicating that the short region following a poly(T) stretch was trimmed before data submission as reported (Hillier et al. 1996). The 458 BodyMap GS that matched internal regions of GenBank mRNAs had similar frequencies of hexanucleotide signals, suggesting that the majority of them are also polyadenylated in vivo. Because we counted not only the well-known single-base variants, such as ATTAAA, but also all of the possible single-base substitutions, the fraction of each of these variants was compared for cDNA ends having only one candidate signal (Fig. 1B). The proportion was consistent across GenBank primate sequences, BodyMap, and untrimmed 3′ ESTs. Trimmed 3′ ESTs served as nonterminal controls. This agreement between the three sets of data suggests that some of the uncommon hexanucleotide variants, such as BATAAA and AATABA (B = T, G, C), are functional and that most of the cDNA sequences with only single-base variants in either set of data represent true 3′ termini of transcripts.
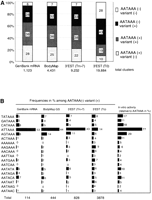
Distribution of AATAAA and single-base variants in 3′ ends of ESTs. (A) The hexanucleotide signals from the 3′ ends of four sets of cDNA sequences. The regions 10–50 bp from the polyadenylation sites were examined for the presence of AATAAA or its single-base variants. The 3′ ESTs from dbEST were divided into those starting with more than seven Ts (Tn > 7) and those without a T in the first position (T0). (B) The prevalence of each single-base variant in the cDNA termini with only one variant signal and no AATAAA within the 10–50-bp region from the poly(A) tail in each of four data sets is shown. The frequencies (%) of all 18 possible variants in each data set are shown beside bars. In vitro polyadenylation activities for each variant measured in the context of the SV40 polyadenylation signal are reproduced from the literature (Wickens et al. 1984; Sheets et al. 1990)
Constitution of GS Population
Without exception, the most recurrent GSs in differentiated cells or in adult tissues were from nonhousekeeping genes (Table 1). Some were unique to each tissue, and some were shared among cells of the same lineage. The fraction of the most abundant GS varied more than tenfold across tissues or cell types. There were six tissues in which more than 10% of the total ESTs were attributable to a single GS cluster (Fig.2). They were secretory epithelia or muscular tissues. In the remaining tissues, the content varied by a small percent (mean, 2.5%; SD, 1.8%).
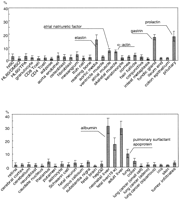
The relative contents of the most abundant transcripts in 51 human tissues or cell types as measured by gene signature collection. The error range indicates the P value of 0.1 calculated for each observed occurrence. The identities of some transcripts are given. For the identities of other transcripts, see Table 1.
The characteristics of the GS population for each source group—nervous tissues, connective tissues, and epithelial tissues—are illustrated in the accumulated frequency curve (Fig. 3) in which the cumulative sums of occurrences were plotted in descending order of GS occurrence. The epithelial and connective tissues have very similar curves, whereas that of the nervous system is clearly shifted downward. The curve for neural tissues did not overlap with the others at a credit level of 0.85 in the top 486 genes. As seen in Figure 2, 50% of the mass is accounted for by ∼500 genes in connective and epithelial tissues but by >900 genes in nervous tissue.
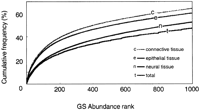
Cumulative frequencies of gene signature (GS) sequences. The cumulative sums calculated in descending order of GS frequencies are plotted as a percentage of total tag occurrence. Tag occurrences in each of three major tissue categories were plotted separately.
Overlapping with dbEST
To further characterize BodyMap data, we compared them with dbEST entries in UniGene (Build 75) that were clustered into 72,831 physical and annotational clusters. Of 18,722 GS clusters composed of 89,831 GS tags in BodyMap, 3,382 GS clusters did not match ESTs listed.
The GS in overlapping fraction have an average redundancy of 5.6 in BodyMap, whereas it was 1.3 in the GS cluster unique to BodyMap. GS unique to BodyMap were distributed at frequencies of 1%–5% in every library (mean, 4.0%; SD, 2.2%) and had hexanucleotide signal occurrences similar to the rest (data not shown). Nervous system tissues had a slightly greater content of unique GS (mean, 5.4%; SD, 2.1%) than was found in other tissues (mean, 3.8%; SD, 1.8%). These values equaled or exceeded 10% in only two libraries: full thickness of skin (10%) and fetal neuron (11%).
In Silico RNA Experiments
The primary goal for the construction of BodyMap was to create a genes × tissues matrix of transcription level that could be used for in silico experiments such as Northern hybridization and subtraction cloning. Although the depth of the clone collection limits the sensitivity and specificity of experiments, for abundant clones these primary objectives have been achieved. The sensitivity of the present matrix was assessed by probing the data with several genes known to have moderate expression levels and known tissue specificities. As shown in Table 2, the distributions of cytoskeletal intermediate filaments and collagens suggest that this clear segregation is applicable also to anonymous genes with similar expression levels. Such pure segregation patterns are not seen in libraries constructed from complex starting materials.
Distribution of Transcripts for Cytoskeletal Filaments and Collagens across Libraries
Another example of an in silico experiment is selection of genes with given patterns of expression. For example, genes differentially expressed in myeloid cells, based on the criteria that frequency variation between myeloid cells and nonmyeloid cells was highly significant (P < .005), are shown in Table3. By increasing the P value to 1%, 112 more genes were selected (data not shown).
Known Genes Selected as Uniquely Expressed in Myeloid Cells
DISCUSSION
The wide coverage of human genes in dbEST permits parallel gene expression monitoring based on prior knowledge of gene sequence (Lockhart et al. 1996; Iyer et al. 1999). However, from a practical perspective, researchers must select a set of genes suitable for target tissues to make testing efficient (Loftus et al. 1999). The well-preserved abundance information and high anatomical resolution make BodyMap a preferable source for probe selection (http://bodymap.ims.u-tokyo.ac.jp). Another unique feature of BodyMap is the absolute abundance values for transcripts for various tissues. Such information is also found in shorter tag collection, SAGE (Velculescu et al. 1995; Welle et al. 1999), and the tissue-coverage complement to each other. The abundance data covering various tissues are complementary to relative gene expression comparison (DeRisi 1996;Schena et al. 1996; Kawamoto et al. 1999) for evaluating the functions of uncharacterized genes.
Site-directed EST sequences are indispensable for identification of gene ends within genomic sequences because even the most sophisticated computer programs tend to overpredict the presence of exons (Dunham et al. 1999). The overlap of dbESTs with BodyMap indicates that there are still more transcripts to be identified in brain and other tissues. The higher complexity of transcripts in brain, as shown by the accumulated frequency curve, supports this idea. Possible overprediction of genes by using 3′ ESTs is due to cloning artifacts and alternative polyadenylation. Validation of 3′ ESTs by using hexanucleotide signals suggested that such artifacts were negligible in our data set. The 3′ ends without the AATAAA were observed at high incidences not only in BodyMap (39%), but also in human cDNAs in GenBank (37%) and qualified 3′ ESTs from dbEST (40%). In those 3′ ends, several uncommon single-base variants, such BATAAA and AATABA (B = T, G, C), plausibly responsible for poly(A) formation in these 3′ ends, were found at very similar rates. After this paper was submitted, Beaudoing et al. (2000) published similar results from an analysis of 4344 human 3′ untranslated regions (UTRs) and 3′ ESTs overlapping with them. The proportion of 3′ ends without AATAAA was 41.8% in their analysis, and uncommon single-base variants were found at significant frequencies among them. In BodyMap, upstream alternative polyadenylation was found in 12% of GenBank mRNA entries. Assuming the same incidence of downstream alternatives, our estimate of alternative polyadenylation is 24%, close to the reported estimates by EST clustering (16%) (Gautheret et al.) and recent 3′ UTR analysis (28.6%). Although generation of multiple 3′ ESTs from one gene may affect transcript counting by EST clustering, assigning them to genomic sequences will easily resolve this problem as long as the ESTs are not far apart.
In summary, our site-directed 3′ ESTs can serve as a resource for selection of probes for sequence-based expression profiling methods and can provide absolute levels of gene expression that are important in considering gene function. Our collection covers various rare tissues and provides information on their mRNA populations. To allow full use of BodyMap for in silico mRNA experiments, the representation frequency matrix of gene × sources and all representative sequences have been made available through our ftp site (http://bodymap.ims.u-tokyo.ac.jp/datasets/index.html).
METHODS
Library Construction
Of 51 human libraries listed (Table 1), 15 were made by direct priming of total RNA. The specimens used for RNA preparations and the methods used are described elsewhere (http://bodymap.ims.u-tokyo.ac.jp). The other libraries were made from poly(A)-selected RNA. For counting transcripts by sequencing, only the most 3′-terminal fragment left by cleaving off the bulk of the fragment with MboI from the pUC119 vector-primed cDNA was cloned, as described previously (Matsubara et al. 1993). This shortening of the inserts facilitates the unbiased representation of mRNA regardless of their original sizes at the expense of losing ∼5% of gene sequences due to the absence of MboI site or its location too close to the poly(A) tail.
Data Collection and Cleansing
Starting with randomly isolated transformants, sequence templates were prepared by PCR amplification of the insert cDNA in single-stranded phage released into the culture medium. All sequences were read from the MboI site toward poly(A), which allows unambiguous identification of the original transcripts. They were referred to as GSs (Okubo et al. 1992). In half of the cases, dye primer chemistry was used, and in the remaining cases, DYEnamic ET* Terminator Cycle Sequencing Kit (Amersham Pharmacia Biotech Inc.) was used. Sequences with >5% Ns, not starting with GATC (theMboI site), or having more than one GATC were eliminated. We then eliminated those sequences having >90% similarity in an overlap longer than 50 bp or 70% of the sequence length with vectors and ribosomal sequences. Sequences for mitochondrial transcripts were also eliminated. When the GATC and poly(A) tail were separated by <17 bp, the sequences were eliminated from the analysis because they were not always unique enough. Lastly, sequences were compared with a library of repetitive sequences, REPBASE (Jurka 1995,ftp://ncbi.nlm.nih.gov/repository/repbase/) by using BLAST (Altschul et al. 1990), and repetitive regions were masked as previously reported (Hishiki et al. 2000). All GS sequences were submitted to the DNA DataBank of Japan (DDBJ) and made available at our web site (http://bodymap.ims.u-tokyo.ac.up).
Transcript Counting/EST Clustering
Sequences from each new library were first compared to each other with FASTA (Pearson et al. 1988). When the similarity exceeded 95% for an overlap longer than 50 bp or 70% of insert length and the overlap started at a GATC, they were considered the same tag and clustered (primary cluster). From each cluster, one representative GS was selected and compared with representative sequences from previously generated clusters. By using the same criteria, clusters of the same GS were grouped, and a new representative tag was selected from the new cluster (secondary cluster). A five-figure cluster ID, referred to as the GS number, was assigned to each independent cluster. Representative sequences for the GS clusters were compared periodically with primate sequences in GenBank (Re. 110.0) and ESTs in UniGene (Build 75,http://www.ncbi.nlm.nih.gov/UniGene/). The criteria for identity were the same as those used for clustering. The correspondence of BodyMap ID (GS) to UniGene ID (Hs) was submitted to GenBank and implemented in UniGene.
Selection of Differentially Expressed Genes
For the selection of genes preferentially expressed in a given set of tissues, for example tissues A, B, and C, libraries
A–C were considered one library and the remaining 48 libraries in BodyMap another library. The probability of unregulated
expression between the two hypothetical libraries was calculated for each GS by the equation reported by Audic and Claverie
(Audic et al. 1997): Total isolation in A–C is N1 and isolation of the relevant GS is x. The total isolation in the remaining libraries isN2 and the occurrence of the relevant GS is y.
Analysis of Polyadenylation Signals
Among 62,710 entries of primate sequences in GenBank (Re.97), all human mRNAs with a single “poly(A)-site” listed in the features were used. From the representative sequences for all GSs, we selected those that satisfied all of the following conditions. The GS does not have matches in GenBank, is longer than 100 bp, and ends with poly(A). The GS sequence does not contain more than 5% Ns within 100 bp of the poly(A). The GS does not contain repetitive sequences or an N in the AATAAA sequence, such as 'NATAAA'.
From dbEST (Re. 93), we selected 118,353 3′ ESTs from the Washington-U/Merck project (Hillier et al. 1996) to avoid confusion due to inconsistencies in the feature descriptions from different laboratories. EST matches to BodyMap entries and GenBank primate mRNAs were eliminated first. Those ESTs with discrepancies between clone name and definition (5′ in clone name and 3′ EST in definition), and those denoted as “possible reverse clone” were also eliminated. 3′ ESTs with a stretch of longer than seven Ts (Tn > 7) at the beginning and those starting with A, G, or C (T0) were analyzed separately. Those ESTs starting with one to seven Ts were not used. Within each of these four categories, the 100 bases from the poly(A) site were compared with each other with BLAST N with the same criteria used for GS clustering, and the fragment containing the lowest number of Ns was selected from each cluster and used in the analysis.
Acknowledgments
The authors thank Ms. Kumiko Takagi for her secretarial assistance. This work was supported in part by Grant-in-Aid for Scientific Research on Priority Areas from the Ministry of Education, Science and Culture, and Research for the future of Japan Society for the Promotion of Science, Japan.
The publication costs of this article were defrayed in part by payment of page charges. This article must therefore be hereby marked “advertisement” in accordance with 18 USC section 1734 solely to indicate this fact.
Footnotes
-
↵5 Corresponding author.
-
E-MAIL kousaku{at}imcb.osaka-u.ac.jp; FAX 81-6-6877-1922.
-
Article and publication are at www.genome.org/cgi/doi/10.1101/gr.151500.
-
- Received June 8, 2000.
- Accepted September 18, 2000.
- Cold Spring Harbor Laboratory Press


