
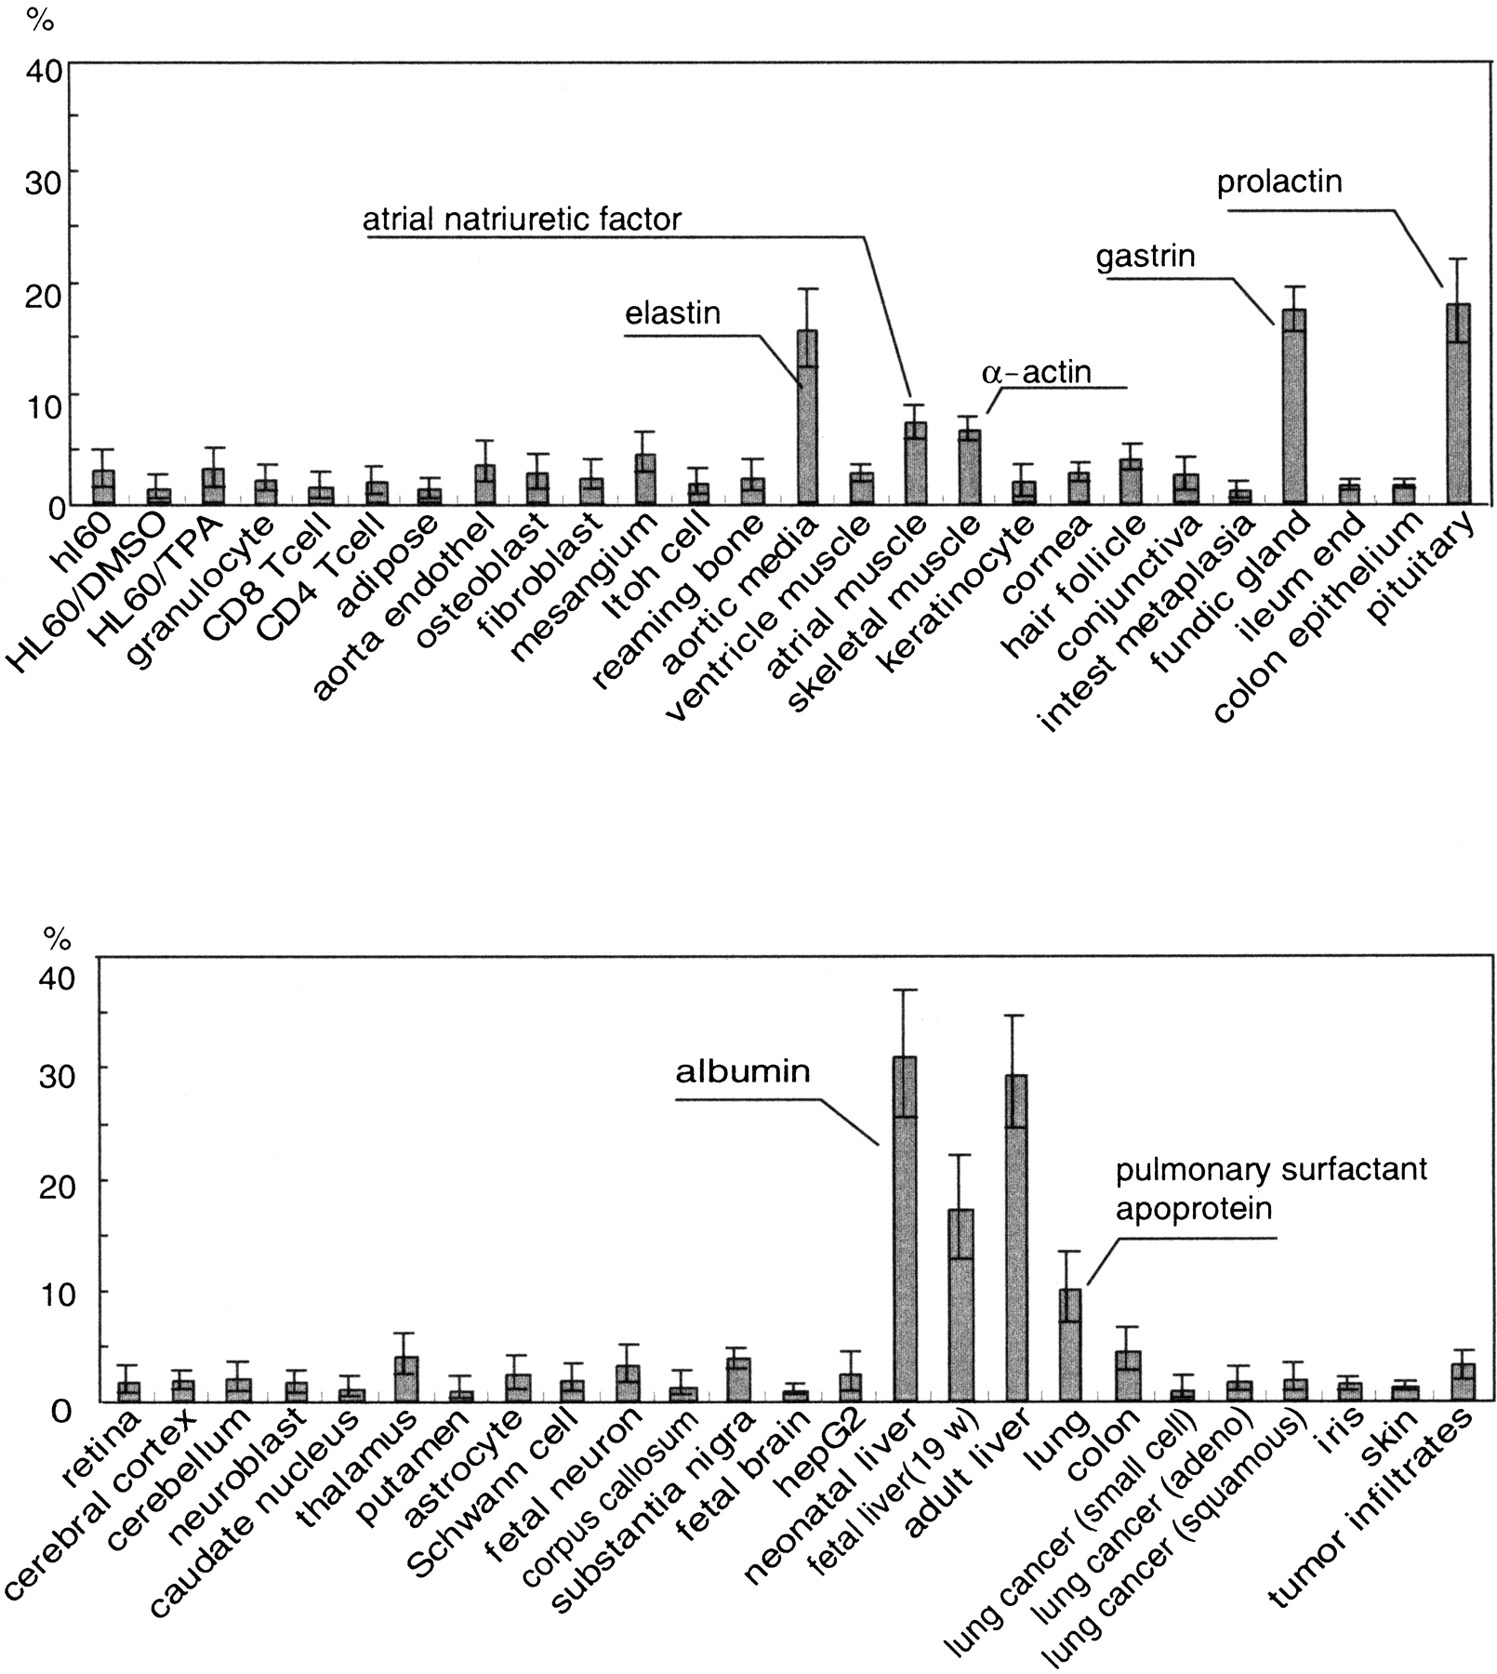
Figure 2.
The relative contents of the most abundant transcripts in 51 human tissues or cell types as measured by gene signature collection. The error range indicates the P value of 0.1 calculated for each observed occurrence. The identities of some transcripts are given. For the identities of other transcripts, see Table 1.


