
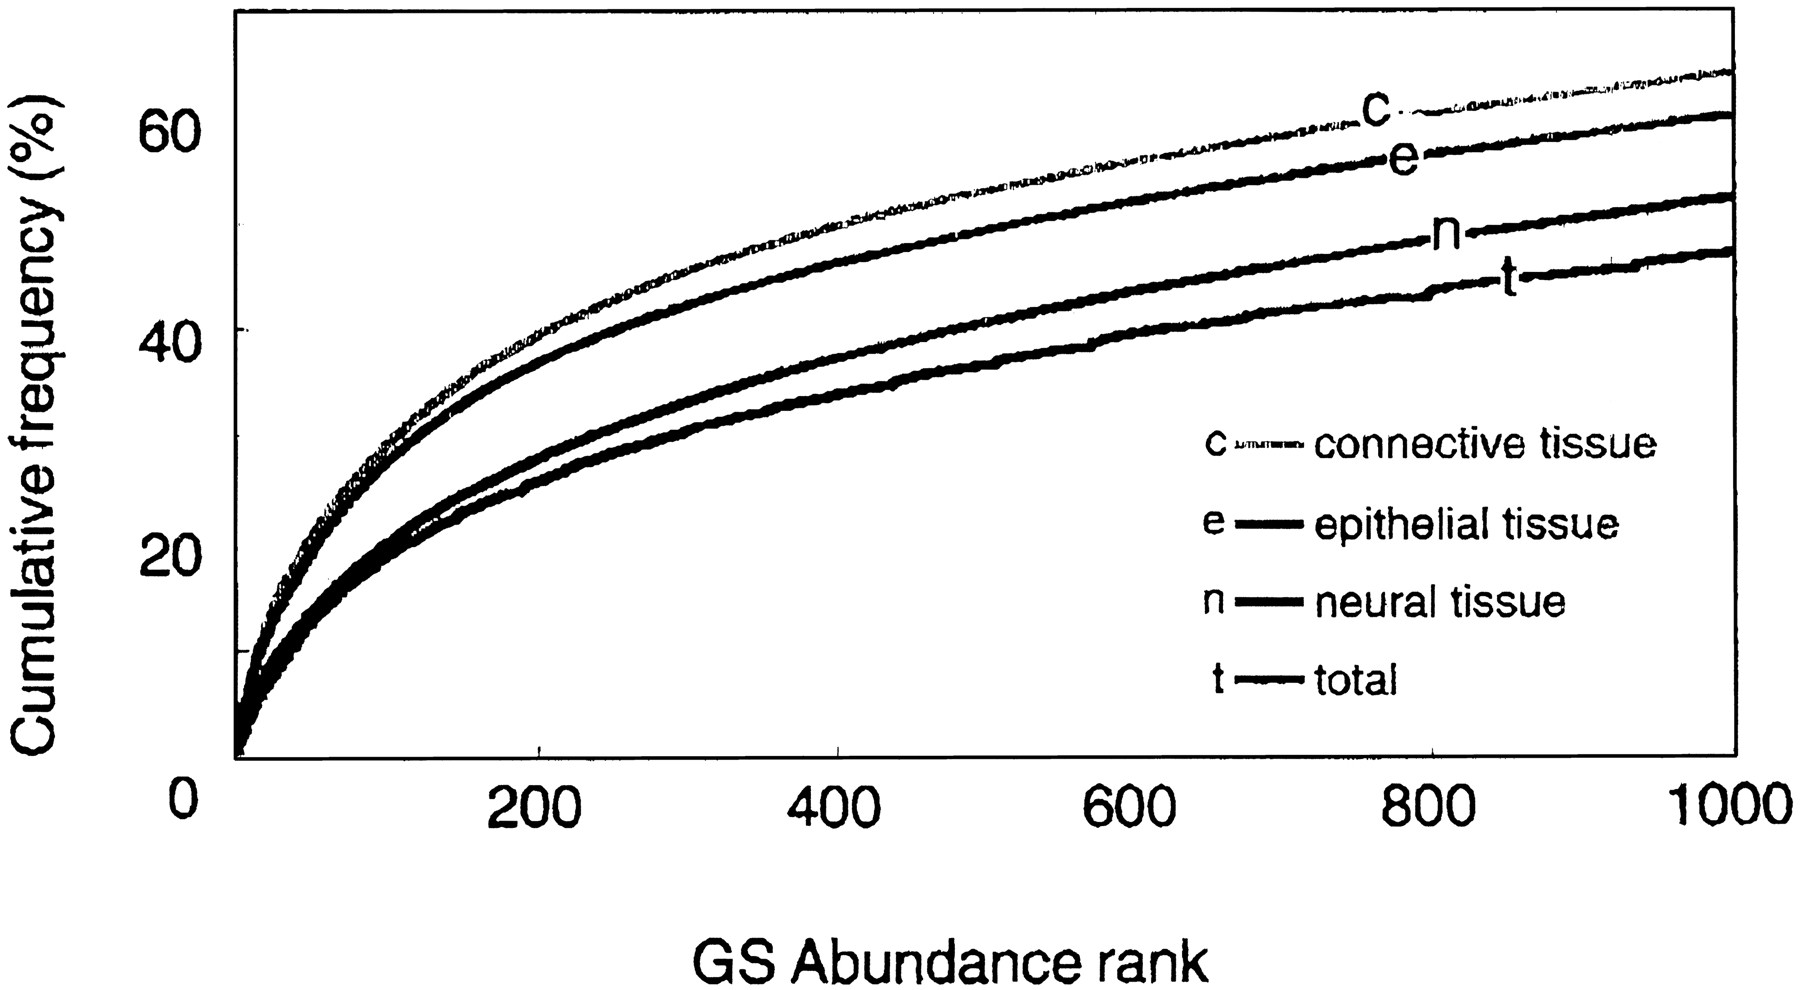
Figure 3.
Cumulative frequencies of gene signature (GS) sequences. The cumulative sums calculated in descending order of GS frequencies are plotted as a percentage of total tag occurrence. Tag occurrences in each of three major tissue categories were plotted separately.


