
Abstract
A pivotal step in electrophoresis sequencing is the conversion of the raw, continuous chromatogram data into the actual sequence of discrete nucleotides, a process referred to as basecalling. We describe a novel algorithm for basecalling implemented in the programLifeTrace. Like Phred, currently the most widely used basecalling software program, LifeTrace takes processed trace data as input. It was designed to be tolerant to variable peak spacing by means of an improved peak-detection algorithm that emphasizes local chromatogram information over global properties.LifeTrace is shown to generate high-quality basecalls and reliable quality scores. It proved particularly effective when applied to MegaBACE capillary sequencing machines. In a benchmark test of 8372 dye-primer MegaBACE chromatograms, LifeTrace generated 17% fewer substitution errors, 16% fewer insertion/deletion errors, and 2.4% more aligned bases to the finished sequence than didPhred. For two sets totaling 6624 dye-terminator chromatograms, the performance improvement was 15% fewer substitution errors, 10% fewer insertion/deletion errors, and 2.1% more aligned bases. The processing time required by LifeTrace is comparable to that of Phred. The predicted quality scores were in line with observed quality scores, permitting direct use for quality clipping and in silico single nucleotide polymorphism (SNP) detection. Furthermore, we introduce a new type of quality score associated with every basecall: the gap-quality. It estimates the probability of a deletion error between the current and the following basecall. This additional quality score improves detection of single basepair deletions when used for locating potential basecalling errors during the alignment. We also describe a new protocol for benchmarking that we believe better discerns basecaller performance differences than methods previously published.
DNA sequencing usually begins with a purified DNA template on which a reaction is performed for each of the four nucleotides (bases), generating a population of fragments that have various sizes depending on where the bases occur in the sequence. The fragments are labeled with base-specific fluorescent dyes and then separated in slab-gel or capillary electrophoresis instruments. As the fragments pass the detection zone of the sequencer, lasers scan the signals. Information about the identity of the nucleotide bases is provided by the base-specific dye attached to the primer (dye-primer chemistry) or dideoxy chain-terminating nucleotide (dye-terminator chemistry). Additional steps include lane tracking and profiling (slab-gel only) and trace processing, which produce a set of four arrays (traces) of signal intensities corresponding to each of the four bases over the many time points of the sequencing run. Trace processing consists of baseline subtraction, locating start and stop positions, spectral separation, resolution enhancement, and some mobility correction. The final step in DNA sequencing is translating the processed trace data obtained for the four different bases into the actual sequence of nucleotides, a process referred to as basecalling.
The accuracy of the computational algorithm employed for basecalling directly impacts the quality of the resulting sequence and determines to a significant degree the economic costs associated with sequencing, as well as its usability for detecting single nucleotide polymorphisms (SNPs). Although basecalling is algorithmically straightforward for ideal data (noise-free, evenly spaced, Gaussian-shaped peaks of equal height for all four bases), it is naturally more difficult and error prone for real trace data. Inevitable experimental as well as systematic factors degrade the quality of obtainable data, resulting in peaks with variable spacing and height and secondary peaks underneath the primary peaks. For a summary of influencing factors, we refer the reader to Ewing et al. (1998). Because basecalling is error prone, it is desirable to provide an estimate of quality (quality score) for each assigned base. The estimation of confidence is an integral part of many existing basecalling algorithms (Giddings et al. 1993, 1998; Golden et al. 1993; Ewing and Green 1998). Quality scores are critical for accurate sequence assembly and reliable detection of SNPs (Buetow et al. 1999; Altshuler et al. 2000). The rigorous implementation of the concept of quality scores that translate directly into an estimated error rate, along with highly reliable basecalls for slab-gel based sequencing machines, helped Phred, a basecaller introduced by Ewing and Green (1998) and Ewing et al. (1998), to become the most widely used basecalling software (Richterich 1998).
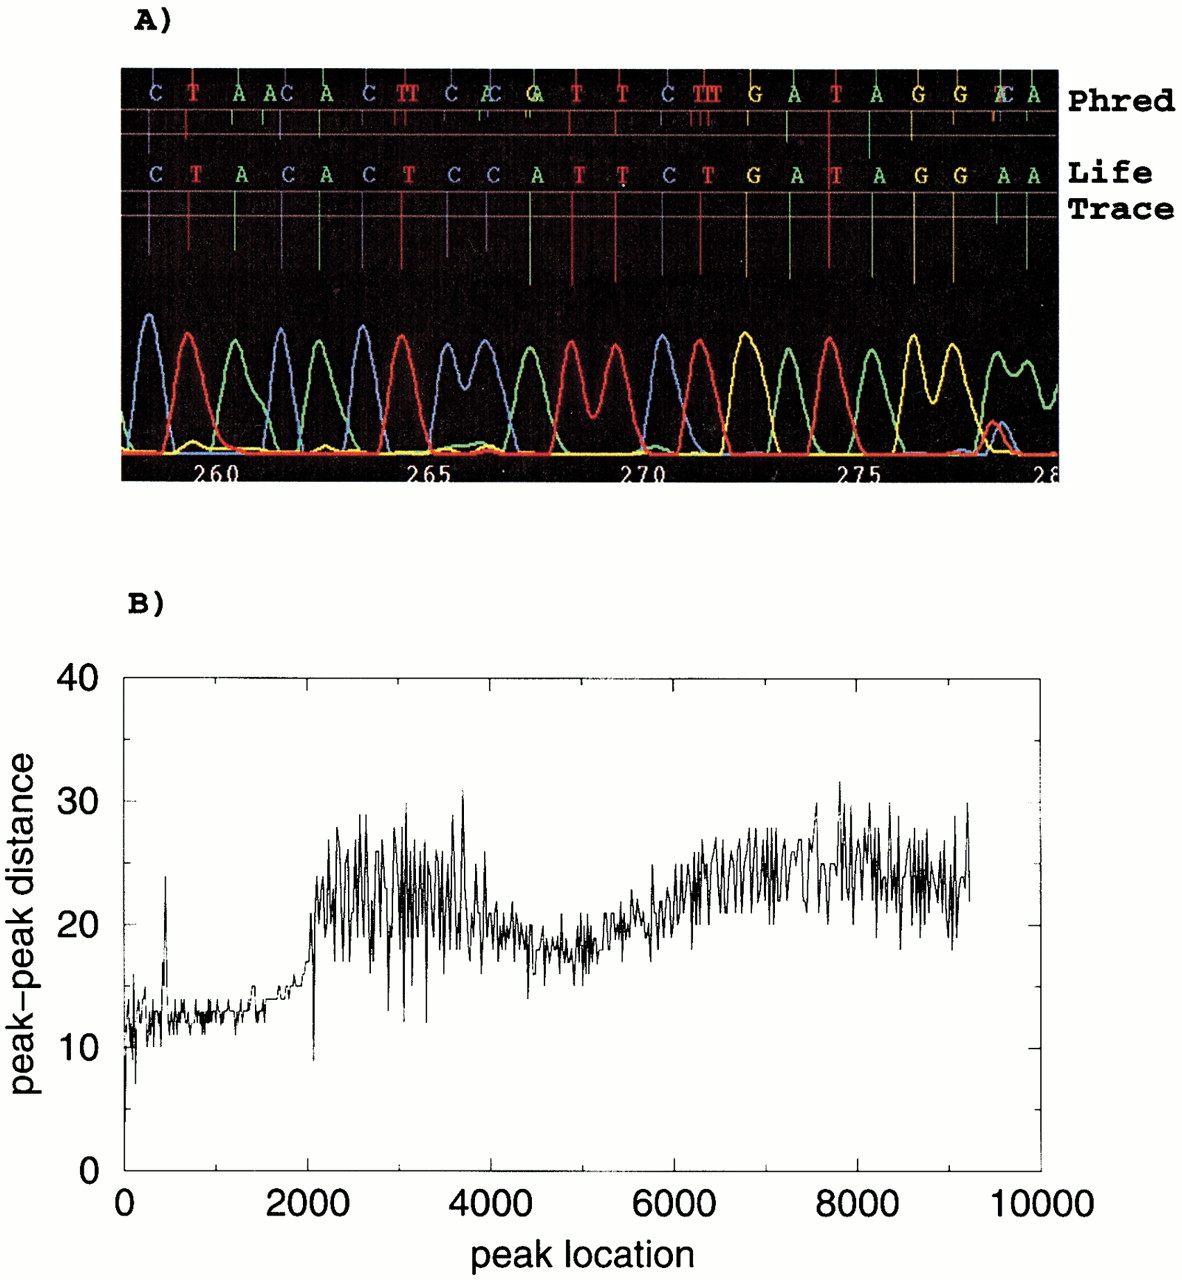
Given that Phred was optimized for slab-gel sequencers, it performs fairly well for capillary-based machines. We noted significant problems, however, with its algorithm for handling variable peak spacing, especially for MegaBACE sequencers, in which the spacing between peaks can change rather abruptly along the traces (commonly referred to as the accordion effect). Phred starts the basecalling process by predicting idealized peak locations, which are then matched up with observed peaks to generate the actual calls. The problems are caused by the way that Phred computes and uses predicted peak information. Phred first looks for the portion of the chromatogram that has the most uniform spacing and works its way outward. At each step of the way out, there is a limit on how fast the spacing can change. When the spacing changes too rapidly,Phred can lose synchronization with the actual spacing. Attempts by one of the authors (G.B.), in collaboration with the authors of Phred, to improve its ability to handle variable peak spacing met with limited success. When desynchronization occurs, Phred may add or remove basecalls to preserve uniform peak spacing. This can result in excessive insertion and deletion errors that can lead to serious assembly problems or frame shifts during translation into amino acid sequence. Phreddoes, however, identify the problem by assigning low quality scores for such basecalls. An example of erroneous Phred basecalls is shown in Figure 1a. Even though the shown segment of the chromatogram appears to have good quality,Phred incorrectly adds bases. The corresponding graph of peak-to-peak distance as a function of peak location (Fig. 1b), as determined by LifeTrace, reveals a change in peak-peak spacing of nearly threefold over the length of chromatogram data. As our example shows, this may cause problems in cases in which idealized and observed peaks have poor correspondence.
(A) Sample MegaBACE chromatogram with corresponding basecalls by Phred (top) and LifeTrace(bottom). Length of peak locator tick lines corresponds to associated quality scores, with longer ticks indicating higher quality. Horizontal lines mark quality score levels of 0 and 15, respectively. (B) Peak–peak distance as a function of peak location as determined by LifeTrace. For every peak at a given chromatogram location (x-axis), its associated distance to the next peak is plotted (y-axis). The chromatogram segment shown in A corresponds to chromatogram location between 4000 and 4400.
Here we introduce an algorithm implemented in the programLifeTrace that focuses on observed data to determine peaks. Peaks are determined by transforming each of the four individual traces by weighting each position by how peaklike its shape is around the current location by means of a cross-correlation coefficient with a single ideal peak, and then generating a single new trace that combines all four transformed traces. This methodology substantially reduces noise before peak assignment and allows for accurate local peak detection, despite varying peak spacing across the entire chromatogram. Subsequent filters are applied to generate the final sequence of called bases. We show that, for the both dye-terminator and dye-primer sets of MegaBACE chromatograms tested here, LifeTrace generates calls with significantly fewer insertion and deletion errors (indels) and substitution errors than Phred, and associates predictive quality scores to each call. In addition, we present results for chromatogram sets obtained from ABI-377 slab-gel sequencer and ABI-3700 (another capillary sequencing machine) that reveal that the overall performance of LifeTrace is similar to that ofPhred.
We also introduce a novel type of quality score: the gap-quality. It estimates the probability of a deletion error between the current and the following assigned basecall, that is, another true base between the two basecalls was not called. This additional quality score can be used for improved detection of basepair deletions because it helps locating potential basecalling errors during alignment.
Furthermore, we describe a new protocol for benchmarking basecaller performance. We believe that it better discerns the performance differences than the method introduced by Ewing and Green (1998) andEwing et al. (1998) and may find broad application in future benchmark tests.
METHODS
In this section, we describe the key processing steps performed byLifeTrace. Documenting all details of the filtering steps and associated parameters would exceed the format of this article. Below, we give a broad outline of the different processing steps ofLifeTrace, and the interested reader is referred to the source code for more information (see Availability). LikePhred, LifeTrace takes processed trace data as input. The processing steps can be divided into three parts. In part one, LifeTrace transforms the four original traces into a single trace (designated LT), significantly reducing noise and emphasizing peaklike shapes. LT is the primary input for peak detection. In part two, the determined peaks are assigned a base (i.e., the actual basecalling is conducted). In part three, quality scores are computed that are then used internally for quality filtering. During quality filtering, basecalls can be either removed or added.
Peak Detection
A possible method for detecting peaks would be to generate a fifth trace, computed as the maximum value of the four traces at all trace locations, and then to find local maxima in this new trace. This method would fail, however, if a peak is hidden underneath a flanking segment of a neighboring peak. To avoid this, it would help to make the broad and obstructing peak narrower first, removing the overlap. Ideally, a sharp peak of zero width—a delta function in mathematical terms—would identify all, and now well-separated, real peaks. To accomplish better segregation of peaks by making the original peaks narrower,LifeTrace measures at all trace locations how peaklike the traces are locally. Mathematically, this is accomplished by applying a cross-correlation computation of the current trace segment with an ideal, Gaussian-shaped peak. Segments with peak characteristic, that is, the center of segment has a maximal trace value that will have high cross-correlation with the model peak (correlation coefficientr near +1), concave regions will have negative correlation (r ∼ −1), monotone regions will result in no correlation (r ∼ 0). Multiplying the original trace with the corresponding value of r, which has been re-scaled to lie between 0 and 1, will in effect narrow peaks, and repeated application would arrive at delta functions. LifeTrace applies the cross-correlation transformation in a single pass as follows:
At this stage, four new traces have been generated that resemble the original traces, but with narrower peaks. These four traces are now combined to produce one trace by essentially taking the maximumf-value at each trace location. In a closed form, and with some simultaneous smoothing, this new trace LT is obtained by:
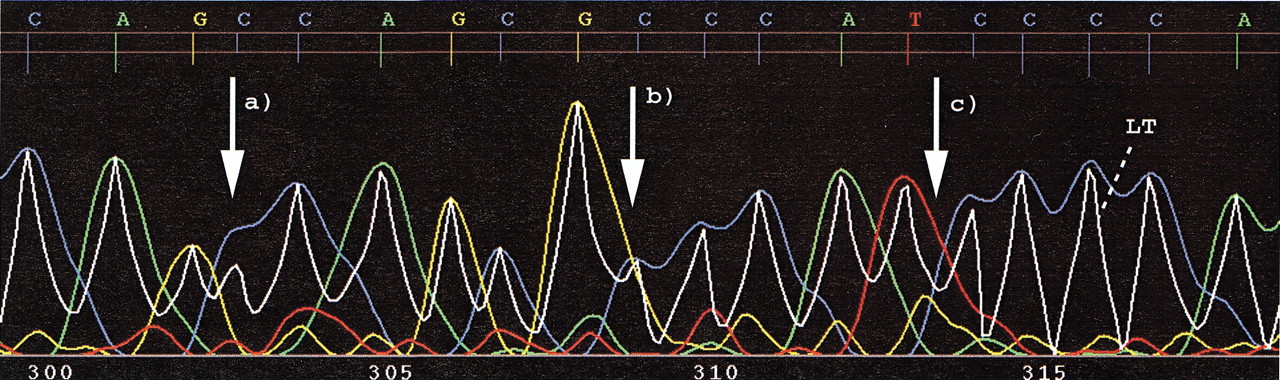
The described transformation process is illustrated in Figure2. It is evident that an improved peak separation is accomplished as is a reduction of noise. Instead of analyzing four traces to detect peaks, one trace (LT) is now sufficient. All local maxima and minima of LT are then detected by scanning through LT.
Illustration of the processing of chromatogram trace data byLifeTrace. Shown are the four original traces and the composite trace LT (Eq.{ label needed for disp-formula[@id='E4'] }) that provides the basis for peak detection. LifeTrace basecalls are given in the top row with the length of the tick lines that indicate the peak location corresponding to the LifeTrace quality score, with longer ticks indicating higher quality. The two horizontal lines mark quality score 0 and 15. Locations illustrate the facilitated peak detection provided by trace transformations of LifeTrace(transformed trace LT) making it possible to (a) reliably detect peaks that are peak shoulders and not local maxima, yet are real; (b) separate overlapping peaks; and (c) to reduce noise from residual traces as they are not reflected in local maxima in the trace LT.
Peak Assignment
Basecalls are assigned to all detected local maxima of LTaccording to:
Quality Filtering
Subsequent to the initial base assignments, two iterations of quality filtering are performed in which, according to several quality criteria, peaks can be removed or merged in cases of runs of the same base. Finally, traces are checked for possible basecall additions in cases of broad peaks, in which the peak detection algorithm may have assigned too few bases. The selection of quality criteria and associated quality thresholds used during quality filtering were derived heuristically from numerous test runs and cannot all be described in sufficient detail here. However, the most critical parameter for resolving basecall errors is the proper estimation of the correct peak spacing. LifeTrace attempts to infer the correct peak to peak distances in regions of low-trace data quality from the closest (in terms of location) available regions of higher quality as determined by the internally assigned quality scores and uniformity of peak to peak distance in this region.
Removal of Calls
All basecalls are first sorted according to ascending order of quality score (see below). Starting with lowest quality, basecalls are checked for whether they pass the imposed quality criteria and are removed if otherwise. A total of nine quality thresholds impose restrictions on the minimally acceptable peak height and peak-to-peak spacing before and after a potential basecall removal and combinations thereof.
Merger of Calls
If a merger of two consecutive bases of the same type results in a new peak spacing that is more in line with higher quality regions, and the corresponding trace between the two calls does not show a clear separation, the call with lower quality is removed.
Addition of Calls
Broad, but Gaussian-like, peaks will initially get assigned a single basecall. However, it is possible that several bases of the same type are merged into one peak. To detect such peaks, LifeTracedetermines the width of all peaks and compares it to the mean observed peak separation for high-quality regions proximal to the current peak. If the integral value of the expression 0.45 + peak_width/peak_spacing is >1, a corresponding number of bases are added to the current peak. The width is determined by requiring that peaks of different bases do not overlap. If the maximal trace value changes from one base to another, the value of LTdrops below max(LTs )/10, or the maximal trace value at the current position drops below max(LTs )/6, the previous peak ends. The next peak starts where all the previously described thresholds are exceeded again. The index s denotes which of three equally sized segments of the chromatogram is currently being processed. This is performed to account for changing maximal trace values across the chromatogram length. Inserted peaks are assigned an arbitrary quality score of max(Qscores)/10.
The peak width determination procedure also identifies gaps as the space in between peaks. For a variety of reasons, these gaps can represent real base drop-outs, and LifeTrace adds a corresponding number of N-basecalls.
Quality Scores
Equally important as the actual basecalls are associated quality scores that allow an assessment of the reliability of the call and to discriminate high-quality from low-quality calls (Lawrence and Solovyev 1994; Ewing and Green 1998). LifeTrace distinguishes between two different quality scores: the quality of the call and the quality of the space between calls (gap-quality), an indication that a true base may not have been called. The motivation to introduce the gap-quality lies in its potential application in finding deletion SNPs, in which a potential base deletion needs to be distinguished reliably from a basecall error, and in helping in locating the deletion during alignment, as the score can be used as a gap penalty in the dynamic programming alignment process.
The quality score of a base is calculated from the trace properties at and near its peak position. First, the level of noise (i.e., secondary peaks underneath the called base) is evaluated:
The gap-quality score is composed of two components: the degree of noise between two consecutive calls and overly wide peak spacing between bases i and i + 1, indicative of another base that might be there but was not called:
If a base is removed during quality filtering, the gap quality score of the base preceding this call is lowered. The last base call is assigned an arbitrary gap-quality score of 0.5 (note that scores are rescaled later).
As a last processing step, the quality scores assigned byLifeTrace are smoothed across all basecalls and transformed in scale to adhere to the convention thatq = −10 × log10(p) (Ewing and Green 1998), in which q is the quality score, and p is the true observed error rate. Because LifeTrace quality scores yielded a monotonic q-to-p relationship resembling a quadratic function in the semi-logarithmic plot, scale calibration was accomplished by a simple transformation. If a q-score of a given base is greater than the q-score of the preceding and following basecall, it is recalculated as the arithmetic mean of the three. This was implemented to avoid high q-scores in otherwise low-quality regions.
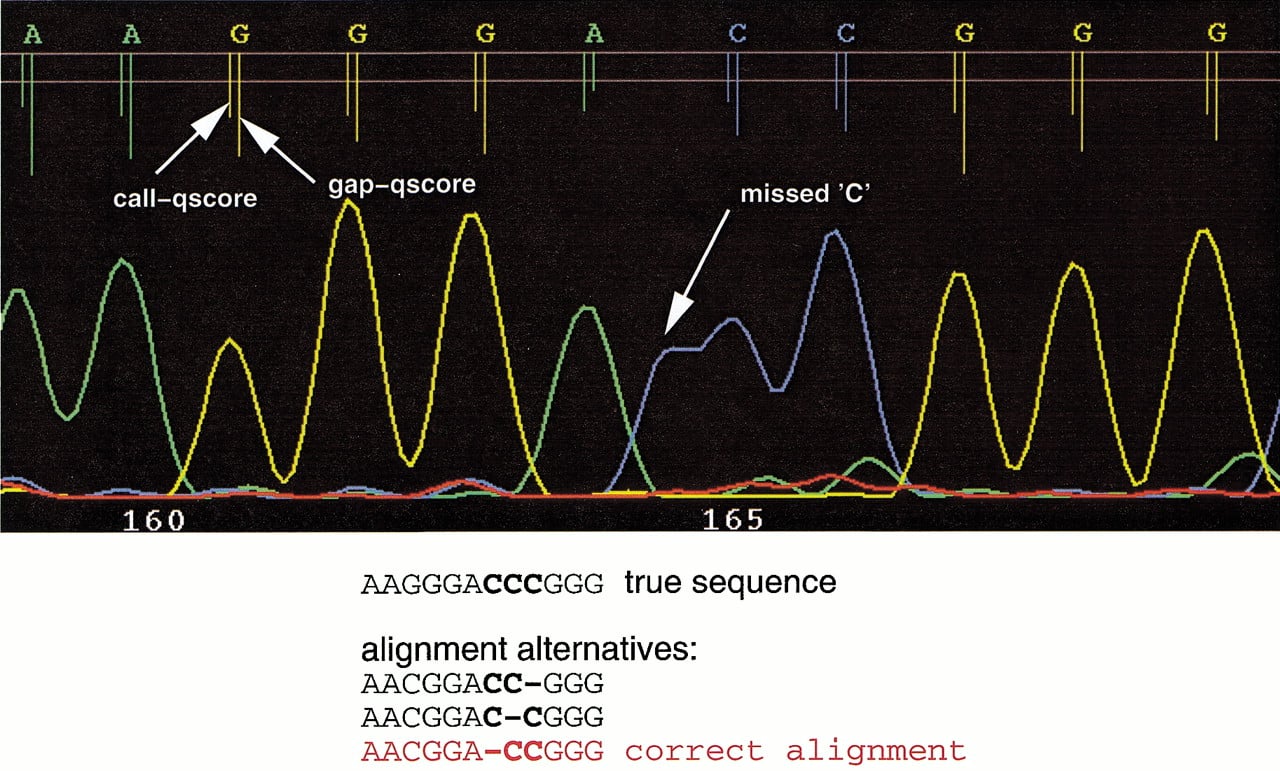
Figure 3 exemplifies the concept of a gap-quality score. In the example, LifeTrace misses a true “C” basecall. However, the gap-quality score of the preceding “A” is low, indicating the high probability of a deletion error. Evidently, the neighboring basecalls are high quality as reflected in the high-quality scores. Figure 3 also illustrates how a deletion error in a run of the same base can be aligned differently. The gap-quality scores help locate the deletion error and the link between gap-quality score and deletion error can be established correctly.
Illustration of the concept of a gap-quality introduced inLifeTrace. Part of a sample chromatogram shows traces and calls, with associated quality scores quantified by the length of the peak locator tick mark. Two horizontal lines mark quality score levels of 0 and 15. The left tick line represents the quality score of the actual base call, whereas the right tick line measures the quality of the gap to the following called base. In this example, a basecall error has occurred: a C was not called. This singleC-deletion can generate three different alignments of equal alignment score as shown below. However, the chromatogram suggests that the error has occurred in the first position of the three Crun. This is reflected in the low gap-quality score of the precedingA. By taking into account gap-quality scores during alignments, the gap is correctly positioned at the first position.
Performance Testing
Data Sets
We evaluated the performance of LifeTrace for three commonly used sequencing machines: MegaBACE 1000 and ABI-3700 capillary sequencers and the ABI-377 slab-gel sequencing machine. Our focus, however, is on the MegaBACE because we observed the greatest performance improvement for this machine type. We used large sets of MegaBACE reads from three human BAC clones (chromosome 7) for accuracy assessment of the LifeTrace and Phredbase-callers (Table 1). Each of these clones was shotgun-sequenced to high depth (10× to 20×) by Incyte Genomics and in one case (RP11-349E11) also by the University of Washington Genome Sequencing Center (UWGSC). The sequences were then assembled and finished by UWGSC. The accuracy of the finished sequences is very high, probably less than one error in 50,000 bases. Thus, these sequences are suitable for evaluating base-caller accuracy. Only the reads produced by Incyte were used in the analysis, and the number of these is shown in Table 1. All of sequences by Incyte were read using Amersham's MegaBACE 1000 capillary sequencer. Trace processing was performed using theCimarron v1.61 analysis software (Cimarron Software). The data sets are naturally grouped by chemistry so dye-primer reads were analyzed separately from dye-terminator reads.
BAC Clone Descriptions
| BAC clone | Accession no. | GI no. | Size | Reads | Chemistry | ID in this paper |
| RP11-349E11 | AC007312 | 4586080 | 185652 bp | 8273 | Dye Primer | MB_prim |
| RP11-260N14 | AC009542 | 6554502 | 160367 bp | 3264 | ET Terminator | MB_term |
| RP11-169C22 | AC009178 | 6642684 | 178097 bp | 3360 | ET Terminator |
Alignment Results
| Basecaller | MB_Prim | MB_Term | |||
| aligned reads | aligned bases | aligned reads | aligned bases | ||
| Phred | 5299 | 2425026 | 5231 | 2639830 | |
| LifeTrace | 5352 | 2483208 | 5292 | 2696119 | |
Additional testing was performed for a total of 4714 ABI-3700 sequencer chromatograms of mixed chemistry (primer, terminator) and corresponding assembled consensus sequences kindly made available to us by the Genome Sequencing Center of the Washington University, Saint Louis.
A small set of 1184 ABI-377 chromatograms that assemble into human collagenase (GenBank accession no. U78045) was used for benchmarking the slab-gel sequencer.
Performance Analysis
For testing the performance of LifeTrace and comparing it to that of Phred, we applied two different strategies. In the first, referred to as Method 1, we adopted the benchmarking algorithm detailed in the original Phred publication (Ewing et al. 1998). Here, the basecalls are aligned to the known true consensus sequence using cross_match with alignment parameters as given in Ewing et al. (1998). The alignment region where both called sequences (called by Phred and LifeTrace) can be aligned, the jointly alignable region, is analyzed for basecall errors (i.e., substitution errors, deletion errors, or insertion errors). Basecalls that go beyond the jointly alignable region and align to the true sequence are captured in the number of additionally aligned bases for the basecaller that generated these calls.
In effect, this method confines the analysis to higher quality regions, because both basecallers agree to large extent, and consequently, the error statistics have to be rather similar. It is possible, however, that one basecaller consistently generates more alignable bases with few basecall errors. In Method 1, this would be reflected by the number of additionally aligned bases, but would not allow a comparison of actual error rates in those regions.
In contrast to Method 1, where a consensus alignment is analyzed, in Method 2 error statistics are collected over the consensus sequence stretch the boundaries of which are determined by the left-most (with regard to the consensus sequence) and right-most BLASTHigh Scoring Pair (HSP) bounds (aligned segment betweenLifeTrace or Phred query and consensus sequence) contributed by either Phred orLifeTrace in Method 2. The rationale is that a high scoring BLAST hit by either one of the two basecallers proves that the trace data permitted such accurate basecalling, and therefore, the other basecaller underperformed.
For every chromatogram, the Phred- andLifeTrace-generated nucleotide sequences were aligned to the consensus (true) sequence using the program BLASTNwith default parameters (Altschul et al. 1990; version 2.0a 19 Wash U). The smallest and largest trace locations associated with the first and last bases belonging to the top HSPs with a p-value smaller than 10−20, from either the Phred sequence orLifeTrace sequence, were used to determine the start and end location of alignable trace data. All bases falling in between the start and end trace locations are excised out of bothPhred and LifeTrace sequences and are then realigned using full dynamic programming (Needleman and Wunsch 1977) to the determined hit region in the consensus sequence (sequence between the first and last consensus base found by either Phred orLifeTrace). To avoid attributing basecall errors to vector sequence, it was required that either Phred orLifeTrace had an exact match over at least 10 consecutive bases at both ends, and error statistics were collected only for the remaining middle section of the alignment. Results reported in the abstract were obtained from applying Method 1.
Deriving error statistics in conjunction with quality scores requires that basecall errors are located correctly during alignment. For example, if a deletion error occurred in a run of four ‘C’s, in which only three ‘C’s were called, the error could be attributed to any of the four bases and would not change the global alignment score. It is therefore possible that such a deletion error is assigned incorrectly to a high-quality basecall during standard dynamic programming and not to an ambiguous trace location. Similarly, what in reality is an insertion followed by a deletion a few bases later based on trace data could be misinterpreted as a single substitution error (Berno 1996). To diminish the impact of such problems, we used the actual quality scores as match scores and gap penalty during alignment. As a result, deletions in runs are placed at positions of lowest quality (i.e., the most likely place where the error has occurred), and matches are assigned with preference given to high-quality base calls. In detail, we used a score of +1 +LifeTraceQscore[baseCall]/5 for position-specific matches, −2 for mismatch, −3 +LifeTraceGapQscore[baseCall]/10) as the position-dependent gap penalty. Substitution and insertion errors are linked to the regular quality score of the corresponding basecall, and deletion errors are associated with the gap quality score of the base preceding the gap as it measures the quality of the gap to the next called base.
Phred version 0.99077.f was used in this study. This version of Phred uses instrument-specific quality score calibrations for ABI-377, MegaBACE 1000, and ABI-3700.
RESULTS AND DISCUSSION
We focus our discussion of the performance of LifeTraceon the MegaBACE chromatogram sets, because we observed the most consistent performance gain for this set. Also, all of the presented calibration results for the quality scores will be for this set. Error statistics for the other two sets (ABI-377 and ABI-3700 sequencing machines) will also be given but are obtained from Method 2 only.
Error Rates
The benchmark statistics for the two basecallers Phredand LifeTrace obtained from performance testing according to Method 1 (see “Performance Testing” ) for the MegaBACE chromatogram sets are presented in Tables1 T2 T3.LifeTrace has 2.4% more aligned bases than didPhred for dye primer and 2.1% more for dye terminator. The bulk of this difference comes from longer reads, but a significant fraction also comes from additional aligned reads.
Overall, LifeTrace made 17% fewer errors for dye-primer data. LifeTrace made 17% fewer substitution errors and 16% fewer indels. For dye-terminator data, LifeTrace made 13% fewer errors overall. On substitutions, LifeTracemade 15% fewer errors and 10% fewer indels. The breakdown per error type and base position is given in Figure4. For both sets, dye-primer and dye-terminator, and for all position ranges,LifeTrace generates consistently fewer total errors, calls fewer Ns, and makes fewer substitution errors. The number of indels generated by LifeTrace is lowered significantly in the range of base position 100 to 500, the range that usually contributes the most high-quality trace information and the most base calls in the error statistics (Table 3).
Performance comparison of Phred (gray bars) andLifeTrace (black bars) using Method 1 (see Performance Analysis). Basecall errors are analyzed for the different error types and as a function of position in the called sequence. (A) MegaBACE dye-primer set, (B) MegaBACE dye-terminator set. InDel indicates combined insertions and deletion errors; N, called Ns (i.e., undecided basecalls).

Total Number of Jointly Aligned Bases, by Read Position and Chemistry
| Base position | MB_Prim | MB_Term |
| –99 | 168823 | 175661 |
| 100–199 | 498926 | 501383 |
| 200–299 | 449075 | 484530 |
| 300–399 | 397832 | 458358 |
| 400–499 | 359640 | 428983 |
| 500–599 | 298010 | 367775 |
| 600–699 | 159247 | 177021 |
| 700–799 | 14987 | 7941 |
| 800–899 | 169 | 27 |
| 900–999 | 6 |
By restricting the error analysis to regions where both basecallers align to the true sequence, Method 1 will tend to gather error statistics for regions where both basecallers generate few errors. It is possible, however, that what is given as additionally aligned bases in Method 1 for LifeTrace are in fact high-confidence base calls with few errors for a region where Phred introduces exceptionally many errors (Fig. 1). For example, for a particular chromatogram, Method 1 generated a jointly alignable sequence region of 202 bases with seven errors for Phred and zero errors forLifeTrace with 264 extra aligned bases. By contrast, Method 2 generates an initial blast alignment of 465 bases based on theLifeTrace-called sequence with 67 base call errors in the equivalent chromatogram region by Phred and zero byLifeTrace. Evidently, Method 2 widens the performance difference by further analyzing the extra aligned bases.
The performance comparison between the basecallers Phredand LifeTrace using Method 2 (see “Performance Testing”) is summarized in Table 4. For the two MegaBACE sets (dye-primer and dye-terminator),LifeTrace generates about 30% fewer basecall errors than did Phred. As explained above, this sharper decrease of errors generated by LifeTrace compared withPhred in Method 2 compared with Method 1 originates from extended error analysis into the extra aligned bases byLifeTrace. Insertion errors in particular are reduced significantly. This can be attributed to the frequent failure ofPhred to adjust to variable peak-spacing as illustrated in Figure 1. The number of substitution errors by LifeTraceis also reduced compared to that of Phred. For the primer set, there are 12,192 basecalls in which Phred has a substitution error and LifeTrace is correct, contrasted with only 10,727 (12% fewer) cases for which Phred is correct and LifeTrace miscalled a base. The decrease of substitution errors for the same comparison is 2.3% for dye-terminator data. The total number of indels produced by LifeTrace is significantly lower (42% less for the dye-primer and 47% less for the dye-terminator set), largely because of a much reduced number of insertion errors. LifeTrace generated on average 3% to 5% longer initial BLAST alignments of the called sequence to the true sequence than did Phred, indicative of the increased number of correct calls.
Error Statistics Derived from Performance Testing
| MB_prim Total base calls aligned: 2,404,898 | |||||
|
Phred
LifeTrace | Correct | Subst | Insert | Del | Total LifeTrace |
| Correct | 2,346,881 | 12,192 | 43,884 | 8,508 | |
| Subst | 10,727 | 14,069 | 0 | 2,232 | 27,028 |
| Insert | 21,300 | 0 | 6,072 | 0 | 27,372 |
| Del | 4,836 | 1,179 | 0 | 6,072 | 12,087 |
| TotalPhred | 27,440 | 49,956 | 16,812 | ||
| Summary: | |||||
| Both correct: 97.6% of all aligned true-sequence bases | |||||
| Total LifeTrace errors: 64,689 = 70% of Phred errors, Total Phrederrors: 92,410 | |||||
| Total InDelsLifeTrace: 37,661 = 57.9% of PhredInDels, Total Phred: 64,970 | |||||
| MeanBLAST hit length to true consensus sequence,LifeTrace: 517.5, Phred: 493.9 | |||||
| MB_term Total base calls aligned: 2,748,823 | |||||
|
Phred
LifeTrace | Correct | Subst | Insert | Del | Total LifeTrace |
| Correct | 2,691,854 | 11,020 | 33,532 | 8,049 | |
| Subst | 10,770 | 15,215 | 0 | 1,434 | 27,419 |
| Insert | 11,573 | 0 | 3,609 | 0 | 15,182 |
| Del | 6,714 | 1,477 | 0 | 2,290 | 10,481 |
| TotalPhred | 27,712 | 37,141 | 11,773 | ||
| Summary: | |||||
| Both correct: 97.9% of all aligned true-sequence bases | |||||
| Total LifeTrace errors: 53,082 = 69.2% of Phred errors, Total Phrederrors: 76,626 | |||||
| Total InDelsLifeTrace: 25,663 = 52.3% of PhredInDels, Total Phred: 48,914 | |||||
| MeanBLAST hit length to true consensus sequence,LifeTrace: 532.3, Phred: 517.5 | |||||
| 337 Total base calls aligned: 666,489 | |||||
|
Phred
LifeTrace | Correct | Subst | Insert | Del | Total LifeTrace |
| Correct | 644,389 | 5,612 | 2,974 | 1,843 | |
| Subst | 4,414 | 6,865 | 0 | 721 | 12,000 |
| Insert | 4,424 | 0 | 651 | 0 | 5,075 |
| Del | 1,671 | 317 | 0 | 657 | 2,645 |
| TotalPhred | 12,794 | 3,625 | 3,221 | ||
| Summary | |||||
| Both correct: 96.7% of all aligned true-sequence bases | |||||
| Total LIfeTrace errors: 19,720 = 100.4% of Phred errors, Total Phrederrors: 19,640 | |||||
| Total InDelsLifeTrace: 7,720 = 113.2% of PhredInDels, Total Phred: 6,846 | |||||
| MeanBLAST hit length to true consensus sequence,LifeTrace: 582.6, Phred: 594.2 | |||||
| 3700 Total base calls aligned: 2,659,195 | |||||
|
Phred
LifeTrace | Correct | Subst | Insert | Del | Total LifeTrace |
| Correct | 2,519,021 | 31,671 | 23,497 | 17,676 | |
| Subst | 17,493 | 20,863 | 0 | 2,698 | 41,054 |
| Insert | 11,930 | 0 | 1,482 | 0 | 13,412 |
| Del | 34,113 | 5,257 | 0 | 10,403 | 49,773 |
| TotalPhred | 73,397 | 24,979 | 30,777 | ||
| Summary: | |||||
| Both correct: 94.7% of all aligned true-sequence bases | |||||
| Total LifeTrace errors: 104,239 = 91.8% of Phred errors, Total Phrederrors: 113,547 | |||||
| Total InDelsLifeTrace: 53,185 = 113.5% of PhredInDels, Total Phred: 55,756 | |||||
| MeanBLAST hit length to true consensus sequence,LifeTrace: 662.5, Phred: 705.8 | |||||
[i] Break down of error statistics derived from performance testing using Method 2 (see Methods section) applied to both the MegaBACE dye-primer and dye-terminator set. Table lists all possible error combinations. For example, for the set MB_prim there were 12,192 correct calls made by LifeTrace where Phredhad a substitution error at the same position compared to 10,727 wherePhred was correct and LifeTrace had a substitution error and 14,069 cases where both basecallers had a substitution error. Mean BLAST hit length refers to the length of the high scoring sequence alignment between the called sequence and the finished, true consensus sequence. CalledNs are counted as bases and contributed to substitution and insertion errors.
For the ABI-377–sequencer chromatogram set, the overall performance is comparable with almost exactly the same overall error rates forPhred and LifeTrace. The breakdown into error types reveals that LifeTrace generates more indels for this set, offset by a reduced number of substitution errors. The higher number of indels is also reflected in 2% shorter initialBLAST-alignments of the called sequence to the true consensus. It needs to be noted, however, that indels are more critical in the context of sequence assemblies, in which indels are more difficult to deal with than substitution errors and can cause severe frameshift errors.
Similar results were obtained for ABI-3700 chromatograms, for whichLifeTrace generated 29% fewer substitution errors but 13% more indels, with an overall decrease of errors of about 10%. We noticed, however, that the relative increase of basecall errors ofLifeTrace compared with that of Phred was largely confined to the end of the reads, that is, in low-quality regions. When the reads were clipped off at pixel position 6000, corresponding to a read length of about 500 nucleotides or about two–thirds of the original length, the error statistics are much more in favor of LifeTrace, with 6% fewer substitution errors, 20% fewer indels, and 13% fewer errors overall. Thus, althoughLifeTrace generated more errors in the low-quality terminal read segments, it produced significantly fewer errors in the higher quality parts. Many postprocessing steps include some sort of quality clipping, so the reduced number of errors in the higher quality parts is even more significant.
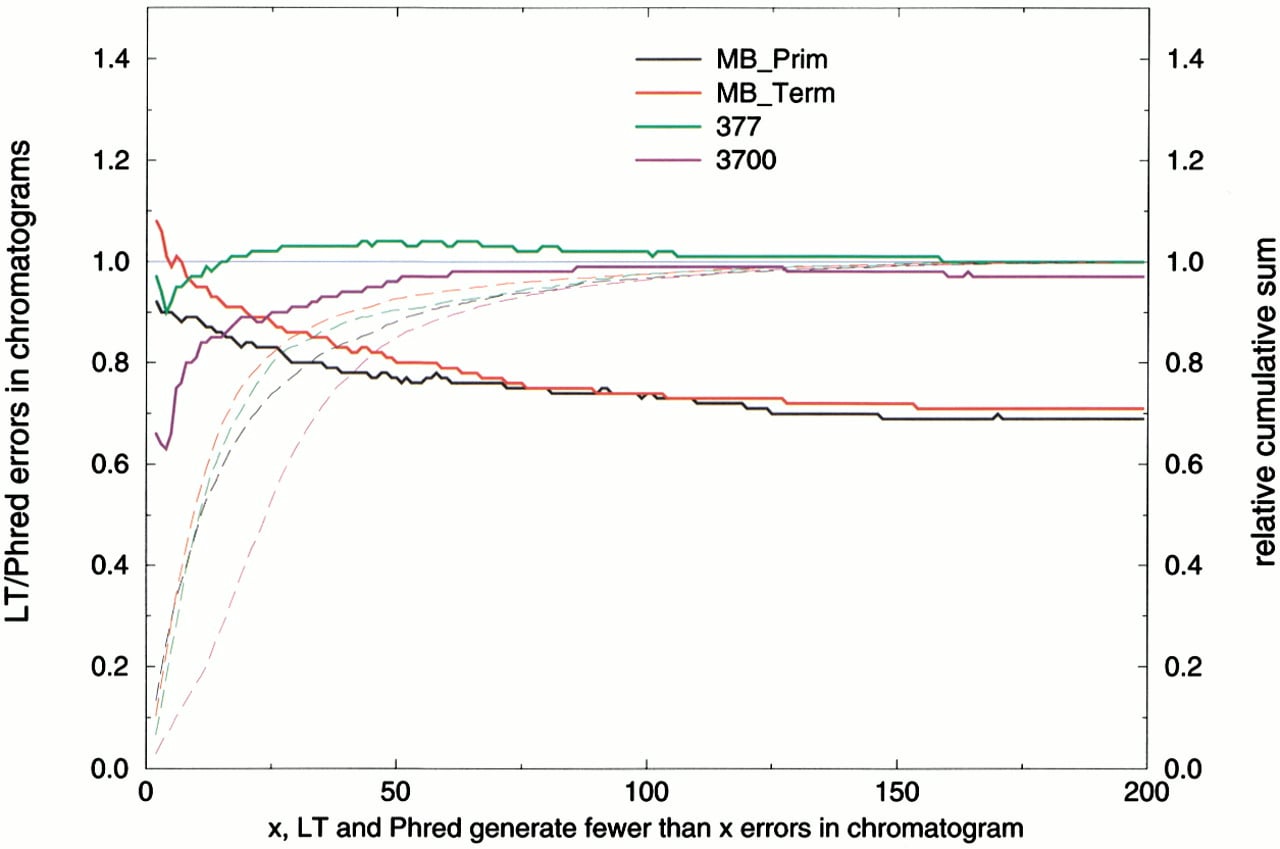
The substantial reduction of MegaBACE basecall errors achieved byLifeTrace is largely attributable to chromatograms, for which Phred introduces exceptionally many errors. Figure5 shows the LifeTrace error rate relative to Phred as a function of errors detected in the chromatogram by the larger error number of eitherPhred or LifeTrace. The improved performance of LifeTrace is more pronounced for chromatograms with many errors (>25). Again, this can be explained by the observed difficulties of Phred to adjust to variable peak spacing. Many of these chromatograms appear to have high quality, yetPhred inserts additional bases to maintain an uniform peak spacing (Fig. 1). However, LifeTrace also outperformsPhred in higher quality chromatograms, in which both basecallers generate few errors. Only for dye-terminator chromatograms with very few errors (<6 errors) does LifeTrace produce slightly more errors (∼5%). However, this subset of chromatograms includes only ∼20% of all chromatograms analyzed, as can be seen from the cumulative chromatogram counts in Figure 5. The comparison ofLifeTrace to Phred is nearly flat for ABI-377 data, suggesting that both basecallers perform uniformly over all chromatogram quality ranges. Contrary to MegaBACE data, there appears to be a performance gain from LifeTrace in higher quality chromatograms from the ABI-3700. LifeTrace is observed to cause fewer errors in chromatograms, in which bothLifeTrace and Phred make relatively few errors. This is in line with the reduced error rates for clipped ABI-3700 chromatograms described above.
Comparison of LifeTrace error rate to Phrederror rate in subsets of chromatograms grouped according to quality of the chromatogram. Quality is expressed as the maximum allowed number of basecall errors made by either LifeTrace orPhred, that is, max(LifeTrace_errors,Phred_errors). For example, chromatograms for which bothLifeTrace and Phred generate fewer than five basecall errors can be considered high-quality chromatograms. As the graph shows, LifeTrace outperforms Phred in a set of chromatograms for which Phred generates many errors but LifeTrace makes few. Error rates are normalized by the number of Phred errors (i.e., Phred is the horizontal line at relative error rate 1). Broken lines correspond to the cumulative sum of the number of chromatograms normalized by the total number of chromatograms in the set at a given error threshold with the color code matching the legend colors.
Quality Scores
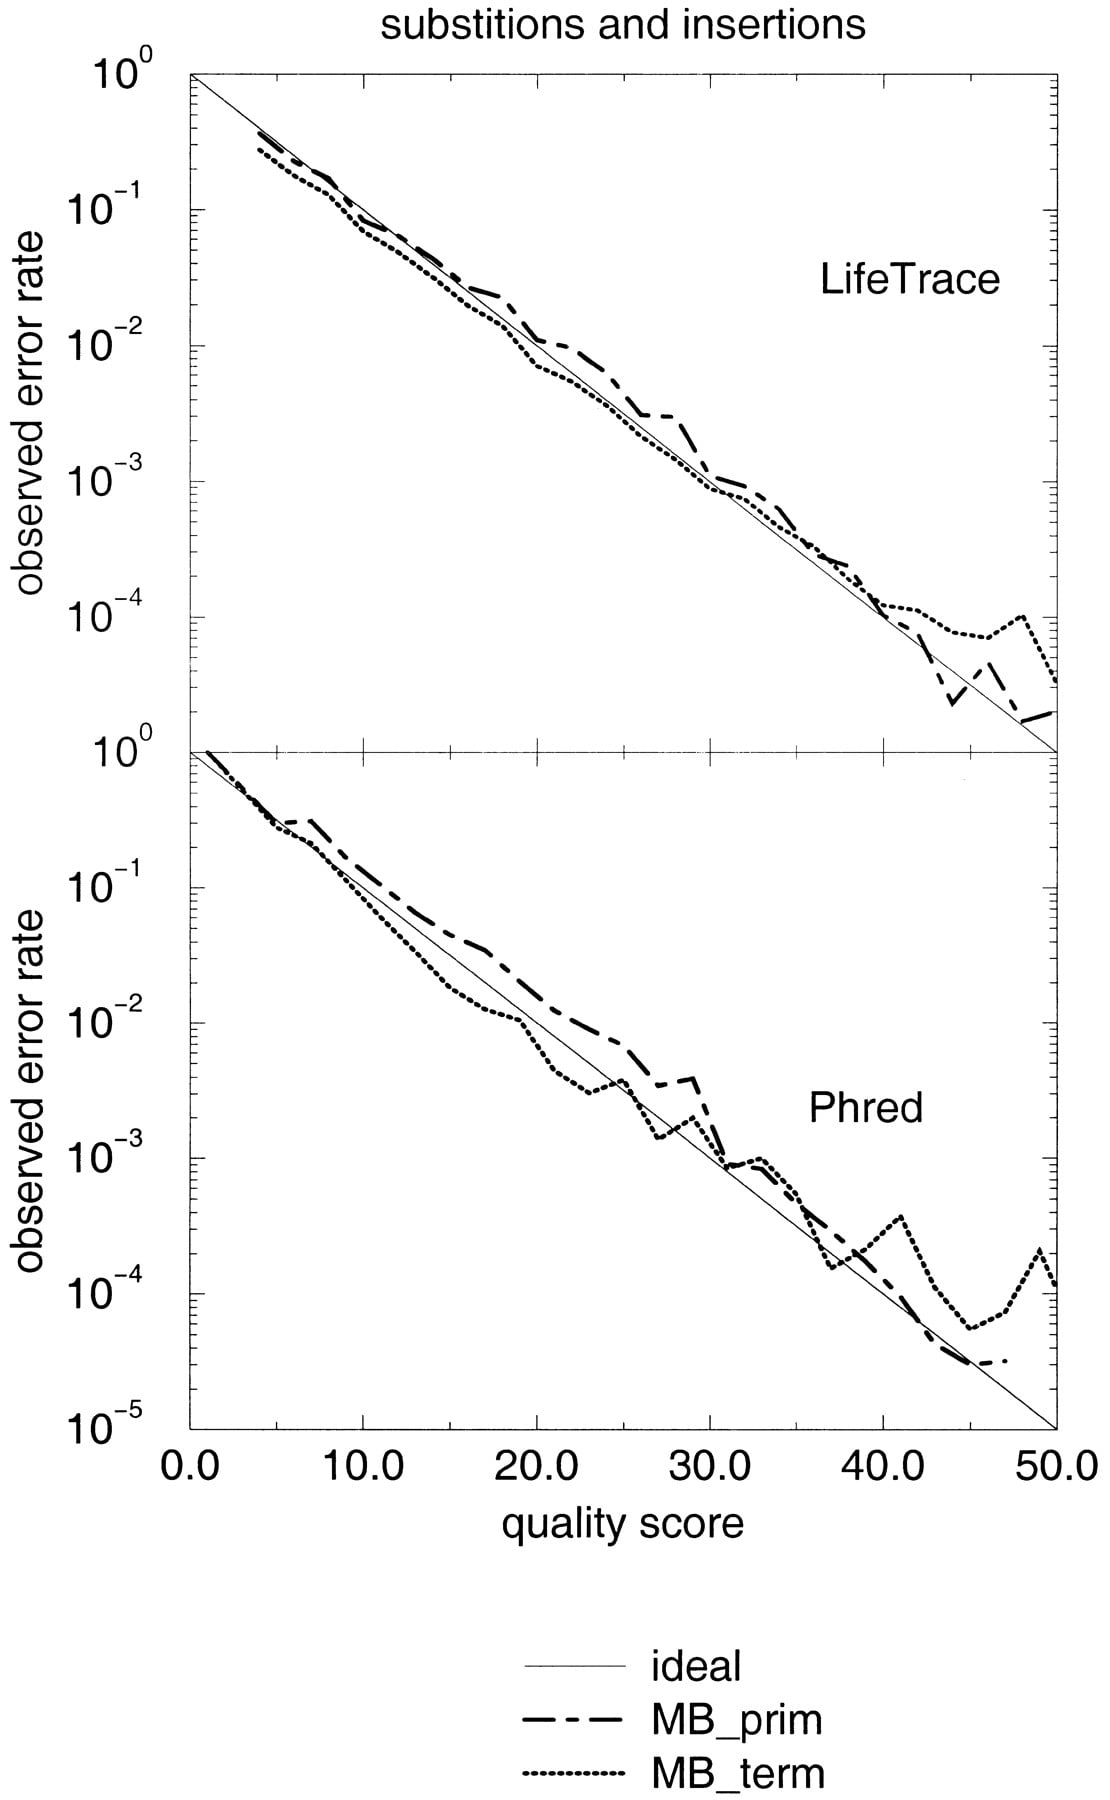
LifeTrace distinguishes between two quality scores: the quality of an actual basecall and the quality of the gap between bases. As the trace-related parameters influencing the LifeTracequality scores generated raw quality scores that showed a monotonic relationship with the true observed error rate, it was possible to calibrate both the basecall quality score and the gap quality score to the convention introduced by Phred, in whichq = −10 × log10 (error rate). The calibrated quality scores assigned to the called bases are compared with the observed error rate in Figure 6. For both sets, primer and terminator, the LifeTrace quality scores prove to be reliable predictors of the expected error rate and fall within a narrow range from the ideal line; similar to that forPhred, albeit the spread between the two sets is somewhat wider. It has to be noted, however, that Phred quality scores estimate the probability of all three error types: substitutions, insertions, and deletions. Deletion errors were not considered in Figure 6, neither for LifeTrace nor forPhred. A deleted base cannot have an associated quality score. The approach we take here is to introduce the gap-quality score, whereas Phred propagates low-quality gaps (wide gaps, or gaps with potential peaks in between) to quality scores of the neighboring basecalls.
Fidelity of LifeTrace and Phred quality scores. Quality scores associated with all basecalls aligned to the true sequence were binned into intervals of width Δ(q-score) = 2. Semi-logarithmic plot shows observed error rate in each bin as a function of quality score associated with that bin for the dye-primer and dye-terminator MegaBACE chromatogram set analyzed. Only substitution and insertion errors are considered here as deletion errors are captured by the newly introduced gap-quality score (see Fig.3), and a deleted base itself does not have a quality as it does not exist. Ideal refers to the ideal line of.
An objective of basecalling by means of assigning quality scores is to reliably separate high-quality bases from potentially incorrect basecalls. Figure 7 plots the frequency histogram for the quality scores associated with basecall errors compared with the distribution of quality scores for all calls forLifeTrace and Phred. As desired, basecall errors accumulate in low-quality regions and are well separated from the majority of basecalls. Although the overall distribution is similar for LifeTrace and Phred, the histogram forPhred is much more rugged. We believe that this is an effect introduced by the lookup-table approach taken byPhred to match trace parameters with quality scores/observed error rates. Instead, LifeTrace uses continuous parameters to judge quality, and therefore, the curves appear smoother.
Discriminative power of quality scores and retention of high-quality base calls. Frequency distribution of quality scores associated with substitution and insertion errors and all basecalls for basecallersLifeTrace and Phred for the chromatogram sets examined. Frequencies are computed for calls binned into width intervals of two units of quality scores.
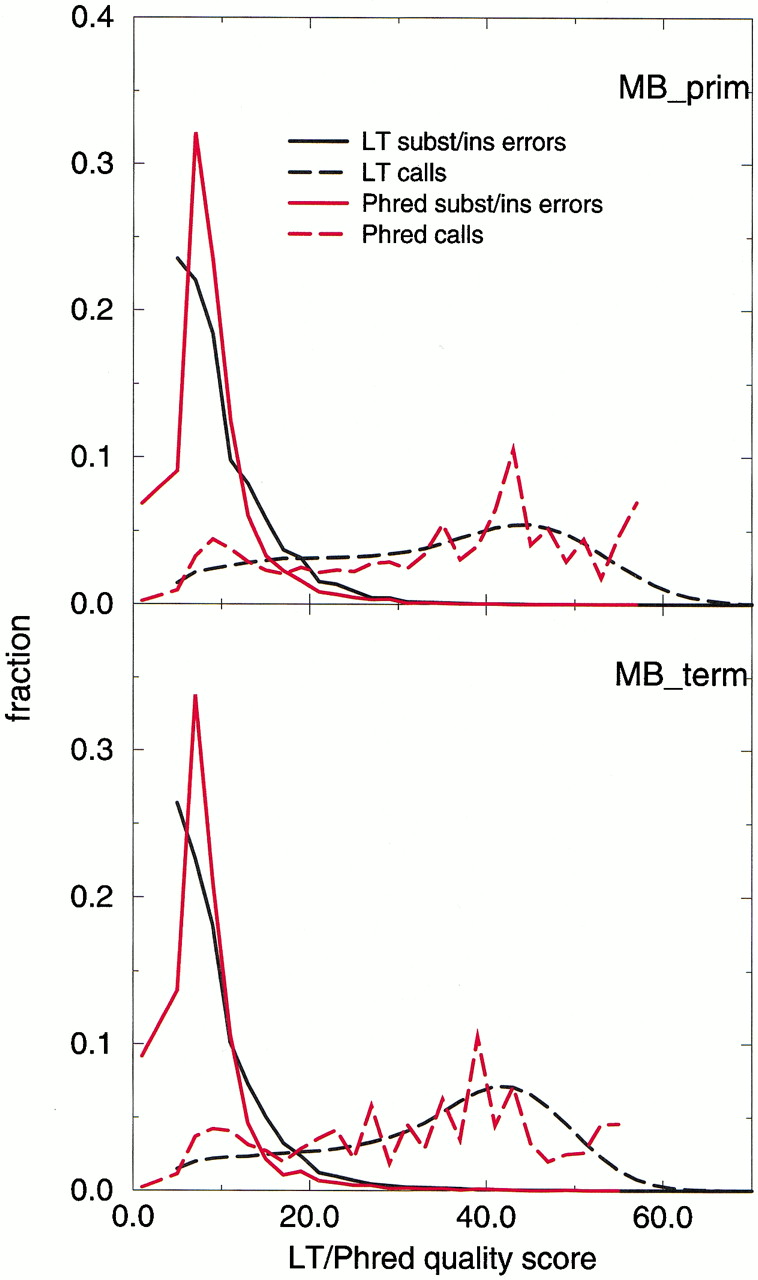
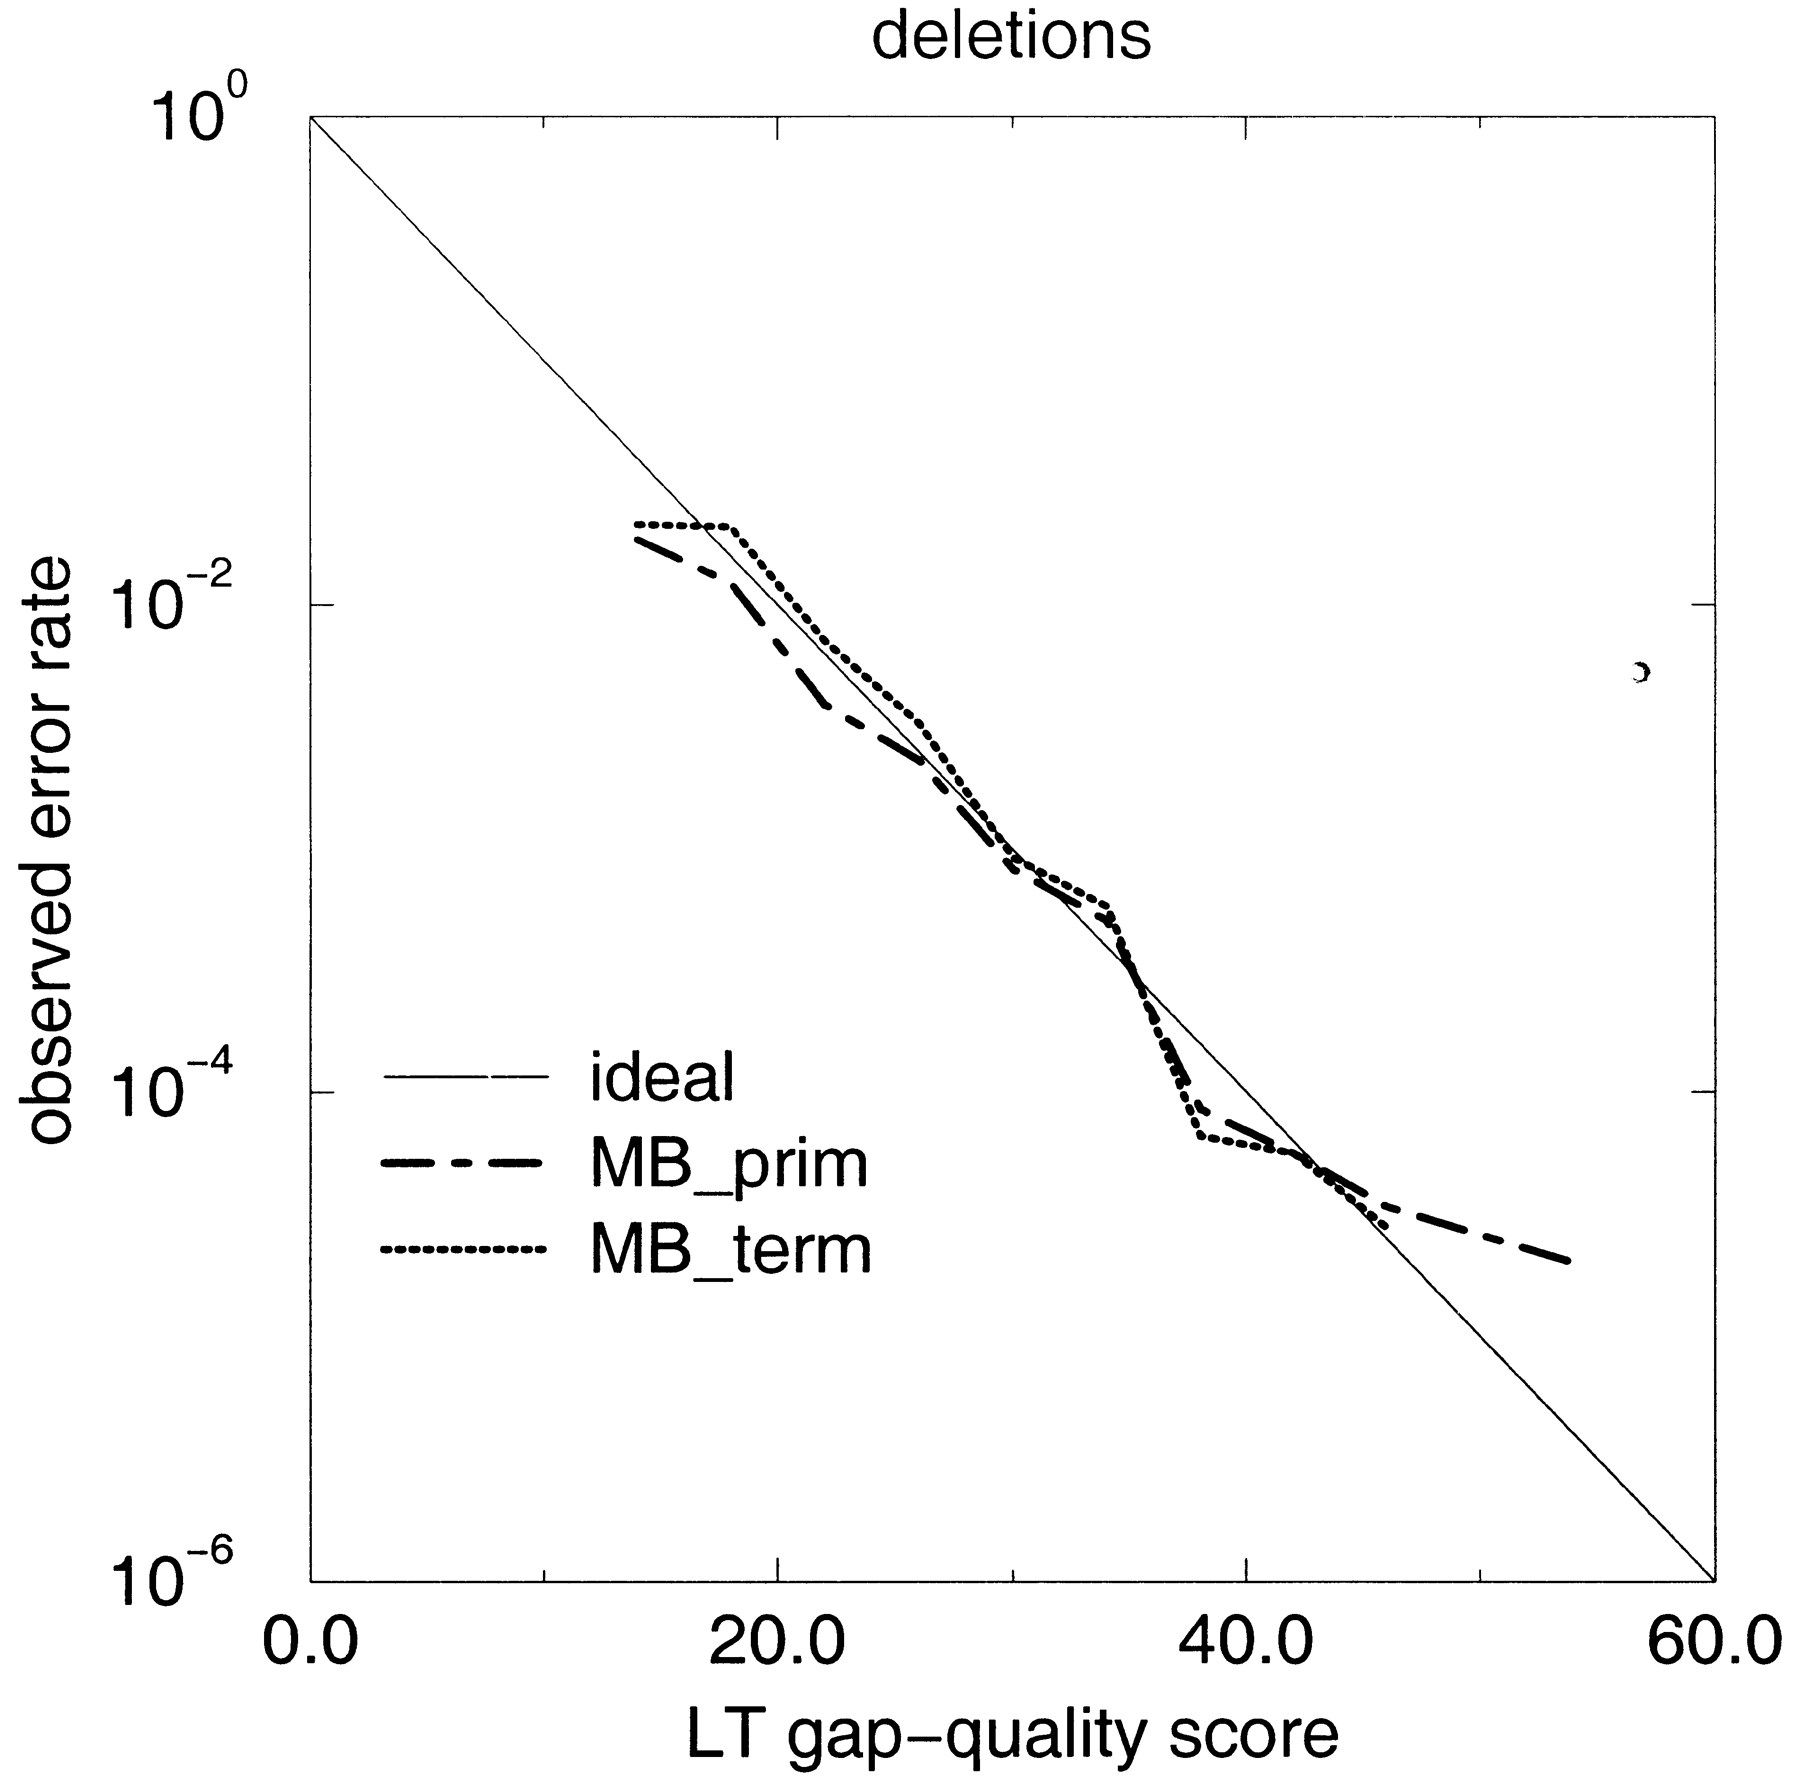
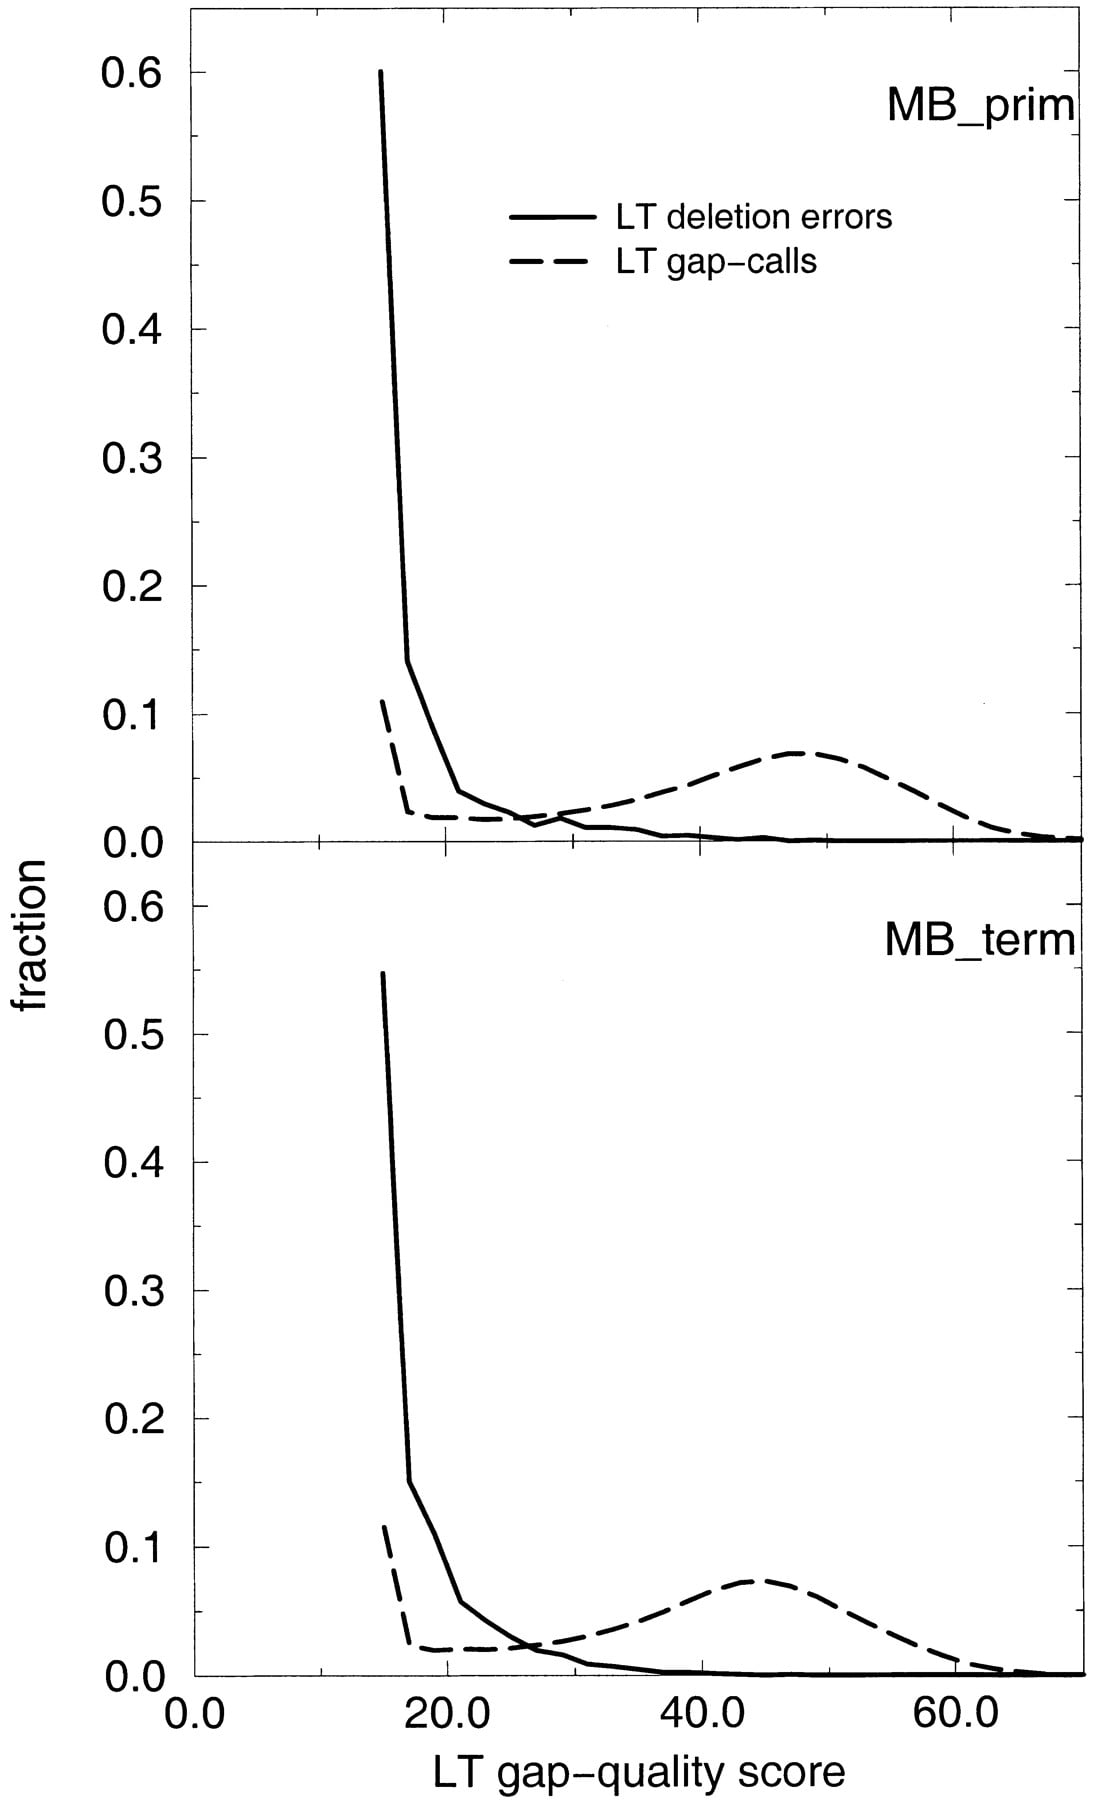
Figure 8 shows that the assigned gap-quality scores have predictive value and correctly estimate the observed error rate. Deletion errors are confined to low–gap-quality gap-calls, well separated from the bulk of higher quality data (Fig.9). Figures 8 and 9, showing data for deletion errors, are the equivalent plots to Figures 6 and 7 for the substitution/insertion error category. In the current implementation, the lowest possible gap-quality score is 15, because of a single particular threshold in one of the components contributing to the gap-quality. As many gap-calls actually fall below that, counts at gap-qualty equal to 15 are elevated.
Fidelity of LifeTrace gap-quality scores. Semi-logarithmic plot of observed frequency of deletion errors as a function of assigned gap-quality score of the preceding base in the alignment for the MegaBACE chromatogram sets (primer and terminator) analyzed. The gap-quality score of the base preceding the gap captures the quality of the gap to the next called base, that is, low gap-qualities indicate a high probability that another base might be between this and the next called base indicating a high likelihood of a deletion error. InLifeTrace, gaps are considered a call. Observed error rate indicates the fraction of incorrect gaps (missed true basecall in between) out of all called gaps; ideal line, the same as in Figure 8. Bin width was 4 quality units.
Discriminative power of LifeTrace gap-quality scores. Frequency distribution of quality scores associated with deletion errors (gap-quality assigned to the gap-preceding basecall) and all gap calls for basecaller LifeTrace for the chromatogram sets examined. Frequencies are computed for calls binned into width intervals of 2 units of quality scores.
Summary
We present a new basecalling method implemented in the programLifeTrace. We showed that it performs particularly well with capillary sequencing machines (MegaBACE), with substantially reduced basecall errors compared with those of Phred. Furthermore, we introduce the concept of a gap-quality score, which allows a better estimation of deletion errors.
It remains to be noted that the accuracy of basecalling is also influenced to large degree by the preprocessing applied to the chromatograms, and changes in the preprocessing steps will result in different comparison results.
Other technical parameters (e.g., the chosen read length or sampling rate per peak) systematically influence the quality of the recorded chromatogram and render chromatogram sets different, even if produced on the same machine type. Despite our efforts to compute quality scores directly from the primary trace data alone, such systematic differences between sets will have to be accounted for by a calibration of quality scores.
The alignment method introduced in this paper—aligning sequences to a consensus sequence using quality score information as part of the scoring scheme—should prove useful in SNP detection efforts, especially for the detection of deletion and insertion SNPs in runs of the same base. By better being able to identify basecall errors by locating a mismatch or deletion to low-quality regions of the chromatogram, it will be possible to identify real base deletions with greater confidence. LifeTrace is already being used at Incyte to mine SNPs from sequence assemblies, especially insertion and deletion SNPs.
Apart from possibly necessary quality score calibrations, we think thatLifeTrace can find immediate use in high-throughput sequencing operations. With its philosophy of solely relying on the presented trace data as input and without the need to correct for machine-dependent mobility information, implementation ofLifeTrace should be straightforward.
Processing Time
The processing time required by LifeTrace is comparable to that of Phred. On the computer systems used for testing, LifeTrace required about 25% less processing time for ABI-377 chromatograms but about 50% more time for MegaBACE data, and the time per chromatogram was in range of 0.1 to 0.2 sec on a DEC-Alpha workstation.
The Code
LifeTrace was written in C. It provides a graphical interface to display chromatogram trace data based on the standard X11 library and should run on any UNIX Xwindow system.
Availability
Precompiled versions of LifeTrace for various computer platforms, including more detailed descriptions of the algorithm and associated parameters, are available athttp://www.incyte.com/software/home.jsp.
We thank Eryk Vershen (Incyte Genomics, Inc.) for making hisC-routines for reading binary chromatogram files available to us. Helpful discussions with our Incyte colleagues Eldar Giladi, Wayne Volkmuth, and Michael Walker are gratefully acknowledged. We are very grateful to the Washington University, Saint Louis, Genome Sequencing Center for providing a large data set of 3700-chromatograms for testing. We also thank Brent Ewing from the University of Washington, Seattle, for performing additional benchmark tests that led to algorithmic improvements. We like to thank the anonymous referees for their careful review of the manuscript and many helpful comments.
The publication costs of this article were defrayed in part by payment of page charges. This article must therefore be hereby marked “advertisement” in accordance with 18 USC section 1734 solely to indicate this fact.
Notes
[2] Corresponding author.
Notes
[3] E-MAIL [email protected]; FAX (650) 855-0572.
[4] Article and publication are at www.genome.org/cgi/doi/10.1101/gr.177901.
REFERENCES
- ↵S.F. AltschulW. GishW. MillerE. MyersD.J. Lipman(1990) Basic local alignment search tool. J. Mol. Biol. 215:403–410.
- ↵D. AltshulerV.J. PollaraC.R. CowlesW.J. Van EttenJ. BaldwinL. LintonE.S. Lander(2000) An SNP map of the human genome generated by reduced representation shotgun sequencing. Nature. 407:513–516.
- ↵A.J. Berno(1996) A graph theoretic approach to the analysis of DNA sequencing data. Genome Res. 6:90–91.
- ↵K.H. BuetowM.N. EdmonsonA.B. Cassidy(1999) Reliable identification of large numbers of candidate SNPs from public EST data. Nat. Genet. 21:323–325.
- ↵B. EwingP. Green(1998) Base-calling of automated sequencer traces using Phred II: Error probabilities. Genome Res. 8:186–194.
- ↵B. EwingL. HillierM.C. WendlP. Green(1998) Base-calling of automated sequencer traces using Phred I: Accuracy assessment. Genome Res. 8:175–185.
- ↵M.C. GiddingsR.L. Brumley Jr.M. HakerL.M. Smith(1993) An adaptive, object oriented strategy for base calling in DNA sequence analysis. Nucleic Acids Res. 21:4530–4540.
- ↵M.C. GiddingsJ. SeverinM. WestphallJ. WuL.M. Smith(1998) A software system for data analysis in automated DNA sequencing. Genome Res. 8:644–665.
- ↵J.B. GoldenD. TorgersenC. Tibbetts(1993) Pattern recognition for automated DNA sequencing, I: On-line signal conditioning and feature extraction for basecalling. In:in Proceedings of the first International Conference on Intelligent Systems for Molecular Biology, ed L. Hunter(AAAI Press, Menlo Park, CA), pp 136–144.
- ↵C.B. LawrenceV.V. Solovyev(1994) Assignment of position-specific error probability to primary DNA sequence data. Nucl. Acid Res. 22:1272–1280.
- ↵S.B. NeedlemanC.D. Wunsch(1970) A general method applicable to the search for similarities in the amino acid sequence of two proteins. J. Mol. Biol. 48:443–453.
- ↵P. Richerich(1998) Estimation of errors in “raw” DNA sequences: A validation study. Genome Res. 8:251–259.