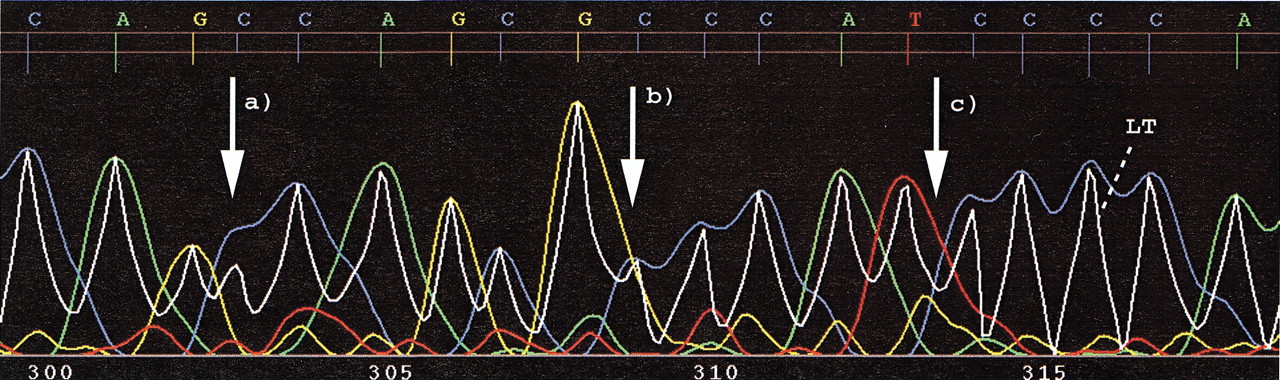
Illustration of the processing of chromatogram trace data byLifeTrace. Shown are the four original traces and the composite trace LT (Eq.{ label needed for disp-formula[@id='E4'] }) that provides the basis for peak detection. LifeTrace basecalls are given in the top row with the length of the tick lines that indicate the peak location corresponding to the LifeTrace quality score, with longer ticks indicating higher quality. The two horizontal lines mark quality score 0 and 15. Locations illustrate the facilitated peak detection provided by trace transformations of LifeTrace(transformed trace LT) making it possible to (a) reliably detect peaks that are peak shoulders and not local maxima, yet are real; (b) separate overlapping peaks; and (c) to reduce noise from residual traces as they are not reflected in local maxima in the trace LT.