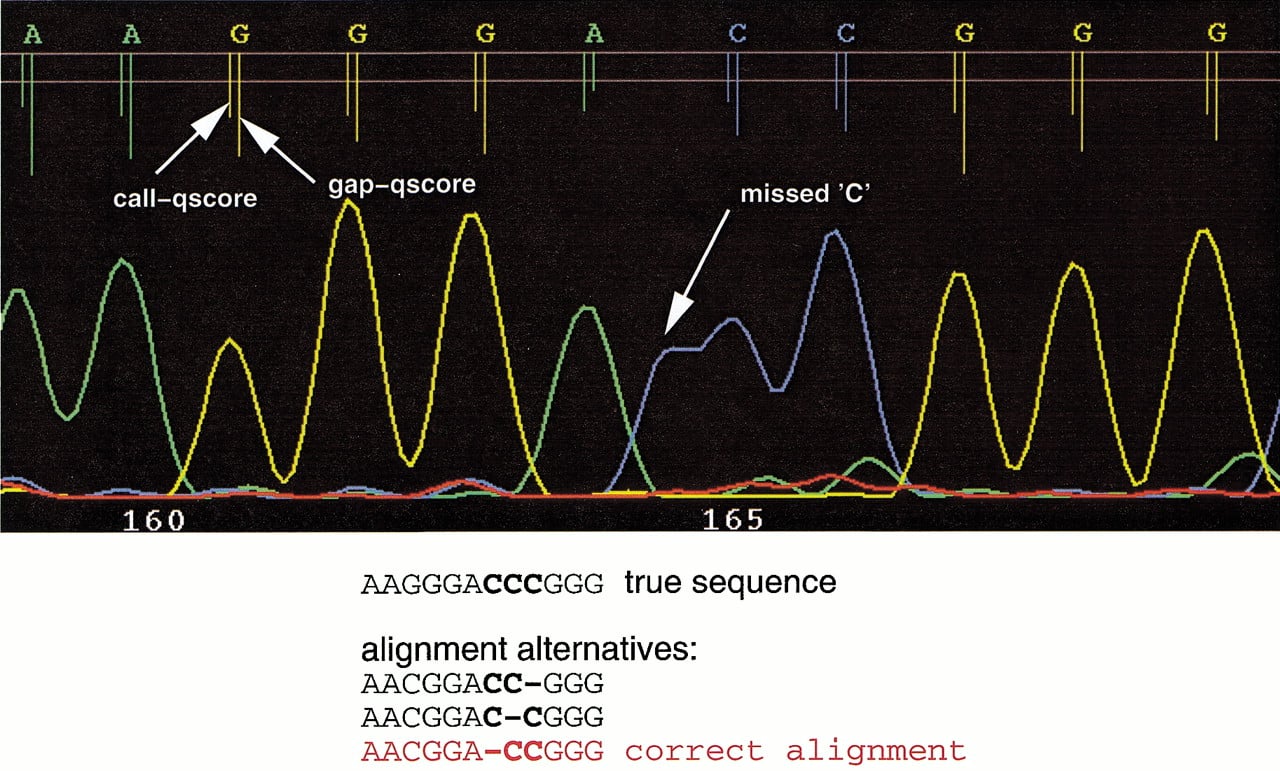
Illustration of the concept of a gap-quality introduced inLifeTrace. Part of a sample chromatogram shows traces and calls, with associated quality scores quantified by the length of the peak locator tick mark. Two horizontal lines mark quality score levels of 0 and 15. The left tick line represents the quality score of the actual base call, whereas the right tick line measures the quality of the gap to the following called base. In this example, a basecall error has occurred: a C was not called. This singleC-deletion can generate three different alignments of equal alignment score as shown below. However, the chromatogram suggests that the error has occurred in the first position of the three Crun. This is reflected in the low gap-quality score of the precedingA. By taking into account gap-quality scores during alignments, the gap is correctly positioned at the first position.