Abstract
A hallmark of heart disease is gene dysregulation and reactivation of fetal gene programs. Reactivation of these fetal programs has compensatory effects during heart failure, depending on the type and stage of the underlying cardiomyopathy. Thousands of putative cardiac gene regulatory elements have been identified that may control these programs, but their functions are largely unknown. Here, we profile genome-wide changes to gene expression and chromatin structure in cardiomyocytes derived from human pluripotent stem cells. We identify and characterize a gene regulatory element essential for regulating MYH6 expression, which encodes human fetal myosin. Using chromatin conformation assays in combination with epigenome editing, we find that gene regulation is mediated by a direct interaction between MYH6 and the enhancer. We also find that enhancer activation alters cardiomyocyte response to the hypertrophy-inducing peptide endothelin-1. Enhancer activation prevents polyploidization as well as changes in calcium dynamics and metabolism following stress with endothelin-1. Collectively, these results identify regulatory mechanisms of cardiac gene programs that modulate cardiomyocyte maturation, affect cellular stress response, and could serve as potential therapeutic targets.
Cardiac development is driven by the temporal and spatial coordination of gene expression and cell signaling. Disruption of these pathways has been implicated in heart disease across all stages of life (May et al. 2012; Dirkx et al. 2013). Gene regulation is typically coordinated by distal cis-regulatory elements (CREs), which are also responsive to cellular stress (Sergeeva et al. 2016; Man et al. 2021). Thousands of candidate CREs (cCREs) have been identified in cardiac tissue through epigenomic profiling. CRE activity can also vary across heart chambers (Visel et al. 2007). Many of these cCREs function as enhancers: CREs distal to transcription start sites (TSSs) that regulate the cell type specificity of gene expression. However, few cCREs have been evaluated for their endogenous function, their target gene, or their roles in conditions of stress (May et al. 2012).
Many key developmental factors are dysregulated in cardiomyocytes (CMs) during heart failure and after injury (Talman and Kivelä 2018; Jiang et al. 2019; Man et al. 2021). Specific alterations are temporarily beneficial but eventually become maladaptive (Miyata et al. 2000; Wende et al. 2017). Others are cardioprotective, correlate with better patient outcomes, and are potential therapeutic targets (Goetze et al. 2020). One example of a dysregulated factor is MYH6. In humans, MYH6 has high expression during development and decreases with age to low levels by adulthood. The expression of its neighboring gene, MYH7, increases with age. MYH6 expression is silenced during heart failure, leading to slower contractions of the heart (Lowes et al. 1997; Nakao et al. 1997; Chen et al. 2021). MYH6 activation has been proposed as a potential treatment for dilated cardiomyopathy (DCM) and end-stage heart failure (Nakao et al. 1997; Locher et al. 2011). Overexpression of MYH6 improves contractile force generation in cultured primary CMs from failing human hearts (Herron et al. 2010; Locher et al. 2011). Mutations in MYH6 cause various forms of heart disease (Carniel et al. 2005; Posch et al. 2011). Knockdown of MYH6 in chick embryos resulted in atrial septal defects during heart development (Ching et al. 2005). Despite years of research investigating the consequences of MYH6 silencing and loss-of-function mutations, the regulation of MYH6 remains incompletely understood.
To better understand the function of noncoding gene regulation in CMs, we performed assay for transposase-accessible chromatin using sequencing (ATAC-seq) and RNA sequencing (RNA-seq) on human induced pluripotent stem cell–derived cardiomyocytes (iPSC-CMs) to nominate cCREs (Corces et al. 2017). We then linked key regulatory elements to MYH6 and MYH7. We characterize the effects of epigenetic editing of this regulatory element on cell function and the cellular stress response. Lastly, we identify genetic variants within this enhancer that are associated with cardiac disease. These findings support a novel mechanism of myosin gene regulation and implicate myosin expression in regulating the CM response to stress.
Results
WNT activation promotes immature phenotypes in cultured iPSC-CMs
To identify enhancers that regulate gene expression, we used a reproducible and inducible method to drive immature phenotypes in human iPSC-CMs by activating WNT signaling through chemical inhibition of GSK3 (GSK3i) (Mollova et al. 2013; Mills et al. 2019; Singh et al. 2019; Buikema et al. 2020). GSK3i promotes cell cycling, marked by DNA synthesis and mitosis; reduced cell ploidy; and sarcomere disassembly—all markers of CM immaturity (Mollova et al. 2013; Mills et al. 2019; Singh et al. 2019; Buikema et al. 2020).
CHIR99021 (CHIR) is a potent GSK3 inhibitor (Mills et al. 2019; Singh et al. 2019; Buikema et al. 2020). We observed multiple physiologic changes in the CMs following culture with 2 µM or 4 µM CHIR (Supplemental Fig. S1A; Supplemental Table S1). Consistent with previous reports, following GSK3i, CMs began to disassemble sarcomeres and had a dose-dependent increase in cell cycle markers for DNA synthesis and mitosis (Supplemental Fig. S1B–D; Cavanagh et al. 2011; Mills et al. 2019; Singh et al. 2019; Buikema et al. 2020). DNA synthesis was indicated by 5-ethynyl-2′-deoxyuridine (EdU) incorporation, and phospho-histone H3 (pHH3) was used as a mitotic marker (Cavanagh et al. 2011; Singh et al. 2019). The frequency of EdU-positive iPSC-CMs increased with CHIR from 14.9% after 48 h of culture with EdU to 32.0% (2 µM) and 40.1% (4 µM) (Supplemental Fig. S1B,C). The fraction of pHH3-positive nuclei increased from 0.03% to 0.33% (2 µM) and 0.38% (4 µM) (Supplemental Fig. S1D; Mollova et al. 2013; Mills et al. 2019).
We also observed significant changes in genomic content and cell cycle distribution across all cells (Supplemental Fig. S1E–G). Measurement of total nuclear DNA content based on total DAPI intensity can be used as a proxy to characterize ploidy and associated stages of the cell cycle (Pereira et al. 2017). Cardiac cell ploidy increases with maturation (Mollova et al. 2013). We saw a significant reduction in 4N (G2) frequency and an increase in 2N (G1) frequency with GSK3i independent of EdU incorporation (Supplemental Fig. S1F,G). Examples of mononucleated and binucleated CMs were observed at all doses of CHIR. We concluded that our approach yields a reproducible model of CM immaturity, enabling the study of gene regulatory mechanisms.
Integrated analysis of ATAC-seq and RNA-seq identifies a putative cardiac enhancer
We performed ATAC-seq and RNA-seq on iPSC-CMs cultured with ±4 µM CHIR for 1 week. ATAC-seq measures chromatin accessibility as a marker for active or poised cCREs (Grandi et al. 2022). Combining this information with RNA-seq can identify accessible cCREs proximal to differentially expressed genes that respond to GKS3i. We observed reproducible signals across all replicates in the ATAC-seq and RNA-seq data (Supplemental Fig. S2A). In response to GSK3i, there were 976 and 851 ATAC-seq peaks with increased or decreased accessibility and 1023 and 1658 genes with increased or decreased expression (Padj < 0.01 and |log2(fold-change)| > 1) (Fig. 1A,B; Supplemental Fig. S2; Supplemental Table S2).
Integrated analysis of ATAC-seq and RNA-seq identifies a cardiac cCRE. (A,B) Significance (Padj) versus log2(FC) in chromatin accessibility (A) or gene expression (B). Differential analysis was performed using a paired two-tailed DESeq2 test. (C,D) Gene Ontology enrichment analysis for differentially expressed genes increasing (C) or decreasing (D) in expression. Select terms are displayed. (E) The top five unique TF motifs for repressed or activated ATAC peaks. (F,G) Visualization of RNA-seq (blue) and ATAC-seq (orange) results at the MYH6 locus (F) and cCREs (G). Highlighted are cCRE regions: R1 (red), R2 (green), and R3 (purple) and a previously characterized MYH7 enhancer C3 (blue). (H) RT-qPCR analysis of transcript abundance for cCRE RNAs and CMTM5 transcripts in iPSC-CMs ± GSK3i. Relative expression is plotted (normalized to control, n = 3 replicates, mean ± SD). Statistics were calculated on dCt values (normalized to TBP) using a one-way ANOVA with Sidak's post hoc test to compare gene expression. (**) Padj < 0.01. See Supplemental Figure S2 and Supplemental Table S2.
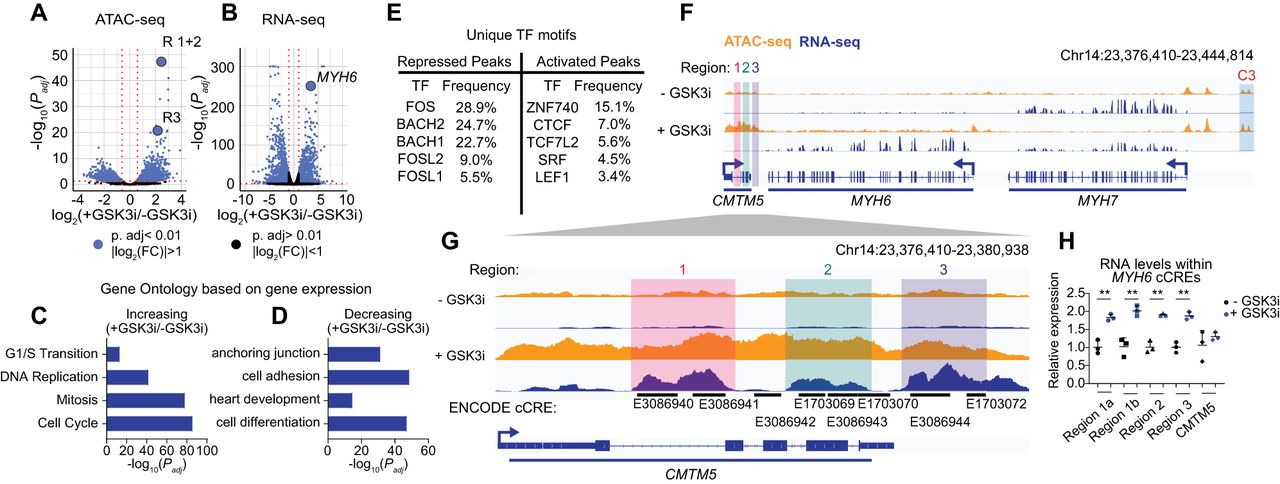
To further analyze the data, we performed Gene Ontology (GO) enrichment analysis on differentially expressed genes and transcription factor (TF) binding site motif analysis on differential ATAC-seq peaks (Bailey et al. 2015; Kolberg et al. 2023). GO terms associated with increased gene expression focused on proliferation, whereas those associated with decreased gene expression included factors related to maturation and cardiac function, validating the immature state driven by GSK3i (Fig. 1C,D; Supplemental Table S2). Next, we identified TFs that may drive the alterations in cCRE activity and gene expression. We identified TF binding motifs using the MEME suite tools and JASPAR TF binding profiles (Bailey et al. 2015; Fornes et al. 2020). To find high-confidence motifs within ATAC-seq peaks, we applied thresholds on statistical significance and TF expression level (FDR < 0.1; TF expression, TPM > 1) (Supplemental Fig. S2C,D; Supplemental Table S2; Bailey et al. 2015; Fornes et al. 2020). We found enrichment of AP-1 FOS and JUN family motifs, along with the Wnt inhibitors BACH1 and BACH2, only in ATAC-seq peaks that decreased in accessibility following GSK3i treatment (Fig. 1E). Recent reports have also implicated these factors in CM maturation (Zhang et al. 2023). Motifs for TCF/LEF-associated Wnt response factors were enriched in peaks increasing in accessibility (Fig. 1E). These factors are crucial for cardiac development and are expressed in immature CMs (Ye et al. 2019). CTCF binding motifs were enriched in peaks increasing in accessibility in response to GSK3i (Fig. 1E). CTCF helps determine the 3D chromatin conformation and prevent unintended interactions between distal enhancers and gene promoters (Cavalheiro et al. 2021). CTCF can also mediate enhancer–promoter interactions and drive gene expression beyond its canonical role as an insulator element (Kubo et al. 2021).
In response to GSK3i, we observed a shift in myosin expression from MYH7 (log2(FC) = −1.34, Padj = 0.0036) to MYH6 (log2(FC) = 3.41, Padj = 1.06 × 10−251), the fetal cardiac myosin isoform (Miyata et al. 2000). MYH6 was the third most significant upregulated gene with GSK3i. The most significant differentially accessible peak (Padj = 6.65 × 10−48) and the eighth-ranked differentially accessible peak (Padj = 1.94 × 10−48) are located downstream from MYH6 and MYH7 (Fig. 1F). We also found a previously characterized MYH7 enhancer, C3, increased in accessibility following GSK3i (Padj = 0.0007) (Gacita et al. 2021). There were multiple ENCODE cCREs within these peaks (Supplemental Fig. S3A,C; Dunham et al. 2012). We grouped the cCREs by the clustered RNA-seq signals, specifically R1 to R3 (Fig. 1G). We observed a significant increase in these RNAs in response to GSK3i, with no significant change in the levels of spliced protein-coding transcripts for CMTM5 (Fig. 1H). Transcription of noncoding regulatory elements is a marker of active enhancers and promotes enhancer–promoter interactions (Sartorelli and Lauberth 2020).
Epigenetic landscape surrounding a gene regulatory element in human and mouse samples
To understand the context in which these putative regulatory elements may be active, we analyzed multiple epigenetic data sets from human and mouse samples (Fig. 2; Supplemental Figs. S3–S7). We find that activity of the regions R1–R3 is highest across neural and heart tissue, based on H3K27ac (Supplemental Fig. S3A; Zhang et al. 2021). The high activity in neural tissue types is likely driven by the high expression of CMTM5 (Supplemental Fig. S3B). Single-cell ATAC-seq from atrial ventricular CMs shows similarities to our iPSC-CM ATAC-seq profiles (Fig. 2A; Hocker et al. 2021).
Epigenetic landscape surrounding of the MYH6 locus. (A) Visualization of cardiac data sets including CTCF-ChIP (green), ATAC-seq profiles from iPSC-CMs and single-cell ATAC-seq in human hearts (orange), RNA-seq profiles in iPSC-CMs (blue), histone ChIP-seq, and ReMap ChIP-seq. The cCREs are labeled as follows: M3 (gray), R3 (purple), and C3 (orange). (B,C) Summary of the epigenetic landscape across the MYH6 locus in human (B) and mouse (C) tissues. ChIP-seq is from cardiac samples. See also Supplemental Figures S3–S7.
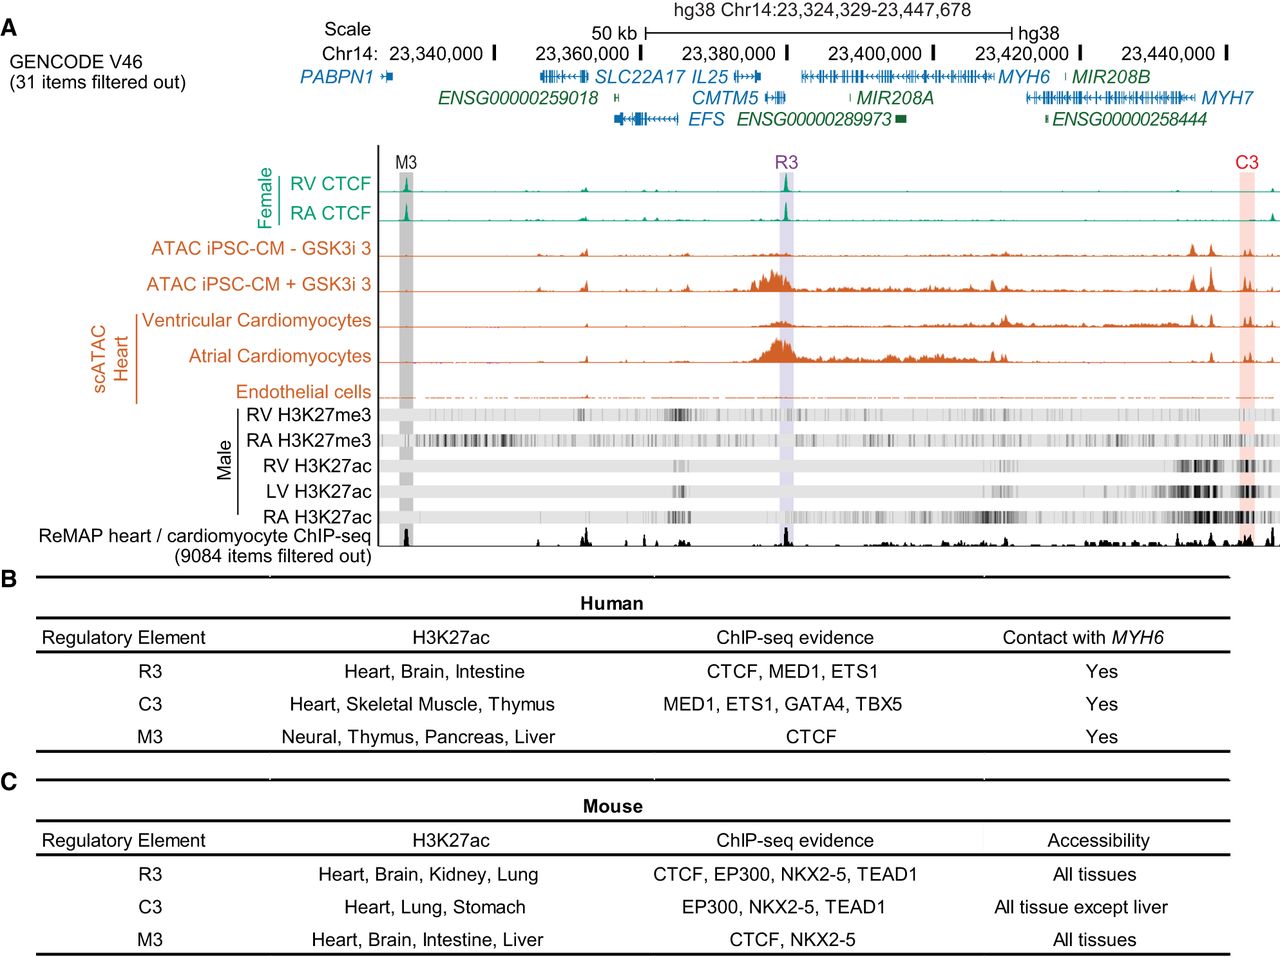
The genomic composition surrounding MYH6 and MYH7 is preserved between humans and mice (Fig. 2A; Supplemental Fig. S5A). We identified three noncoding regions (R1–R3, M3, and C3) that interact with MYH6 and likely influence MYH6 expression (Fig. 2A; Supplemental Fig. S7). CTCF binds or is proximal to the three identified elements, suggesting chromatin looping influences gene expression and varies across chambers (Fig. 2A; Supplemental Fig. S5A).
The three regions have unique TF binding motifs (Supplemental Figs. S4, S5). Across R3, C3, and M3, we find evidence of binding by TFs necessary for cardiac gene expression (TBX5, HEY2), cell homeostasis (TBX5, GATA4, and MED1), and cardiac development (EP300, TEAD1) (Ang et al. 2016; Ghosh 2020; Hammal et al. 2022). The human sequences of M3 and C3 possess TF motifs that we associated with maturation in our RNA-seq and ATAC-seq analysis (FOS, JUN, and BACH), whereas R3 lacks these motifs. This suggests that R3 may be more active during development or immature states when MYH6 expression is high, and M3 and C3 are more active in mature states in humans (Fig. 1; Supplemental Fig. S4). The histone and TF ChIP-seq and chromatin looping data suggest that R3, M3, and C3 likely function as enhancers and are active in the heart.
To further investigate the developmental role of these individual enhancers, we analyzed ATAC-seq and histone ChIP-seq data from the heart during mouse fetal development (e10.5 to e16.5) and after birth (P0 and P60) (Supplemental Fig. S6; Gorkin et al. 2020). In mice, C3 was most active in the fetal stages, R3 was most active at birth, and M3 was most active in adulthood (Zhang et al. 2021). These data suggest that these enhancers dynamically regulate myosin throughout development. There is also a seemingly divergent mechanism of myosin regulation across species, as C3 is important for human cardiac myosin expression in adulthood (Gacita et al. 2021).
CRISPR-mediated epigenetic editing of R3 modulates cellular response to disease-related stimuli
We next sought to link the activity of this region to the expression of its target gene. Epigenetic repression with dCas9KRAB (CRISPRi) or activation with VP64dCas9VP64 (CRISPRa) at regulatory elements can alter gene expression when delivered to the enhancer of a target gene (McCutcheon et al. 2023). We transduced iPSC-CMs with lentivirus-expressing dCas9KRAB and a gRNA targeting R1–R3 or a control gRNA with no target in the human genome. At 12 days following transduction, we found that only repression of R3 significantly decreased MYH6 expression compared with the control (49%) (Fig. 3B). Repression of the enhancers had no significant impact on MYH7 expression (Fig. 3C). A marker of CM maturation is a shift in expression from MYH6 to MYH7 (Gacita et al. 2021). Despite no change in MYH7 expression following enhancer repression, the MYH7/MYH6 ratio significantly shifted from 2.25 to 4.29 only when R3 was repressed. CMTM5 levels dropped to 60% and 73% of the controls when R2 and R3 were repressed, respectively (Fig. 3D,E). We observed a slower rate of spontaneous contraction following repression of R3 (for control, see Supplemental Movie S1; for R3 repression, see Supplemental Movie S2), as was previously reported following modulation of MYH7/MYH6 levels (Gacita et al. 2021).
R3 perturbation by CRISPR-based epigenome editing alters cellular response to stress stimuli. (A) Schematic of cCRE targeting using CRISPR epigenome editors. (B–E) RT-qPCR for MYH6 (B), MYH7 (C), MYH7/MYH6 (D), and CMTM5 (E) 12 days after repression of each cCRE. A one-way ANOVA with a Dunnett's post hoc test was used to compare gene expression. (F–K) RT-qPCR for MYH6 (F), MYH7 (G), NPPA (H), NPPB (I), TNNT2 (J), and ATP2A2 (K) 15 days following activation of each cCRE in human iPSC-CMs ±1 µM ET-1 for 72 h. A two-way ANOVA with Tukey's post hoc test was used to compare gene expression. (L–Q) RT-qPCR for Myh6 (L), Myh7 (M), Nppa (N), Nppb (O), Tnnt2 (P), and Atp2a2 (Q) 15 days following activation of each cCRE in HL-1 mouse atrial CMs ± norepinephrine and FBS for 48 h. A two-way ANOVA with a Tukey's post hoc test was used to compare gene expression. Relative expression is plotted (n = 3 replicates, mean ± SD). Statistics were calculated on dCt values (normalized to TBP). See also Supplemental Figure S8.
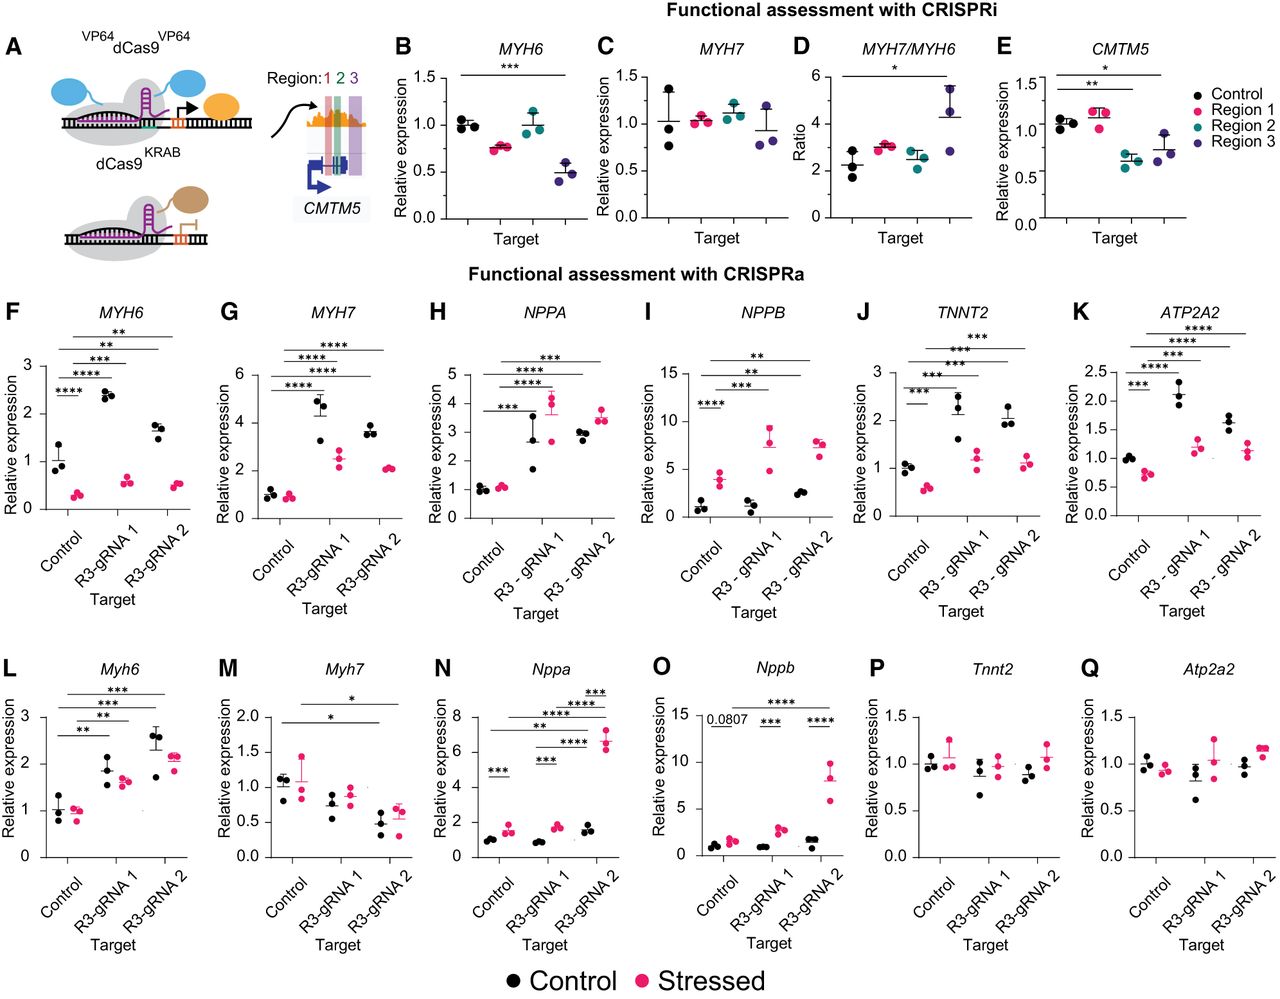
Next, we quantified the effects of enhancer activation in iPSC-CMs. MYH6 silencing is linked to decreased heart function during heart failure and under stress (Ching et al. 2005; Han et al. 2014; Chen et al. 2021). We chose endothelin 1 (ET-1) peptide treatment to model cardiac stress. ET-1 is a GPCR agonist and vasoconstrictor released by endothelial cells to drive cardiac hypertrophy (Dhaun et al. 2008; Mueller et al. 2011). ET-1 also represses MYH6 and reactivates fetal gene expression profiles associated with stress (Talman and Kivelä 2018; Jiang et al. 2019; Man et al. 2021). We transduced iPSC-CMs with a lentiviral vector encoding the activator VP64dCas9VP64 and a gRNA. Twelve days after transduction, we treated the cells with ±1 µM ET-1 for 72 h. Activation of R3 significantly increased expression of MYH6 and MYH7 compared with the control across culture conditions with two independent R3-targeting gRNAs (Fig. 3F,G).
NPPA and NPPB are essential factors during cardiac development and are markers of stress and pathologic hypertrophy (Goetze et al. 2020; Man et al. 2021). These two factors reactivate in response to stress (Sergeeva et al. 2016; Jiang et al. 2019). To understand how the shifts in MYH6/MYH7 expression affect these downstream markers, we also analyzed NPPA and NPPB expression. NPPA expression increased with myosin activation independently of culture conditions, whereas NPPB only increased to a greater degree with ET-1 (Fig. 3H; Jiang et al. 2019).
TNNT2 and ATP2A2 encode proteins that are crucial for cardiac function. Mutations in TNNT2, encoding the sarcomeric component cardiac troponin T2, can cause cardiomyopathies (Parbhudayal et al. 2020). ATP2A2, also known as SERCA2A, is vital for calcium handling in the heart, and its disruption contributes to cardiac dysfunction (Kumarswamy et al. 2012; Gilbert et al. 2020). ET-1 reduces ATP2A2 levels, resulting in decreased CM function and prolonged calcium signaling, similar to that observed in heart failure (Mueller et al. 2011; Uehara et al. 2012). Increased expression of TNNT2 and ATP2A2 occurs with increased myosin expression across culture conditions (Fig. 3J,K).
We next analyzed the conservation of R3 activity in the mouse HL-1 atrial CM cell line (Claycomb et al. 1998). FBS and norepinephrine were used instead of ET-1 so that the cells would maintain a differentiated phenotype but produce similar shifts in NPPA and NPPB expression (Supplemental Fig. S8C,D; Claycomb et al. 1998; Bloch et al. 2016). Enhancer activation increased expression of Myh6, Nppa, and Nppb, which are consistent with our results in human iPSC-CMs, whereas Myh7 expression decreased (Fig. 3L–O). This discrepancy may be related to underlying differences in biology between humans and mice that have evolved over time (Miyata et al. 2000; Gacita et al. 2021). We observed no changes in Tnnt2 or Atp2a2 expression following enhancer activation in HL-1 cells (Fig. 3P,Q; Claycomb et al. 1998).
In summary, R3 activity is important for myosin expression. R3 repression decreased MYH6 expression, whereas activation led to increased expression of MYH6 and MYH7. The increased expression of myosin through R3 activation activated other cardiac genes and an altered cellular response to stress.
Activation of R3 alters cellular composition and function in control and stressed states
Having linked R3 activity to myosin expression and the cellular stress response, we sought to quantify phenotypic effects driven by R3 activation via VP64dCas9VP64 (CRISPRa). ET-1 can increase cell size and influence cell electrophysiology (Uehara et al. 2012; Bourque et al. 2022). Cardiac polyploidization is linked to both physiological and disease-related cardiac hypertrophy (Brodsky et al. 1994; Gilsbach et al. 2018).
We measured changes in genomic content and cell size in human iPSC-CMs following R3 activation and stress (Fig. 4A). Cells were stained for TNNT2, DNA (DAPI), and F-actin. The exposure time during imaging for F-actin was reduced for images obtained under stressed culture conditions to prevent F-actin pixel saturation. Exposure times were maintained for TNNT2 and DAPI across conditions. Laser intensity was maintained across all images. We found that R3 activation significantly reduced the increase in genomic content that occurred following stress with ET-1 for 48 h (Padj = 0.0026) (Fig. 4B). Culture with ET-1 increased cell size (Supplemental Fig. S8A). R3-activated cells were larger when cell size was normalized by genomic content (Padj = 0.0254 under stress and Padj = 0.0891 under basal conditions) (Fig. 4C; Supplemental Fig. S8B). We assessed the relative abundance of MYH7 to MYH6 (a marker of iPSC-CM maturity) and found that R3 activation increased expression of both myosin isoforms and shifted the relative abundance toward MYH7 (Figs. 3F,G, 4D; Gacita et al. 2021). The absolute ratios measured here differ from those shown during the CRISPRi perturbations, as the cells in each experiment were in culture for a shorter period: 4 weeks postdifferentiation for CRISPRa experiments and 8 weeks for CRISPRi experiments. An extended duration of culture can significantly affect cell maturity and absolute myosin ratios; as such, all samples analyzed for a given experiment were harvested at the same time point posttreatment (Lundy et al. 2013). We also assessed the difference in cell size of HL-1 cells by flow cytometry under stressed conditions 3 weeks following enhancer activation (Supplemental Fig. S8C–E). We observed slight differences in the HL-1 cells, with a median cell size decrease of up to 16.3% by forward scatter following enhancer activation (Padj = 0.0714) (Fig. 4E).
Activation of R3 by VP64dCas9VP64 (CRISPRa) alters cellular composition and function in control and stress states. (A) Representative images of iPSC-CMs across conditions. (B,C) Analysis of genomic content by DAPI intensity (B) and normalized cell size (C) of human iPSC-CMs represented in A 20 days following activation of each target ± ET-1 (1 µM) for the last 48 h of culture; n = 3 replicates. Statistics were calculated with a two-way ANOVA with Fisher's LSD. (D) The ratio of MYH7 to MYH6 abundance was measured using the data from Figure 3, F and G. Statistics were calculated on dCt values (normalized to TBP), and a two-way ANOVA with a Tukey's post hoc test was used to compare ratios. (E) Relative cell size measured 21 days following cCRE activation in HL-1 mouse atrial CMs (n = 3 replicates, mean ± SD). A one-way ANOVA test with a Dunnett's post hoc test was used to compare cell size. (F) Representative confocal line scan and Cal-520 traces in iPSC-CMs. (G–K) Quantitative analysis of cells represented in F (n = 6 replicates across two differentiations). Statistics were calculated with a two-way ANOVA with a Fisher's LSD. Calcium measurements are as follows: calcium amplitude (F/F0; G), time to peak (H), tau (I), spark frequency (J), and calcium leak (K). (*) Padj < 0.05, (**) Padj < 0.01, (***) Padj < 0.001, (****) Padj < 0.0001. See also Supplemental Figure S8.
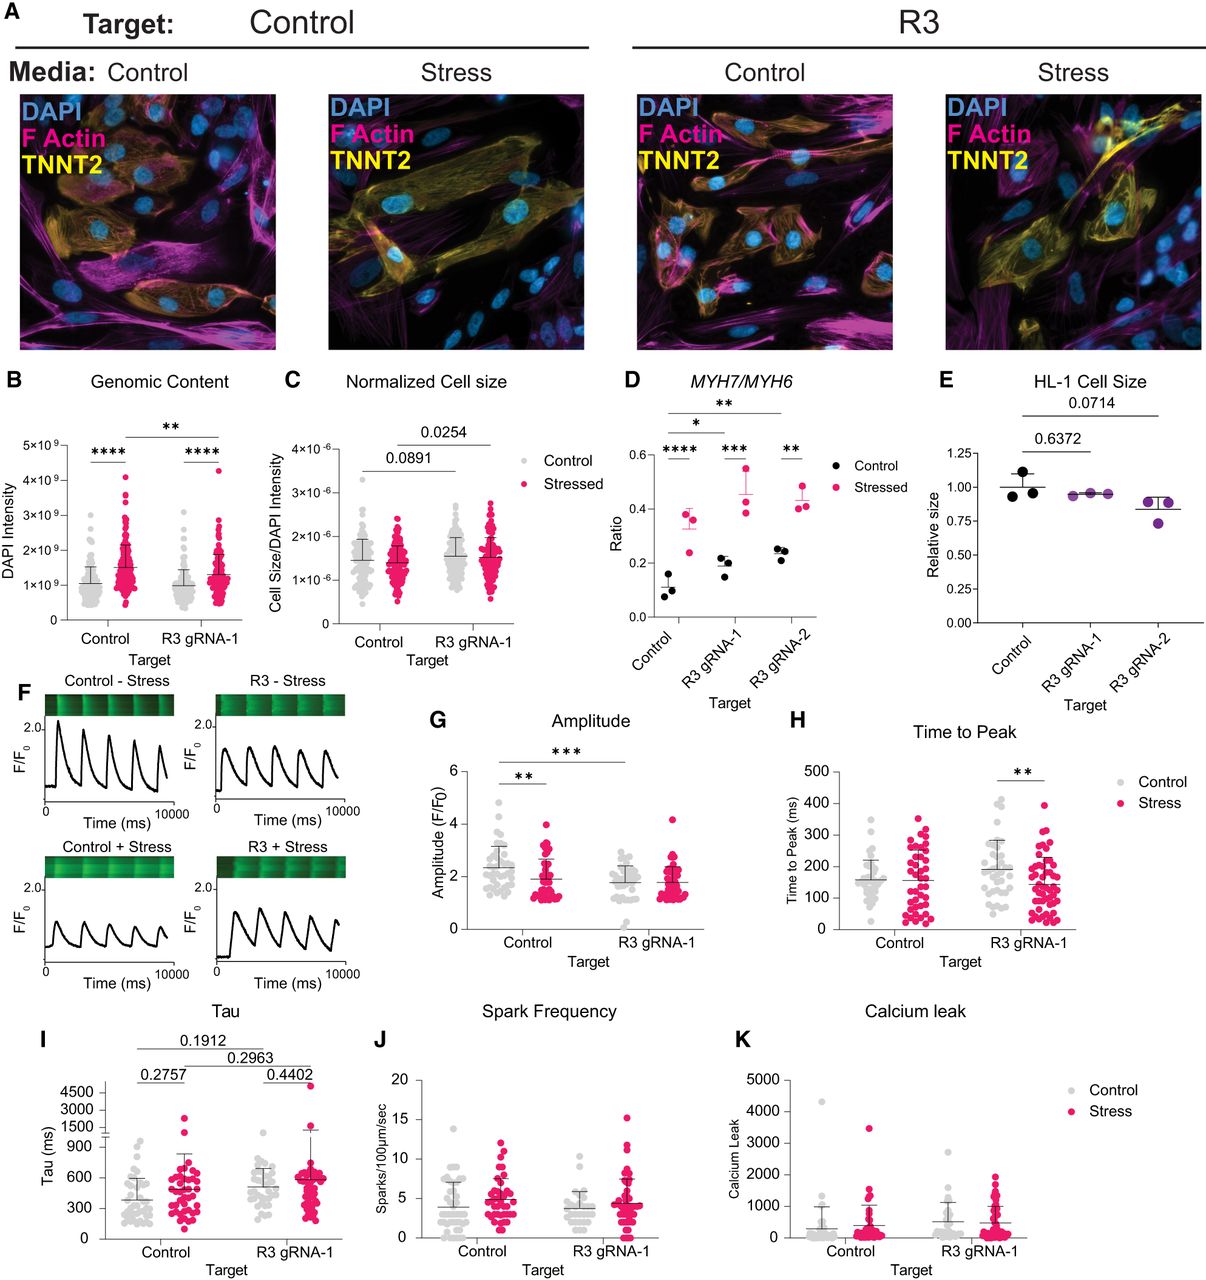
ET-1 has been shown to drive alterations in electrophysiology that precede the occurrence of heart failure in mouse models (Mueller et al. 2011). Therefore, we sought to measure electrophysiological differences between iPSC-CMs ± R3 activation across culture conditions. We measured intracellular Ca2+ dynamics in iPSC-CMs using the fluorescent dye Cal-520 (Fig. 4F; Daily et al. 2017). We found that the spontaneous Ca2+ transients (F/F0) in iPSC-CMs was reduced following R3 activation (Padj = 0.0004) (Fig. 4G). The amplitude (F/F0) decreased significantly following stress with ET-1 in cells with the control gRNA (Padj = 0.0057) but did not decrease for R3-activated cells following stress with ET-1 (Fig. 4G). The time to peak was shortened for R3-activated cells following stress (Padj = 0.0086) but remained unchanged for control cells. (Fig. 4H). We observed no statistical difference between the control and R3-activated cells across culture conditions for other measurements related to calcium dynamics (tau, spark frequency, or calcium leak) (Fig. 4I–K).
We also assessed metabolism in the iPSC-CMs by the mito stress seahorse assay of mitochondrial function (Vučković et al. 2022). Altered cardiac metabolism precedes other failure phenotypes (Locher et al. 2011; Wende et al. 2017; Goetze et al. 2020). We hypothesize that R3 activation may generate distinct metabolic profiles. We followed the same experimental time lines used during calcium signaling experiments with extended ET-1 (72 h). The media was changed 24 h after seeding transduced iPSC-CMs with media supplemented with 1 µM ET-1 for 72 h. We observed no cellular toxicity from ET-1 treatment in the absence of R3 perturbation, as evidenced by no significant changes in extracellular acidification rates (ECARs) and proton efflux rates (PERs). The oxygen consumption rate (OCR) was also not altered by ET-1 (Supplemental Fig. S9A–C; Supplemental Table S3).
Following R3 enhancer activation, ATP production and basal respiration increased, maximal respiration and spare capacity were unchanged, but relative spare capacity decreased (Supplemental Fig. S9D–H). Increased basal respiration and ATP production can mark CM maturation (Vučković et al. 2022). The change in metabolism owing to culture with ET-1 differed with R3 activation. Proton leak and nonmitochondrial oxygen consumption only decreased in activated cells with ET-1 (Supplemental Fig. S9I,J). Increased proton leak is often a marker of oxidative stress (Vučković et al. 2022).
In conclusion, R3 activation alters cellular response to stress, and activated cells are functionally distinct from control cells. R3 activation affects structural and metabolic physiology of the iPSC-CMs involved in maturation and the cellular stress response (Gacita et al. 2021; Vučković et al. 2022). R3 activation reduced the baseline amplitude of calcium dynamics and prevented the decline in amplitude following stress with ET-1 and altered rates of metabolism.
Activity of R3 alters chromatin looping surrounding MYH6 and MYH7
We hypothesized that epigenetic perturbation of R3 would alter chromatin conformation surrounding MYH6. We examined chromatin conformation by probe-enriched Hi-C of accessible regions (HiCARs) on treated iPSC-CMs and HL-1 cells (Supplemental Fig. S10; Wei et al. 2022). We found that R3 and C3 interact with the promoter of MYH6 (Fig. 5A,B; Supplemental Table S2). Activation of R3 alone did not drive significant changes in chromatin contacts (Fig. 5C), perhaps because the R3-mediated increase in MYH6 and MYH7 expression may involve driving more efficient expression through preexisting loops. CRISPRi repression of R3 significantly increased contact frequency between MYH6 and the M3 enhancer (Fig. 5D), concomitant with loss of MYH6 expression (Fig. 3B,C). This recapitulates the chromatin conformation observed in right ventricular cardiac tissue samples (Supplemental Fig. S7B).
R3 activity alters chromatin looping surrounding MYH6 and MYH7. (A,B) Contact frequency between the MYH6 TSS and R3 (A) or C3 (B), normalized to total contacts in the region, as represented in panels C–H. (C–H) Differential contact maps showing the impact of R3 activity on chromatin looping across culture conditions. Enhancer regions (R3, C3, M3) and the TSS for MYH6 and MYH7 are indicated along each axis. Differential analysis was performed using a DESeq2 test with Wald statistics. Significant contacts (Padj < 0.05) are marked with an asterisk. Heatmaps compare differential contact frequency between R3 activation and control (C) or R3 repression and control (D) in human iPSC-CMs under nonstressed conditions. (E–G) Panels display differential contact frequencies after 72 h of ET-1 exposure: without R3 activation (E), with R3 activation (F), and with R3/control under stressed conditions (G). (H) Heatmap comparing R3 activation and control in unstressed HL-1 mouse atrial CMs. Regions of interest discussed in the text are highlighted with a thick border. (I) Model of myosin regulation. R3 activity is crucial for the expression of MYH6. Varying R3 activity alters MYH6 chromatin contacts. See also Supplemental Figure S10 and Supplemental Table S4.
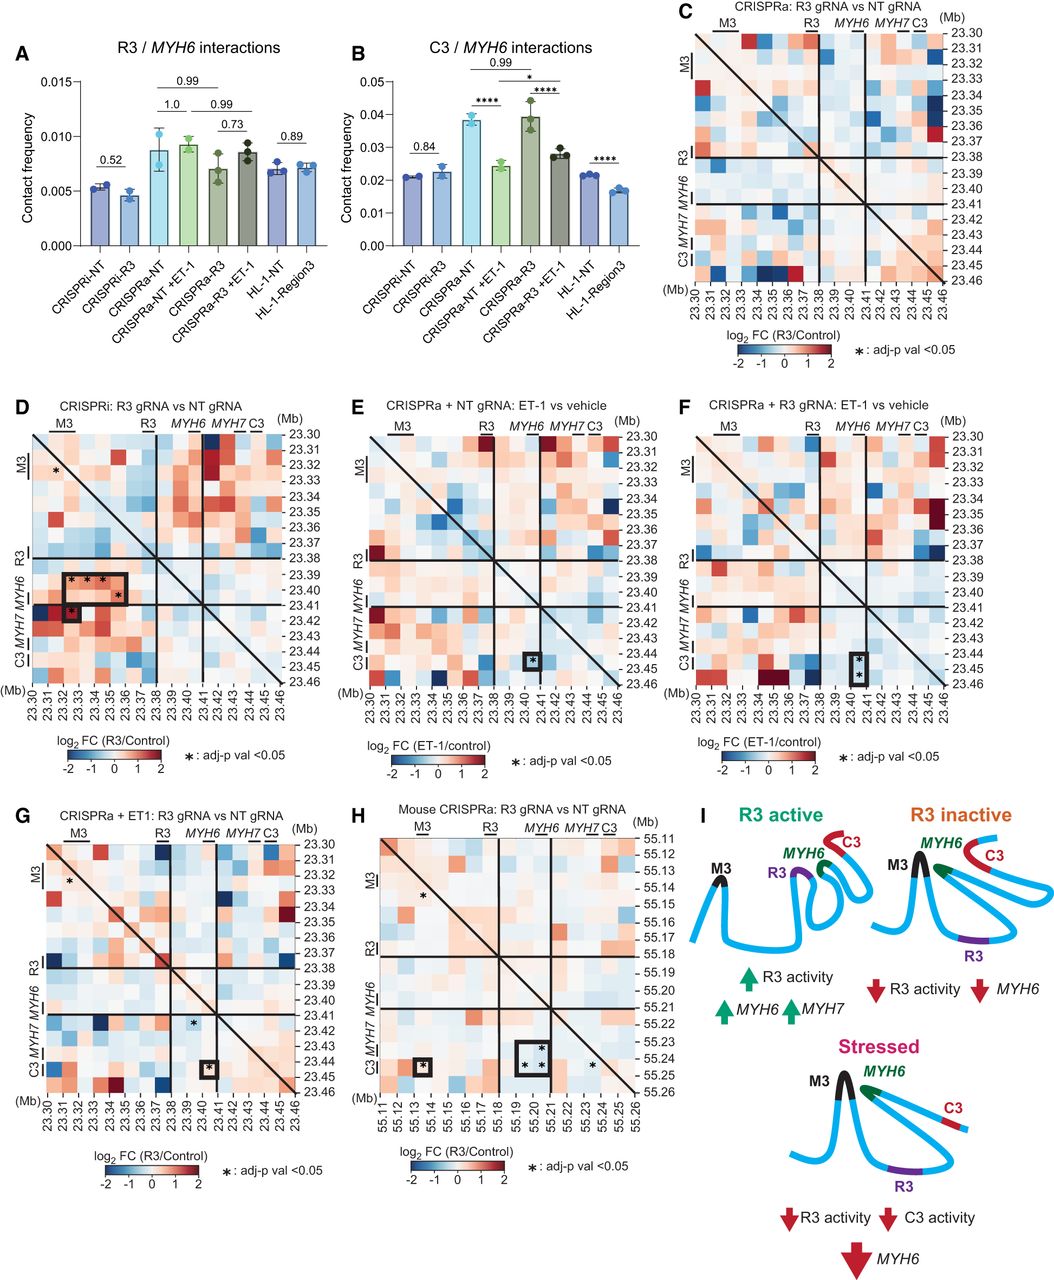
Stress induced by ET-1 significantly decreased MYH6 interactions with C3, regardless of R3 activity (P < 0.0001) (Fig. 5E,F). However, R3 activation significantly reduced the stress-induced loss of MYH6/C3 contact, with 23% higher contact (Padj = 0.023) (Fig. 5B,G). These results suggest that R3 activation directly opposes ET-1-mediated effects on MYH6/C3 looping and silencing of MYH6 (Figs. 3F, 5G). In HL-1 mouse CM cells, R3 activation resulted in decreased interactions between Myh6 and the C3 region (22% decrease, Padj < 0.0001) and increased M3/C3 interactions by 66% (Padj = 0.0152) (Fig. 5H). The divergent effect of R3 activation may contribute to the underlying differences in myosin expression between humans and mice (Miyata et al. 2000). Collectively, these results support a model in which R3 is coordinating myosin expression through pre-existing loops and competes with M3 for MYH6 promoter interactions in stressed conditions (Fig. 5I).
Analysis of genetic variants within the myosin enhancer
Genetic variants associated with heart disease are enriched within regulatory elements and cause disease phenotypes (Wang et al. 2016; Gilsbach et al. 2018). Causal variants can be lost below previously set thresholds in genome-wide association studies when correction is required for the large number of variants tested (Wang et al. 2016). Therefore, we analyzed genetic variation within this newly characterized enhancer region in humans utilizing participant whole-genome sequencing (WGS) data from the UK Biobank (Supplemental Table S5). We compared the frequency of variants across regions R1–R3, which may alter target gene regulation, in participants with cardiomyopathies (Schubach et al. 2024). Because R3 is crucial for MYH6 expression, we hypothesized that disruptive variants within R3 may occur more frequently in participants with cardiomyopathies than in controls.
We performed a Fisher's exact test to assess the frequency of variants within regions R1, R2, and R3 between participants with and without cardiomyopathy, excluding individuals with coronary artery disease (CAD) (Supplemental Table S5). We evaluated only variants within intronic and noncoding regions of R1–R3 and plotted −log10(Padj) (frequency) against the combined annotation-dependent depletion (CADD) score (a measure of variant deleteriousness) to identify variants more frequent in participants with cardiomyopathy that may have a higher pathogenic likelihood (Supplemental Fig. S11A; Schubach et al. 2024). We only found variants within R3 with a Padj < 0.05. Tolerance of the variant within corresponding TF binding motifs was determined (Supplemental Fig. S11B), with scores from “−1” (impaired binding) to “1” (improved binding). We identified an enriched rare heterozygous variant in the R3-CTCF binding motif with a reduced tolerance score (−0.618, Padj = 0.043) and a high CADD score (15.32), placing it in the top 10% of predicted deleterious variants (Schubach et al. 2024). Additionally, a rare homozygous variant disrupting the R3-E2F6 motif was enriched in cardiomyopathies (Padj = 0.022, CADD = 2.934), and a heterozygous variant disrupting ZNF460 and ZFX binding (Padj = 0.015, CADD = 10.97) was more frequent in controls.
Discussion
In this study, we performed epigenetic and transcriptomic analysis on iPSC-CMs under various states of maturation. We identified novel regulatory regions that function in CMs. We developed a more comprehensive model by which MYH6 and MYH7 are regulated, adding to previous work related to the C3 enhancer (Gacita et al. 2021). We found evidence of dynamic regulation of MYH6 in the heart, involving multiple CTCF-proximal regulatory elements (R3, C3, and M3). These elements vary in activity, accessibility, and looping across chambers of the heart and in response to cellular stimuli, including GSK3i and ET-1 (Figs. 2A, 5; Supplemental Figs. S2A, S6). R3 activity is important for MYH6 expression, with stronger markers of activity in atrial chambers where MYH6 expression is higher (Fig. 3A; Supplemental Fig. S3A; Locher et al. 2011; Gacita et al. 2021). As R3 activity declines, MYH6 loops to the distal M3 enhancer, and MYH6 expression declines (Figs. 4B, 3F, 5I).
This CTCF-mediated looping is representative of a common model of developmentally regulated gene expression (Cavalheiro et al. 2021; Kubo et al. 2021). Previous studies have found that as cells mature, enhancers bound by CTCF in early developmental stages become repressed, and genes begin to loop to distal enhancers, altering gene expression (Cavalheiro et al. 2021; Kubo et al. 2021). This phenomenon occurs within the Myh6 locus during mouse development (Supplemental Fig. S6). Our results suggest that these CTCF-bound enhancers are crucial for both development and the stress response (Figs. 1E, 5I). The orchestrated change in looping results in finely tuned expression of MYH6.
We observed divergence in R3 function across the human and mouse models, related to chromatin looping and myosin expression (Figs. 3G,M, 5C,H). The temporal expression of myosin diverges between humans and mice despite the conserved structure and orientation of the MYH6/MYH7 locus (Fig. 2A; Supplemental Fig. S3A; Miyata et al. 2000; Gacita et al. 2021). We have identified several distinct epigenetic differences that may contribute to this divergence. First, we find that C3 is active in adulthood for humans but during fetal development for mice (Fig. 2A; Supplemental Fig. S6A,D). Second, M3 becomes accessible and active in mouse cells during adulthood, whereas we do not observe these changes in either human hearts or iPSC-CMs (Fig. 2A; Supplemental Fig. S6A,C). Finally, across the three enhancers, TF binding motifs differ between humans and mice. The combination of these factors likely contributes to evolutionary differences in myosin expression. The immature nature of the in vitro CM models used in this study may not recapitulate all aspects of the evolutionary divergence between humans and mice (Lundy et al. 2013). Studies using mature in vivo or ex vivo CMs may provide additional insights into this phenomenon.
The differences in chamber-specific looping of the MYH6 locus were recapitulated by perturbing R3 (Fig. 5D; Supplemental Fig. S7A,B). This supports a model in which CTCF-bound R3 activity orchestrates MYH6 interactions and expression. R3 enhancer activation maintains local interactions with the MYH6 TSS. As R3 activity declines, the distal MYH6/M3 interaction increases, reducing MYH6 expression. As iPSC-CMs respond to stress, MYH6/C3 interactions also decline (Fig. 5I). Forced reactivation of R3 prevents this dissociation, and cells maintain higher levels of MYH6.
Lastly, we identified cardiomyopathy-associated genetic variants within R3 (Supplemental Fig. S11A). This underscores the impact of genetic variation on complex human traits. Allelic imbalance of disease-related genes has been observed in patients with hypertrophic cardiomyopathy (HCM) and is proposed as a potential driving mechanism of this disease (Montag et al. 2017). Further study of the genetic variants within R3 could help build upon this model. MYH6 dysregulation influences heart disease progression, and MYH6 reactivation has proven beneficial in countering heart disease phenotypes (Ching et al. 2005; Herron et al. 2010; Locher et al. 2011; Han et al. 2014; Chen et al. 2021). This work provides an endogenous target that may be therapeutically beneficial for modulating MYH6 expression. MYH6 gene therapies would be challenging owing to the large size of the cDNA and the packaging limit of cardiac-tropic gene therapy vectors such as AAV. Activating the endogenous MYH6 through CRISPRa or other therapeutic modalities may be an appealing alternative (Yang et al. 2016). In vivo MYH6 activation would be an exciting area of future research, and our work defines a set of potential targets, experimental readouts, and anticipated outcomes for such studies.
This study demonstrates the value of combining epigenome editing with chromatin conformation assays to functionally characterize regulatory elements and link them to their gene targets. We identified a key enhancer essential for maintaining myosin expression. This work also shows that the endogenous activation of myosin expression has pleiotropic effects in normal and stressed states. The epigenetic and transcriptomic profilings, combined with functional data, highlight key enhancers crucial for the cardiac stress response.
Methods
Plasmids
For CRISPRa experiments, we used the all-in-one lentiviral vector pLV hU6-gRNA hUbc-VP64-dSpCas9-VP64-T2a-Blast, generated from Addgene (https://www.addgene.org) plasmid 66707. For CRISPRi experiments, the all-in-one lentiviral vector pLV hU6-gRNA hUbc-dSpCas9-KRAB-T2a-Puro was used (Addgene 71236). The gRNAs were cloned into their designated vector following the Esp3I (NEB) plasmid digestion using T4 ligation methods (NEB) (Supplemental Table S6).
Cell lines
HEK293T cells were cultured as previously described (McCutcheon et al. 2023). HL-1 cells were maintained on 0.02% gelatin (EMD Millipore) and 5 µg/mL fibronectin-coated plates, using Claycomb basal medium supplemented with 10% FBS, 0.1 mM norepinephrine (Sigma-Aldrich), 2 mM L-glutamine (EMD Millipore), and 100 U/mL penicillin–streptomycin (Claycomb et al. 1998). The human WTC11 iPSC cell line (UCSFi001-A) was maintained on Matrigel-treated (Corning) dishes in mTesR+ (Stemcell Tech).
iPSC to CM differentiation
The CM differentiation protocol was adapted from a previously established small-molecule protocol and published on protocols.io (protocol integer ID: 110344) (Lian et al. 2013; Anglen et al. 2024a). WTC11 cells were differentiated first by pushing toward a mesoderm lineage by Wnt activation. The cells were then pushed toward a cardiac progenitor state through Wnt inhibition. Insulin is then added to promote maturation. Removal of glucose from the media at the end of differentiation enriches the CM population and promotes maturation.
Immunofluorescence staining and imaging
iPSC-CMs were seeded into Matrigel-coated wells (Ibidi 80826). After seeding and cell treatment, cells were fixed in 4% PFA (VWR) in PBS for 15 min and washed three times in PBS containing 0.1% Triton-X 100 (PBST; Sigma-Aldrich). Cells were blocked and permeabilized in blocking solution containing PBST, 0.2 M glycine, and 2.5% FBS for 1 h. Primary antibodies against proteins of interest were applied for 1 h. The following primary antibodies were used: mouse anti-α-actinin (1:500; Sigma-Aldrich) and rabbit anti-pHH3 (1:800; Cell Signaling Technology). Cells were washed in PBST and then treated with secondary antibodies and DAPI (Thermo Fisher Scientific) for 50 min. The following secondary antibodies were used: Alexa Fluor 488 goat antirabbit and Alexa Fluor 647 donkey antimouse (Thermo Fisher Scientific) (Supplemental Table S6). Finally, cells were washed in PBST and mounted with Vectashield antifade mounting medium (VWR).
Analysis of iPSC-CM proliferation and genomic content
To assess the proliferative index and genomic content of iPSC-CMs, cells were differentiated as described above and grown for 1 week. Cells were cultured for an additional week ± 4 µM CHIR. During the final 48 h, cells were exposed to 10 µM EdU (Supplemental Fig. S1A). Following treatment, cells were seeded for immunofluorescent imaging, fixed in 4% PFA the following day, and processed using the Click-iT plus EdU kit with Alexa Fluor 555 (Invitrogen, Thermo Fisher Scientific). Cells were then stained for pHH3 and α-actinin.
Cells were imaged using a Zeiss AxioObserver7 inverted microscope with a Zeiss Axiocam 305 color camera. Images were processed and analyzed using a combination of CellProfiler pipelines and R scripts (Stirling et al. 2021; R Core Team 2023). The assistance of ChatGPT was utilized to generate the R script for analyzing proliferation and cell cycle stage. CellProfiler was used to identify nuclei and measure the intensity of DAPI, EdU, and pHH3. R scripts were used for data wrangling, and GraphPad Prism was used for visualization and statistical analysis (Supplemental Table S1; Supplemental Fig. S1C–E; R Core Team 2023). EdU and pHH3 staining marked proliferation, whereas DAPI intensity was used to assess genomic content and cell cycle stage. Cell cycle distribution was determined by genomic content across all cells (Supplemental Fig. S1). This method has been used quantify proliferation and cell cycle arrest (Pereira et al. 2017).
ATAC sequencing
Nuclei preparation and sequencing analysis were based on methods previously developed, and our methods were published to protocols.io (protocol integer ID: 110364) (Corces et al. 2017; Anglen et al. 2024b). ATAC sequencing libraries were sequenced on an Illumina NextSeq 2000 with paired-end 50 bp reads. Adapter sequences were trimmed, and reads were filtered by quality score using Trimmomatic (v0.32) (Supplemental Table S6; Bolger et al. 2014). Trimmed reads were aligned to hg38 using Bowtie (v1.2.3) (Langmead et al. 2009), allowing up to 2000 bp fragments (-X 2000), discarding multimapping reads (-m 1), and reporting best alignments (‐‐best ‐‐strata). Duplicate reads and ENCODE blacklisted regions were removed using Picard MarkDuplicates and BEDTools (v2.19.1) (Quinlan and Hall 2010). ATAC-seq peaks were called using the MACS2 (v2.1.1) callpeak function (Zhang et al. 2008). For visualization, deepTools bamCoverage was used to generate bigWig files with counts per million (CPMs) from deduplicated BAM files (Ramírez et al. 2014). Sample quality was assessed based on the number of uniquely mapped reads after blacklist removal. A union peak set was generated from the MACS2 narrowPeak files of all samples. Count files for each sample were generated using featureCounts (Supplemental Table S2; Liao et al. 2014). Differential accessibility within the union set of ATAC-seq peaks was determined using DESeq2 (Fig. 2A; Supplemental Table S2; Love et al. 2014). ATAC-seq profiles surrounding the MYH6 locus (Fig. 1F,G) were visualized in the Integrative Genomics Viewer (IGV) (Robinson et al. 2011). The identification of TF binding motifs in differentially accessible regions was performed using the MEME suite (v5.5.7) (Supplemental Table S2; Bailey et al. 2015). All differential peaks with a Padj < 0.05 were considered for this analysis. Motifs with a Q-value (FDR) < 0.1 and a TPM for the corresponding TF > 1 based on our RNA-seq results were considered as potential TF binding sites and included in the analysis for Figures 1 and 2. Three rounds of analysis were conducted. First, motif discovery using the MEME suite was performed on all differentially accessible peaks (Padj < 0.05) to identify general trends and TFs associated with peaks showing decreased accessibility, increased accessibility, and focused analysis on R3 (Supplemental Table S2). These results, combined with genetic variants identified in participants from the UK Biobank, were used to assess the potential role of region R3 in cardiac health and disease. The findings are presented in Figure 2 and Supplemental Figure S11 (Supplemental Table S2). The assistance of ChatGPT was utilized to generate the R script for analyzing data generated using MEME Suite.
RNA sequencing
Total RNA was extracted from iPSC-CMs using the Norgen total RNA purification plus kit and sequenced by Azenta with standard RNA sequencing and rRNA depletion. Adapter sequences were trimmed, and reads were filtered by quality score using Trimmomatic (Bolger et al. 2014). Trimmed reads were aligned to hg38 using STAR (v2.4.1a) (Dobin et al. 2013). RPKM-normalized bedGraph files were generated using deepTools bamCoverage. The UCSC bedGraphToBigWig utility was used to convert bedGraph files to bigWig format for genome browser visualization. Gene read counts were created using subread featureCounts (v1.4.6-p4) (Supplemental Table S2; Liao et al. 2014). Differential expression analysis was performed using DESeq2, in which counts are fit to a negative binomial general linearized model (GLM), and the Wald test is used to determine the significance of differentially expressed genes (Fig 2B; Supplemental Table S2; Love et al. 2014). Visualization of RNA-seq profiles surrounding the MYH6 locus (Fig. 1F,G) was made in IGV (Robinson et al. 2011). Expression levels of TFs unique to differentially accessible regions of the genome are shown in Supplemental Figure S4B.
GO analysis using g:Profiler
GO analysis was performed with g:Profiler and g:GOSt (v e11_eg58_p18_f463989d) on differentially expressed genes above a threshold for significance (Padj < 0.01) and fold-change in expression (|log2(FC)| > 1) (Kolberg et al. 2023). Separate analysis was performed based on the direction of change. All available annotation databases were used to assess pathway enrichment in differentially expressed genes: GO, KEG pathways, Reactome, CORUM, and others. Selected terms were presented in Figure 1, C and D, and a complete list of the results can be found in Supplemental Table S2.
Generation of UCSC Genome Browser tracks
All browser track visualizations were made using the UCSC Genome Browser for Figure 2 and Supplemental Figure S3 (Nassar et al. 2023). The accessions for the data used to generate Figure 2 and Supplemental Figures S3–S6 can be found in Supplemental Table S6 (He et al. 2011; Dunham et al. 2012; Akerberg et al. 2019; Gorkin et al. 2020; Zhou et al. 2023). Mouse TEAD1 and NKX2-5 TF ChIP-seq data were downloaded from the NCBI Gene Expression Omnibus (GEO; https://www.ncbi.nlm.nih.gov/geo/) under accession number GSE124008 (Akerberg et al. 2019). Mouse EP300 ChIP-seq data were downloaded from GEO under accession number GSE195905 (Zhou et al. 2023). HL-1 cell TF ChIP-seq data were downloaded from GEO under accession number GSE21529 (He et al. 2011). All samples were reprocessed using the ENCODE ChIP-seq pipeline with default settings for TF ChIP-seq; all TF ChIP-seq data sets from this data set were processed. Apart from EP300, only data sets with at least 20 million filtered reads at >70% of reads mapping to mm10 were visualized. All visualized ChIP-seq data sets had NSC > 1.05 and RSC > 0.8. When visualizing ChIP-seq data, fold-change bigWig files were used; if multiple replicates were available, pooled reads from across all replicates were used for the bigWig files. Human cell type–specific ATAC-seq signals from single-nucleus ATAC-seq data were taken from the Cardiac Atlas of Regulatory Elements (CARE) portal (Hocker et al. 2021). TF motifs displayed in the JASPAR2022 tracks are those for cardiac and other TFs with motifs occurring more than expected by chance in the differential ATAC-seq motif analysis described above (Fornes et al. 2020). Regions R3 and M3 were defined as the 2 kb region centered on the CTCF ChIP-seq signal from heart samples. Region C3 was previously defined (Gacita et al. 2021).
Visualization of publicly available Hi-C data from the 3DIV database
Visualization of 3D chromatin conformation centered on the MYH6 promoter and R1–R3 was generated using the 3DIV database (Yang et al. 2018). This database has analyzed about 400 publicly available Hi-C and promoter capture Hi-C data sets, including tissue samples from the left and right ventricles. Comparative interaction visualizations between the left and right ventricles used either the MYH6 promoter or R1–R3 as the bait region. Regions in red indicate higher contact frequency in the left ventricle, and regions in blue indicate higher contact frequency in the right ventricle (Supplemental Fig. S7).
Lentiviral production, delivery, and antibiotic selection
Lentiviral production was performed in HEK293T cells using Lipofectamine 3000 (Invitrogen), following previously described methods (McCutcheon et al. 2023). The lentiviral supernatant was harvested 24 and 48 h after transfection and centrifuged at 600g for 10 min to clear debris. The virus was then concentrated 100-fold using LentiX concentrator (Takara Bio). iPSC-CMs and HL-1 cells were transduced at a multiplicity of infection (MOI) of approximately 0.3. Transduced cells were selected 48 h posttransduction using puromycin (Thermo Fisher Scientific) at 1 µg/mL for 4 days and blasticidin (Thermo Fisher Scientific) at 2.5 µg/mL.
Enhancer activity via RT-qPCR analysis
Cells were differentiated as described above and were left in culture for a minimum of 2 weeks before use. All samples being compared were transduced or harvested simultaneously. The maturation and relative expression of key factors in iPSC-CMs can change over time, and with these considerations, data from samples collected at different relative time points should not be compared (Lundy et al. 2013). For the CRISPRi experiments, cells were transduced 6 weeks after the completion of differentiation. For all experiments involving CRISPRa, cells were transduced 2 weeks after completing differentiation. The iPSC-CMs were then transduced with lentiviral vectors expressing either dCas9KRAB or VP64dCas9VP64 along with the designated gRNA. After transduction, cells were enriched via antibiotic selection and grown for 15 days posttransduction. When used, ET-1 (Sigma-Aldrich) was added at a final concentration of 1 µM for the last 72 h of culture. mRNA was extracted using the Norgen total RNA purification plus kit. Reverse transcription was performed for each sample with SuperScript VILO cDNA synthesis. RT-qPCR was performed using equal amounts of cDNA per sample with Perfecta SYBR Green Fastmix (Quanta BioSciences) on the CFX96 real-time PCR detection system (Bio-Rad). All primer products were verified via melt curve analysis. Relative expression levels were normalized to TBP and displayed as log2 fold-change relative to nontargeting gRNA samples. The statistical test was performed with multiple hypothesis testing corrections on dCt values (normalized to TBP). For HL-1 cells, similar protocols were followed. RNA was harvested 15 days posttransduction, with norepinephrine and FBS removed from specified samples for the last 48 h of culture.
Off-target analysis was performed using Cas-OFFinder (Bae et al. 2014). The results are in Supplemental Table S6. The selected gRNA had no off-target sites when zero to two mismatches were allowed, with only two exceptions: the mouse CRISPRa R3 gRNA-2 and the human CRISPRi R3 gRNA. There were three off-target sites for these gRNA when allowing two mismatches. No gene was expressed within 100 kb of these off-target sites in iPSC-CMs or present in the mouse genome. For all CRISPRa experiments, two unique gRNAs were used during expression analysis in Figure 3 to account for any possible gRNA-specific off-target effects.
RT-qPCR primers for human NPPA (Hs.PT.58.4259173), NPPB (Hs.PT.58.19450190), mouse Tbp (Mm.PT.39a.22214839), Myh6 (Mm.PT.58.31314128), and Myh7 (Mm.PT.58.17465550) were purchased from IDT. RT-qPCR primers for human ATP2A2 and mouse Atp2a2 came from previously published work (Angrisano et al. 2014; Traister et al. 2014). RT-qPCR primers for mouse Nppa and Nppb came from previously published work (Sergeeva et al. 2016). RT-qPCR primers for mouse Tnnt2 came from previously published work (Han et al. 2014). All RT-qPCR primer sequences can be found in Supplemental Table S6.
Analysis of cell size and genomic content
Cells were differentiated as described above to assess the cell size and genomic content of iPSC-CMs. iPSC-CMs were then transduced with lentiviral vectors expressing either VP64dCas9VP64 along with a gRNA targeting the myosin enhancer or a nontargeting gRNA 25 days after the start of differentiation. After transduction and enrichment, cells were plated as described above. For the last 48 h of culture, cells were grown with RPMI/B27+ containing 1 µM ET-1 (stress) or vehicle (control). Cells were fixed and stained as described above. The primary antibody was used: rabbit anti-TNNT2 (1:500; Abcam). The following secondary antibodies were used: Alexa Fluor 488 goat antirabbit (Thermo Fisher Scientific) (Supplemental Table S6). DAPI (Thermo Fisher Scientific) and Phalloidin-647 (Thermo Fisher Scientific) targeting F-actin were also used. Exposure time for F-actin was reduced for images under stressed culture conditions. When images were taken using the same exposure time as the control culture condition, pixel intensity was oversaturated. Exposure times were maintained for DAPI and TNNT2 across culture conditions.
Cells were imaged using a Zeiss AxioObserver7 inverted microscope with a Zeiss Axiocam 305 color camera. Images were processed and analyzed using Fiji ImageJ (National Institutes of Health). The assistance of ChatGPT was used to generate the R script for Supplemental Figure S8B. GraphPad Prism was used for statistical analysis (Fig. 4B–D). Statistical analysis was only performed across gRNA targets in the same media condition or across media conditions for an individual single gRNA condition, and a two-way ANOVA with a Fisher's LSD was used. The TNNT2-positive area covered by each individual cell was measured. The total DAPI intensity measured within each cell area was used for genomic content.
Flow cytometry to measure cell size of HL-1 cells
HL-1 cells were transduced with lentiviral vectors expressing VP64dCas9VP64 and a gRNA targeting the myosin enhancer or a nontargeting gRNA. Cells were cultured for 21 days to allow for enhancer activation and gene expression alterations. Cells were dissociated and resuspended in flow buffer containing 1× PBS, 2 mM EDTA, and 0.5% bovine serum albumin. Cells were analyzed for size (FSC) and shape (SSC), gating for live and singlet populations (Supplemental Fig. S8). Median FSC values were used to determine differences in cell size between populations (Fig. 4E). A SH800 FACS cell sorter (Sony Biotechnology) was used for analysis.
Calcium analysis for human iPSC-CMs
The iPSC-CMs used for the following experiments followed the same culture protocol as cells used to analyze cell size and genomic content following enhancer activation and stress. Imaging and analysis were performed across two separate differentiations and three separate transductions across each differentiation for each gRNA. The iPSC-CMs were cultured with either 1 µM ET-1 (stress) or vehicle (control) for 24 h prior to Ca2+ imaging. The iPSC-CMs were washed once with 1× Ca2+-free Tyrode's solution and then stained with 10 µM CAL-520 (Abcam ab171868) for 1 h. Following incubation, iPSC-CMs were then incubated with a 1:1 solution of RPMI/B27+ and 1× Tyrode's solution with 1.8 mM CaCl2 for 15 min prior to imaging. iPSC-CMs were paced at 0.5 Hz with an IonOptix MyoPacer field stimulator (IonOptix) for 10 sec. A Zeiss laser scanning confocal 510 meta microscope (Carl Zeiss AG) was used to capture line scans of iPSC-CMs at 0.1 µM per pixel.
Calcium imaging experiments were analyzed on Fiji ImageJ (National Institutes of Health) using the SparkMaster plug-in. SparkMaster was used to analyze Ca2+ transients and quantify sparks (Picht et al. 2007). SparkMaster features include spark duration, time to peak, width, amplitude, and tau. To quantify Ca2+ leak, multiply spark frequency by the average amplitude, width, and duration at half the maximum of all the sparks for the line scan of a cell to generate a total leak value. Regions of interest used to measure sparks and leaks were generated 2 sec from the last paced beat. Statistical analysis was performed only across gRNA targets in the same media condition or across media conditions for an individual gRNA condition. A two-way ANOVA with a Fisher's LSD was used.
Metabolic analysis using the mito stress test seahorse assay
The iPSC-CMs used for these experiments followed the same culture protocol as used to analyze cell size and genomic content. The seeding densities and drug concentrations were within the guidelines set by Agilent. In brief, 25,000 iPSC-CMs, either control or activated cells, were seeded into 12 wells of a 96-well Seahorse plate made by Agilent 4 days prior to performing the assay. The media was changed 24 h after seeding with normal RB+ media supplemented with ±1 µM ET-1 for 72 h. The standard protocol for the mito stress test was developed by Agilent. Final drug concentrations for the assay are as follows: 2.5 µM oligomycin, 1 µM FCCP, and 2 µM rotenone + antimycin C (Supplemental Fig. S9). The raw data for this experiment can be found in Supplemental Table S3.
Data for each well were normalized to protein concentration at the end of the assay using the Pierce BCA assay kit (Thermo Fisher Scientific). Quantification was generated with the Wave desktop program from Agilent and plotted in Prism. Statistical analysis was performed using a two-way ANOVA test with a Fisher's LSD, as was done with the calcium signaling.
Analysis of chromatin looping at the MYH6 locus by targeted enriched HiCAR
The protocols were published on protocols.io (protocol integer IDs: 110365, 110366) (Anglen et al. 2024c,d). The iPSC-CM and HL-1 were transduced with lentiviral vectors expressing VP64dCas9VP64 and gRNA. Cells were enriched for transduction and cultured for 12 days. iPSC-CMs were cultured with ±1 µM ET-1 for the final 72 h, whereas HL-1 cells were cultured without norepinephrine and FBS during the final 72 h to promote normal gene expression. Live cells were dissociated 15 days posttransduction, centrifuged at 850g for 5 min, resuspended in 1 mL PBS, and fixed with PFA (4%) for 10 min. The reaction was quenched with 80 µL of 2.5 M glycine and washed with PBS. HiCAR libraries were then prepared as previously described (Supplemental Table S6; Wei et al. 2022).
HiCAR libraries were enriched for interactions related to the MYH6/MYH7 locus using a biotin-probe pull-down. Target regions included the MYH6 promoter and gene body, the MYH7 promoter, M3, and other cardiac-specific gene promoters as controls (Supplemental Table S4). Biotinylated probes were ordered from Twist Bioscience, and the enrichment protocol for HiCAR libraries was followed. Universal blockers (Revvity NOVA-5143231) were used during enrichment to prevent undesired pull-downs. The targeted region for human and mouse libraries covered ∼60 kb of genomic space. Each library aimed for a sequencing depth of at least 15 million reads on an Illumina NextSeq 2000 with paired-end 50 bp reads.
Following sequencing, standard HiCAR analysis was performed using the pipeline from the original publication (Wei et al. 2022). Briefly, Raw FASTQ files were mapped to the reference genome by BWA-MEM with the “–SP5M” option. The aligned reads were processed with Pairtools (v1.1.0) to filter out low-quality reads: reads with a MAPQ less than 10, nonrescuable chimeric reads, and self-ligated reads (Abdennur et al. 2024). Duplicated reads were also removed with Pairtools (Abdennur et al. 2024). Ten kilobase bins were used to aggregate counts during the generation of the count tables. Visualization of these regions was generated by custom Python scripts. The visualization of reads across all samples was generated with HiGlass (v1.14.8) (Supplemental Fig. S10; Kerpedjiev et al. 2018).
Genomic interactions were analyzed using the contact matrix generated by the HiCAR pipeline in DESeq2 (v1.42.0) with default parameters (Supplemental Table S4; Love et al. 2014). Briefly, a 10 kb resolution raw contact matrix was constructed within the following genomic range: Chr 14: 23,303,865–23,451,365 in hg38 coordinates and Chr 14: 55,111,190–55,258,690 in mm39 coordinates. Those contact matrices were used as input for the differential test. All replicates were considered for each condition during the test. The Wald test with Benjamini–Hochberg corrections was performed to assess the statistical significance of genomic pairs between the tested conditions, with 0.05 as a false-discovery rate cutoff for the significance of the adjusted P-value.
Analysis of genetic variants from UK Biobank samples within the myosin-specific enhancer
UK Biobank DRAGEN population-level WGS data (500,000 release) was analyzed to identify variants within regions R1–R3 associated with the myosin-specific enhancer (Chr 14: 23,377,559–23,378,416 for R1, Chr 14: 23,378,863–23,379,551 for R2, and Chr 14: 23,379,863–23,380,961 for R3, hg38) (Bycroft et al. 2018). The full cohort description and WGS processes are described elsewhere (Hofmeister et al. 2023). Briefly, WGS data (30×) were reprocessed using the DRAGEN 3.7.8 pipeline for both individual and joint-called data for all participants (Scheffler et al. 2023). In total, there were 12,928 participants with cardiomyopathies and 473,770 controls. Participants with CAD were excluded from both groups. The specific criteria for defining CM participants and controls are available in Supplemental Table S5. Individuals were considered controls when they did not meet the criteria for cardiomyopathies or CAD. VCFtools (version 0.1.16) was used to identify variants present within each region in participants with cardiomyopathy (n = 4320) or individuals without cardiomyopathy (controls; n = 192,805) (Danecek et al. 2011). A total of 63 variants were identified in CM participants across intronic and noncoding regions overlapping the coordinates mentioned above (Supplemental Table S5, Supplemental Figs. S4A, S11A). Fisher's exact tests were performed to compare variant frequencies in cardiomyopathy participants to controls for each variant. Variant tolerance for variants within region R3 was assessed using JASPAR TF binding profiles, evaluating the impact of each variant on TF binding motifs. The tolerance score was calculated as ((Alt_value − Ref_value) / Total_value), with possible scores ranging from −1 to one. A score of zero indicates no effect, one is a novel motif, and −1 indicates a maximal decrease in variant tolerance. Variants found across all regions were scored for their potential pathogenic effects using CADD (v1.7) (Schubach et al. 2024). Those scores can be found in Supplemental Figure S11A and Supplemental Table S5.
Data access
All raw sequencing data and analysis files for ATAC-seq, RNA-seq, and HiCAR can be found at the NCBI Gene Expression Omnibus (GEO; https://www.ncbi.nlm.nih.gov/geo/) under accession numbers GSE283424, GSE283426, GSE283427, GSE283430, and GSE283432. All code related to iPSC-CM proliferation, ATAC-seq, RNA-seq, motif analysis, reprocessing publicly available data, and HiCAR analysis is available at GitHub (https://github.com/Gersbachlab-Bioinformatics/myosin_enhancer) and as Supplemental Code. The ENCODE ChIP-seq pipeline is available at GitHub (https://github.com/ENCODE-DCC/chip-seq-pipeline2). The HiCAR pipeline is available through nf-core (https://nf-co.re/hicar/1.0.0/).
Competing interest statement
C.A.G. is an inventor on patents and patent applications related to genome engineering and CRISPR screens and is a cofounder and advisor to Tune Therapeutics, an advisor to Sarepta Therapeutics, and a cofounder of Locus Biosciences.
Acknowledgments
The work is funded by National Institutes of Health grants RM1HG011123, R01MH125236, and UM1HG012053; National Science Foundation grant EFMA-1830957; the Translating Duke Health Initiative; and Open Philanthropy. We thank the Duke Sequencing Core and Duke Cell Culture Facility for assistance. We also thank the teams at the High-throughput Applied Research Data Analysis Cluster (HARDAC) and Duke Computing Cluster (DCC) for computing resources. Schematics were created with BioRender (https://www.biorender.com).
Author contributions: T.A., R.K., and C.A.G. conceived the study. T.A. and C.A.G. wrote the paper with the help of all authors. T.A. was primarily responsible for the design of all experiments, performed all iPSC to CM differentiations, generated virus for gene editing, processed all samples for data generation, and led the analysis and interpretation of the generated data. I.M.K. reprocessed publicly available data related to epigenetic profiling, generated the associated browser tracks, assisted in their interpretation, and assisted in preparing plasmid and lentivirus. K.T.H. assisted in the production of lentivirus used in these studies. T.A., B.C., I.J., Y.D., and C.A.G. participated in the design, analysis, and interpretation of the HiCAR experiments. T.A., R.M.P., E.D., A.P.L., and C.A.G. participated in the design, analysis, and interpretation of the calcium imaging experiments. D.T. prepared all HiCAR libraries for NGS. M.E.R. and S.H.S. contributed to the design and analysis of the genetic variants in the UK Biobank. All authors contributed to data interpretation and writing of the manuscript.
Notes
[1] Supplementary material [Supplemental material is available for this article.]
[2] Article published online before print. Article, supplemental material, and publication date are at https://www.genome.org/cgi/doi/10.1101/gr.280825.125.
[3] Freely available online through the Genome Research Open Access option.
References
- ↵Abdennur N, Fudenberg G, Flyamer IM, Galitsyna AA, Goloborodko A, Imakaev M, Venev SV. 2024. Pairtools: from sequencing data to chromosome contacts. PLoS Comput Biol 20: e1012164. 10.1371/journal.pcbi.1012164
- ↵Akerberg BN, Gu F, VanDusen NJ, Zhang X, Dong R, Li K, Zhang B, Zhou B, Sethi I, Ma Q, 2019. A reference map of murine cardiac transcription factor chromatin occupancy identifies dynamic and conserved enhancers. Nat Commun 10: 4907. 10.1038/s41467-019-12812-3
- ↵Ang YS, Rivas RN, Ribeiro AJS, Srivas R, Rivera J, Stone NR, Pratt K, Mohamed TMA, Fu JD, Spencer CI, 2016. Disease model of GATA4 mutation reveals transcription factor cooperativity in human cardiogenesis. Cell 167: 1734–1749.e22. 10.1016/j.cell.2016.11.033
- ↵Anglen T, Kaplow IM, Choi B, Hagy K, Tran D, Ramaker ME, Barrera A, Shah S, Jung I, Karra R, 2024a. RNA-seq for human iPSC-CM following GSK3 inhibition v1. protocols.io 10.17504/protocols.io.kqdg32rb1v25/v1
- ↵Anglen T, Kaplow IM, Choi B, Hagy K, Tran D, Ramaker ME, Shah S, Jung I, Karra R, Diao Y, 2024b. ATAC-seq for human iPSC-CM following GSK3 inhibition v1. protocols.io 10.17504/protocols.io.5qpvokj27l4o/v1
- ↵Anglen T, Kaplow IM, Choi B, Hagy K, Tran D, Ramaker ME, Shah S, Jung I, Karra R, Diao Y, 2024c. HiCAR for human iPSC-CM following enhancer perturbations v1. protocols.io 10.17504/protocols.io.3byl49mdrgo5/v1
- ↵Anglen T, Kaplow IM, Choi B, Hagy K, Tran D, Ramaker ME, Shah S, Jung I, Karra R, Diao Y, 2024d. HiCAR for mouse HL-1 cells following enhancer perturbations v1. protocols.io 10.17504/protocols.io.36wgqn2yygk5/v1
- ↵Angrisano T, Schiattarella GG, Keller S, Pironti G, Florio E, Magliulo F, Bottino R, Pero R, Lembo F, Avvedimento EV, 2014. Epigenetic switch at Atp2a2 and Myh7 gene promoters in pressure overload-induced heart failure. PLoS One 9: e106024. 10.1371/journal.pone.0106024
- ↵Bae S, Park J, Kim JS. 2014. Cas-OFFinder: a fast and versatile algorithm that searches for potential off-target sites of Cas9 RNA-guided endonucleases. Bioinformatics 30: 1473–1475. 10.1093/bioinformatics/btu048
- ↵Bailey TL, Johnson J, Grant CE, Noble WS. 2015. The MEME suite. Nucleic Acids Res 43: W39–W49. 10.1093/nar/gkv416
- ↵Bloch L, Ndongson-Dongmo B, Kusch A, Dragun D, Heller R, Huber O. 2016. Real-time monitoring of hypertrophy in HL-1 cardiomyocytes by impedance measurements reveals different modes of growth. Cytotechnology 68: 1897–1907. 10.1007/s10616-016-0001-3
- ↵Bolger AM, Lohse M, Usadel B. 2014. Trimmomatic: a flexible trimmer for Illumina sequence data. Bioinformatics 30: 2114–2120. 10.1093/bioinformatics/btu170
- ↵Bourque K, Hawey C, Jones-Tabah J, Pétrin D, Martin RD, Ling Sun Y, Hébert TE. 2022. Measuring hypertrophy in neonatal rat primary cardiomyocytes and human iPSC-derived cardiomyocytes. Methods 203: 447–464. 10.1016/j.ymeth.2021.12.006
- ↵Brodsky VY, Sarkisov DS, Arefyeva AM, Panova NW, Gvasava IG. 1994. Polyploidy in cardiac myocytes of normal and hypertrophic human hearts; range of values. Vichows Archiv 424: 429–435. 10.1007/BF00190566
- ↵Buikema JW, Lee S, Goodyer WR, Maas RG, Chirikian O, Li G, Miao Y, Paige SL, Lee D, Wu H, 2020. Wnt activation and reduced cell-cell contact synergistically induce massive expansion of functional human iPSC-derived cardiomyocytes. Cell Stem Cell 27: 50–63.e5. 10.1016/j.stem.2020.06.001
- ↵Bycroft C, Freeman C, Petkova D, Band G, Elliott LT, Sharp K, Motyer A, Vukcevic D, Delaneau O, O'Connell J, 2018. The UK Biobank resource with deep phenotyping and genomic data. Nature 562: 203–209. 10.1038/s41586-018-0579-z
- ↵Carniel E, Taylor MRG, Sinagra G, Di Lenarda A, Ku L, Fain PR, Boucek MM, Cavanaugh J, Miocic S, Slavov D, 2005. α-Myosin heavy chain: a sarcomeric gene associated with dilated and hypertrophic phenotypes of cardiomyopathy. Circulation 112: 54–59. 10.1161/CIRCULATIONAHA.104.507699
- ↵Cavalheiro GR, Pollex T, Furlong EE. 2021. To loop or not to loop: What is the role of TADs in enhancer function and gene regulation? Curr Opin Genet Dev 67: 119–129. 10.1016/j.gde.2020.12.015
- ↵Cavanagh BL, Walker T, Norazit A, Meedeniya ACB. 2011. Thymidine analogues for tracking DNA synthesis. Molecules 16: 7980–7993. 10.3390/molecules16097980
- ↵Chen JH, Wang LL, Tao L, Qi B, Wang Y, Guo YJ, Miao L. 2021. Identification of MYH6 as the potential gene for human ischaemic cardiomyopathy. J Cell Mol Med 25: 10736–10746. 10.1111/jcmm.17015
- ↵Ching YH, Ghosh TK, Cross SJ, Packham EA, Honeyman L, Loughna S, Robinson TE, Dearlove AM, Ribas G, Bonser AJ, 2005. Mutation in myosin heavy chain 6 causes atrial septal defect. Nat Genet 37: 423–428. 10.1038/ng1526
- ↵Claycomb WC, Lanson NA, Stallworth BS, Egeland DB, Delcarpio JB, Bahinski A, Izzo NJ. 1998. HL-1 cells: a cardiac muscle cell line that contracts and retains phenotypic characteristics of the adult cardiomyocyte. Proc Natl Acad Sci 95: 2979–2984. 10.1073/pnas.95.6.2979
- ↵Corces MR, Trevino AE, Hamilton EG, Greenside PG, Sinnott-Armstrong NA, Vesuna S, Satpathy AT, Rubin AJ, Montine KS, Wu B, 2017. An improved ATAC-seq protocol reduces background and enables interrogation of frozen tissues. Nat Methods 14: 959–962. 10.1038/nmeth.4396
- ↵Daily NJ, Santos R, Vecchi J, Kemanli P, Wakatsuki T. 2017. Calcium transient assays for compound screening with human iPSC-derived cardiomyocytes: evaluating new tools. J Evol Stem Cell Res 1: 1–11. 10.14302/issn.2574-4372.jesr-16-1395
- ↵Danecek P, Auton A, Abecasis G, Albers CA, Banks E, DePristo MA, Handsaker RE, Lunter G, Marth GT, Sherry ST, 2011. The variant call format and VCFtools. Bioinformatics 27: 2156–2158. 10.1093/bioinformatics/btr330
- ↵Dhaun N, Goddard J, Kohan DE, Pollock DM, Schiffrin EL, Webb DJ. 2008. Role of endothelin-1 in clinical hypertension: 20 years on. Hypertension 52: 452–459. 10.1161/HYPERTENSIONAHA.108.117366
- ↵Dirkx E, da Costa Martins PA, De Windt LJ. 2013. Regulation of fetal gene expression in heart failure. Biochim Biophys Acta Mol Basis Dis 1832: 2414–2424. 10.1016/j.bbadis.2013.07.023
- ↵Dobin A, Davis CA, Schlesinger F, Drenkow J, Zaleski C, Jha S, Batut P, Chaisson M, Gingeras TR. 2013. STAR: ultrafast universal RNA-seq aligner. Bioinformatics 29: 15–21. 10.1093/bioinformatics/bts635
- ↵Dunham I, Kundaje A, Aldred SF, Collins PJ, Davis CA, Doyle F, Epstein CB, Frietze S, Harrow J, Kaul R, 2012. An integrated encyclopedia of DNA elements in the human genome. Nature 489: 57–74. 10.1038/nature11247
- ↵Fornes O, Castro-Mondragon JA, Khan A, Van Der Lee R, Zhang X, Richmond PA, Modi BP, Correard S, Gheorghe M, Baranašić D, 2020. JASPAR 2020: update of the open-access database of transcription factor binding profiles. Nucleic Acids Res 48: D87–D92. 10.1093/nar/gkz1001
- ↵Gacita AM, Fullenkamp DE, Ohiri J, Pottinger T, Puckelwartz MJ, Nobrega MA, McNally EM. 2021. Genetic variation in enhancers modifies cardiomyopathy gene expression and progression. Circulation 143: 1302–1316. 10.1161/CIRCULATIONAHA.120.050432
- ↵Ghosh AK. 2020. P300 in cardiac development and accelerated cardiac aging. Aging Dis 11: 916–926. 10.14336/AD.2020.0401
- ↵Gilbert G, Demydenko K, Dries E, Puertas RD, Jin X, Sipido K, Llewelyn Roderick H. 2020. Calcium signaling in cardiomyocyte function. Cold Spring Harb Perspect Biol 12: a035428. 10.1101/cshperspect.a035428
- ↵Gilsbach R, Schwaderer M, Preissl S, Grüning BA, Kranzhöfer D, Schneider P, Nührenberg TG, Mulero-Navarro S, Weichenhan D, Braun C, 2018. Distinct epigenetic programs regulate cardiac myocyte development and disease in the human heart in vivo. Nat Commun 9: 391. 10.1038/s41467-017-02762-z
- ↵Goetze JP, Bruneau BG, Ramos HR, Ogawa T, de Bold MK, de Bold AJ. 2020. Cardiac natriuretic peptides. Nat Rev Cardiol 17: 698–717. 10.1038/s41569-020-0381-0
- ↵Gorkin DU, Barozzi I, Zhao Y, Zhang Y, Huang H, Lee AY, Li B, Chiou J, Wildberg A, Ding B, 2020. An atlas of dynamic chromatin landscapes in mouse fetal development. Nature 583: 744–751. 10.1038/s41586-020-2093-3
- ↵Grandi FC, Modi H, Kampman L, Corces MR. 2022. Chromatin accessibility profiling by ATAC-seq. Nat Protoc 17: 1518–1552. 10.1038/s41596-022-00692-9
- ↵Hammal F, De Langen P, Bergon A, Lopez F, Ballester B. 2022. ReMap 2022: a database of human, mouse, Drosophila and Arabidopsis regulatory regions from an integrative analysis of DNA-binding sequencing experiments. Nucleic Acids Res 50: D316–D325. 10.1093/nar/gkab996
- ↵Han P, Li W, Lin CH, Yang J, Shang C, Nurnberg ST, Jin KK, Xu W, Lin CY, Lin CJ, 2014. A long noncoding RNA protects the heart from pathological hypertrophy. Nature 514: 102–106. 10.1038/nature13596
- ↵He A, Kong SW, Ma Q, Pu WT. 2011. Co-occupancy by multiple cardiac transcription factors identifies transcriptional enhancers active in heart. Proc Natl Acad Sci 108: 5632–5637. 10.1073/pnas.1016959108
- ↵Herron TJ, Devaney E, Mundada L, Arden E, Day S, Guerrero-Serna G, Turner I, Westfall M, Metzger JM. 2010. Ca2+-independent positive molecular inotropy for failing rabbit and human cardiac muscle by alpha-myosin motor gene transfer. FASEB J 24: 415–424. 10.1096/fj.09-140566
- ↵Hocker JD, Poirion OB, Zhu F, Buchanan J, Zhang K, Chiou J, Wang T-M, Zhang Q, Hou X, Li YE, 2021. Cardiac cell type–specific gene regulatory programs and disease risk association. Sci Adv 7: eabf1444. 10.1126/sciadv.abf1444
- ↵Hofmeister RJ, Ribeiro DM, Rubinacci S, Delaneau O. 2023. Accurate rare variant phasing of whole-genome and whole-exome sequencing data in the UK Biobank. Nat Genet 55: 1243–1249. 10.1038/s41588-023-01415-w
- ↵Jiang F, Mohr F, Ullrich ND, Hecker M, Wagner AH. 2019. Endothelial cell modulation of cardiomyocyte gene expression. Exp Cell Res 383: 111565. 10.1016/j.yexcr.2019.111565
- ↵Kerpedjiev P, Abdennur N, Lekschas F, McCallum C, Dinkla K, Strobelt H, Luber JM, Ouellette SB, Azhir A, Kumar N, 2018. HiGlass: web-based visual exploration and analysis of genome interaction maps. Genome Biol 19: 125. 10.1186/s13059-018-1486-1
- ↵Kolberg L, Raudvere U, Kuzmin I, Adler P, Vilo J, Peterson H. 2023. G:Profiler-interoperable web service for functional enrichment analysis and gene identifier mapping (2023 update). Nucleic Acids Res 51: W207–W212. 10.1093/nar/gkad347
- ↵Kubo N, Ishii H, Xiong X, Bianco S, Meitinger F, Hu R, Hocker JD, Conte M, Gorkin D, Yu M, 2021. Promoter-proximal CTCF binding promotes distal enhancer-dependent gene activation. Nat Struct Mol Biol 28: 152–161. 10.1038/s41594-020-00539-5
- ↵Kumarswamy R, Lyon AR, Volkmann I, Mills AM, Bretthauer J, Pahuja A, Geers-Knörr C, Kraft T, Hajjar RJ, MacLeod KT, 2012. SERCA2a gene therapy restores microRNA-1 expression in heart failure via an Akt/FoxO3A-dependent pathway. Eur Heart J 33: 1067–1075. 10.1093/eurheartj/ehs043
- ↵Langmead B, Trapnell C, Pop M, Salzberg SL. 2009. Ultrafast and memory-efficient alignment of short DNA sequences to the human genome. Genome Biol 10: R25. 10.1186/gb-2009-10-3-r25
- ↵Lian X, Zhang J, Azarin SM, Zhu K, Hazeltine LB, Bao X, Hsiao C, Kamp TJ, Palecek SP. 2013. Directed cardiomyocyte differentiation from human pluripotent stem cells by modulating Wnt/β-catenin signaling under fully defined conditions. Nat Protoc 8: 162–175. 10.1038/nprot.2012.150
- ↵Liao Y, Smyth GK, Shi W. 2014. featureCounts: an efficient general purpose program for assigning sequence reads to genomic features. Bioinformatics 30: 923–930. 10.1093/bioinformatics/btt656
- ↵Locher MR, Razumova MV, Stelzer JE, Norman HS, Moss RL, Locher MR. 2011. Effects of low-level-myosin heavy chain expression on contractile kinetics in porcine myocardium. Am J Physiol Heart Circ Physiol 300: H869–H878. 10.1152/ajpheart.00452.2010
- ↵Love MI, Huber W, Anders S. 2014. Moderated estimation of fold change and dispersion for RNA-seq data with DESeq2. Genome Biol 15: 550. 10.1186/s13059-014-0550-8
- ↵Lowes BD, Minobe W, Abraham WT, Rizeq MN, Bohlmeyer TJ, Quaife RA, Roden RL, Dutcher DL, Robertson AO, Voelkel NF, 1997. Changes in gene expression in the intact human heart: downregulation of α-myosin heavy chain in hypertrophied, failing ventricular myocardium. J Clin Invest 100: 2315–2324. 10.1172/JCI119770
- ↵Lundy SD, Zhu WZ, Regnier M, Laflamme MA. 2013. Structural and functional maturation of cardiomyocytes derived from human pluripotent stem cells. Stem Cells Dev 22: 1991–2002. 10.1089/scd.2012.0490
- ↵Man JCK, Van Duijvenboden K, Krijger PHL, Hooijkaas IB, Van Der Made I, De Gier-De Vries C, Wakker V, Creemers EE, De Laat W, Boukens BJ, 2021. Genetic dissection of a super enhancer controlling the Nppa-Nppb cluster in the heart. Circ Res 128: 115–129. 10.1161/CIRCRESAHA.120.317045
- ↵May D, Blow MJ, Kaplan T, McCulley DJ, Jensen BC, Akiyama JA, Holt A, Plajzer-Frick I, Shoukry M, Wright C, 2012. Large-scale discovery of enhancers from human heart tissue. Nat Genet 44: 89–93. 10.1038/ng.1006
- ↵McCutcheon SR, Swartz AM, Brown MC, Barrera A, McRoberts Amador C, Siklenka K, Humayun L, ter Weele MA, Isaacs JM, Reddy TE, 2023. Transcriptional and epigenetic regulators of human CD8+ T cell function identified through orthogonal CRISPR screens. Nat Genet 55: 2211–2223. 10.1038/s41588-023-01554-0
- ↵Mills RJ, Parker BL, Quaife-Ryan GA, Voges HK, Needham EJ, Bornot A, Ding M, Andersson H, Polla M, Elliott DA, 2019. Drug screening in human PSC-cardiac organoids identifies pro-proliferative compounds acting via the mevalonate pathway. Cell Stem Cell 24: 895–907.e6. 10.1016/j.stem.2019.03.009
- ↵Miyata S, Minobe W, Bristow MR, Leinwand LA. 2000. Myosin heavy chain isoform expression in the failing and nonfailing human heart. Circ Res 86: 386–390. 10.1161/01.res.86.4.386
- ↵Mollova M, Bersell K, Walsh S, Savla J, Das LT, Park SY, Silberstein LE, Dos Remedios CG, Graham D, Colan S, 2013. Cardiomyocyte proliferation contributes to heart growth in young humans. Proc Natl Acad Sci 110: 1446–1451. 10.1073/pnas.1214608110
- ↵Montag J, Syring M, Rose J, Weber AL, Ernstberger P, Mayer AK, Becker E, Keyser B, dos Remedios C, Perrot A, 2017. Intrinsic MYH7 expression regulation contributes to tissue level allelic imbalance in hypertrophic cardiomyopathy. J Muscle Res Cell Motil 38: 291–302. 10.1007/s10974-017-9486-4
- ↵Mueller EE, Momen A, Massé S, Zhou YQ, Liu J, Backx PH, Henkelman RM, Nanthakumar K, Stewart DJ, Husain M. 2011. Electrical remodelling precedes heart failure in an endothelin-1-induced model of cardiomyopathy. Cardiovasc Res 89: 623–633. 10.1093/cvr/cvq351
- ↵Nakao K, Minobe W, Roden R, Bristow MR, Leinwand LA. 1997. Myosin heavy chain gene expression in human heart failure. J Clin Invest 100: 2362–2370. 10.1172/JCI119776
- ↵Nassar LR, Barber GP, Benet-Pagès A, Casper J, Clawson H, Diekhans M, Fischer C, Gonzalez JN, Hinrichs AS, Lee BT, 2023. The UCSC Genome Browser database: 2023 update. Nucleic Acids Res 51: D1188–D1195. 10.1093/nar/gkac1072
- ↵Parbhudayal RY, Harms HJ, Michels M, van Rossum AC, Germans T, van der Velden J. 2020. Increased myocardial oxygen consumption precedes contractile dysfunction in hypertrophic cardiomyopathy caused by pathogenic TNNT2 gene variants. J Am Heart Assoc 9: e015316. 10.1161/JAHA.119.015316
- ↵Pereira PD, Serra-Caetano A, Cabrita M, Bekman E, Braga J, Rino J, Santus R, Filipe PL, Sousa AE, Ferreira JA. 2017. Quantification of cell cycle kinetics by EdU (5-ethynyl-2′-deoxyuridine)-coupled-fluorescence-intensity analysis. Oncotarget 8: 40514–40532. 10.18632/oncotarget.17121
- ↵Picht E, Zima AV, Blatter LA, Bers DM. 2007. SparkMaster: automated calcium spark analysis with ImageJ. Am J Physiol Cell Physiol 293: C1073–C1081. 10.1152/ajpcell.00586.2006
- ↵Posch MG, Waldmuller S, Müller M, Scheffold T, Fournier D, Andrade-Navarro MA, de Geeter B, Guillaumont S, Dauphin C, Yousseff D, 2011. Cardiac alpha-myosin (MYH6) is the predominant sarcomeric disease gene for familial atrial septal defects. PLoS One 6: e28872. 10.1371/journal.pone.0028872
- ↵Quinlan AR, Hall IM. 2010. BEDTools: a flexible suite of utilities for comparing genomic features. Bioinformatics 26: 841–842. 10.1093/bioinformatics/btq033
- ↵Ramírez F, Dündar F, Diehl S, Grüning BA, Manke T. 2014. deepTools: a flexible platform for exploring deep-sequencing data. Nucleic Acids Res 42: W187–W191. 10.1093/nar/gku365
- ↵R Core Team. 2023. R: a language and environment for statistical computing. R Foundation for Statistical Computing, Vienna. https://www.R-project.org/.
- ↵Robinson JT, Thorvaldsdóttir H, Winckler W, Guttman M, Lander ES, Getz G, Mesirov JP. 2011. Integrative genomics viewer. Nat Biotechnol 29: 24–26. 10.1038/nbt.1754
- ↵Sartorelli V, Lauberth SM. 2020. Enhancer RNAs are an important regulatory layer of the epigenome. Nat Struct Mol Biol 27: 521–528. 10.1038/s41594-020-0446-0
- ↵Scheffler K, Catreux S, O'Connell T, Jo H, Jain V, Heyns T, Yuan J, Murray L, Han J, Mehio R. 2023. Somatic small-variant calling methods in Illumina DRAGEN secondary analysis. bioRxiv 10.1101/2023.03.23.534011
- ↵Schubach M, Maass T, Nazaretyan L, Röner S, Kircher M. 2024. CADD v1.7: using protein language models, regulatory CNNs and other nucleotide-level scores to improve genome-wide variant predictions. Nucleic Acids Res 52: D1143–D1154. 10.1093/nar/gkad989
- ↵Sergeeva IA, Hooijkaas IB, Ruijter JM, van der Made I, de Groot NE, van de Werken HJG, Creemers EE, Christoffels VM. 2016. Identification of a regulatory domain controlling the Nppa-Nppb gene cluster during heart development and stress. Development 143: 2135–2146. 10.1242/dev.132019
- ↵Singh AP, Umbarkar P, Guo Y, Force T, Gupte M, Lal H. 2019. Inhibition of GSK-3 to induce cardiomyocyte proliferation: a recipe for in situ cardiac regeneration. Cardiovasc Res 115: 20–30. 10.1093/cvr/cvy255
- ↵Stirling DR, Swain-Bowden MJ, Lucas AM, Carpenter AE, Cimini BA, Goodman A. 2021. CellProfiler 4: improvements in speed, utility and usability. BMC Bioinformatics 22: 433. 10.1186/s12859-021-04344-9
- ↵Talman V, Kivelä R. 2018. Cardiomyocyte–endothelial cell interactions in cardiac remodeling and regeneration. Front Cardiovasc Med 5: 101. 10.3389/fcvm.2018.00101
- ↵Traister A, Li M, Aafaqi S, Lu M, Arab S, Radisic M, Gross G, Guido F, Sherret J, Verma S, 2014. Integrin-linked kinase mediates force transduction in cardiomyocytes by modulating SERCA2a/PLN function. Nat Commun 5: 4533. 10.1038/ncomms5533
- ↵Uehara Y, Azuma Y, Minai K, Yoshida H, Yoshimura M, Shimizu M. 2012. Endothelin-1 prolongs intracellular calcium transient decay in neonatal rat cardiac myocytes. Heart Vessels 27: 98–105. 10.1007/s00380-011-0133-5
- ↵Visel A, Minovitsky S, Dubchak I, Pennacchio LA. 2007. VISTA Enhancer Browser: a database of tissue-specific human enhancers. Nucleic Acids Res 35: D88–D92. 10.1093/nar/gkl822
- ↵Vučković S, Dinani R, Nollet EE, Kuster DWD, Buikema JW, Houtkooper RH, Nabben M, van der Velden J, Goversen B. 2022. Characterization of cardiac metabolism in iPSC-derived cardiomyocytes: lessons from maturation and disease modeling. Stem Cell Res Ther 13: 332. 10.1186/s13287-022-03021-9
- ↵Wang X, Tucker NR, Rizki G, Mills R, Krijger PH, de Wit E, Subramanian V, Bartell E, Nguyen X-X, Ye J, 2016. Discovery and validation of sub-threshold genome-wide association study loci using epigenomic signatures. eLife 5: e10557. 10.7554/eLife.10557
- ↵Wei X, Xiang Y, Peters DT, Marius C, Sun T, Shan R, Ou J, Lin X, Yue F, Li W, 2022. HiCAR is a robust and sensitive method to analyze open-chromatin-associated genome organization. Mol Cell 82: 1225–1238.e6. 10.1016/j.molcel.2022.01.023
- ↵Wende AR, Brahma MK, McGinnis GR, Young ME. 2017. Metabolic origins of heart failure. JACC Basic Transl Sci 2: 297–310 10.1016/j.jacbts.2016.11.009
- ↵Yang Y, Wang L, Bell P, McMenamin D, He Z, White J, Yu H, Xu C, Morizono H, Musunuru K, 2016. A dual AAV system enables the Cas9-mediated correction of a metabolic liver disease in newborn mice. Nat Biotechnol 34: 334–338. 10.1038/nbt.3469
- ↵Yang D, Jang I, Choi J, Kim M-S, Lee AJ, Kim H, Eom J, Kim D, Jung I, Lee B. 2018. 3DIV: a 3D-genome interaction viewer and database. Nucleic Acids Res 46: D52–D57. 10.1093/nar/gkx1017
- ↵Ye B, Li L, Xu H, Chen Y, Li F. 2019. Opposing roles of TCF7/LEF1 and TCF7L2 in cyclin D2 and Bmp4 expression and cardiomyocyte cell cycle control during late heart development. Lab Invest 99: 807–818. 10.1038/s41374-019-0204-2
- ↵Zhang Y, Liu T, Meyer CA, Eeckhoute J, Johnson DS, Bernstein BE, Nusbaum C, Myers RM, Brown M, Li W, 2008. Model-based Analysis of ChIP-Seq (MACS). Genome Biol 9: R137. 10.1186/gb-2008-9-9-r137
- ↵Zhang Y, Sun Z, Jia J, Du T, Zhang N, Tang Y, Fang Y, Fang D. 2021. Overview of histone modification. Adv Exp Med Biol 1283: 1–16. 10.1007/978-981-15-8104-5_1
- ↵Zhang H, Pei L, Ouyang Z, Wang H, Chen X, Jiang K, Huang S, Jiang R, Xiang Y, Wei K. 2023. AP-1 activation mediates post-natal cardiomyocyte maturation. Cardiovasc Res 119: 536–550. 10.1093/cvr/cvac088
- ↵Zhou P, VanDusen NJ, Zhang Y, Cao Y, Sethi I, Hu R, Zhang S, Wang G, Ye L, Mazumdar N, 2023. Dynamic changes in P300 enhancers and enhancer-promoter contacts control mouse cardiomyocyte maturation. Dev Cell 58: 898–914.e7. 10.1016/j.devcel.2023.03.020