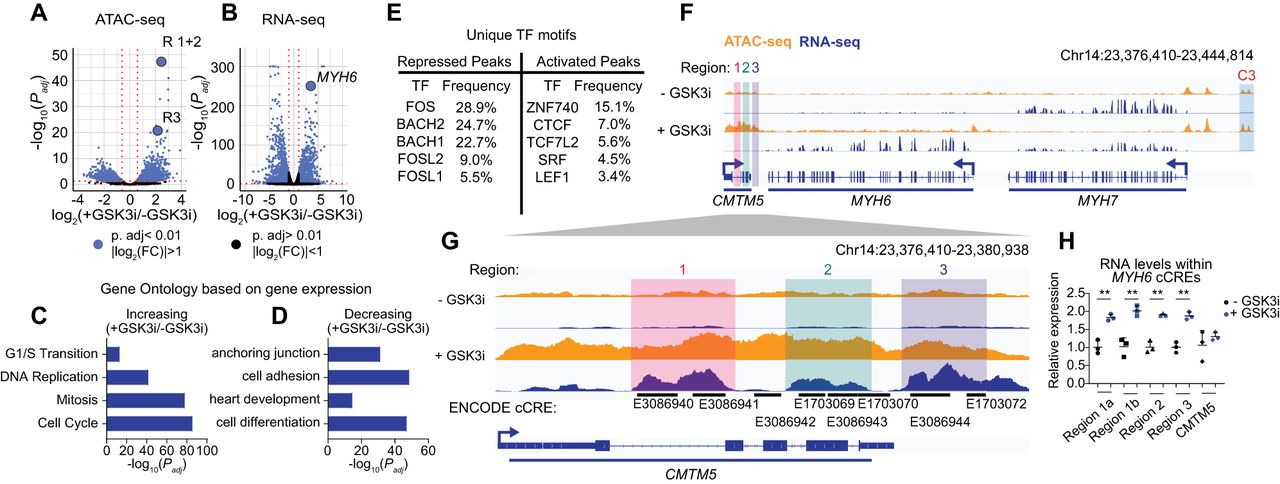
Integrated analysis of ATAC-seq and RNA-seq identifies a cardiac cCRE. (A,B) Significance (Padj) versus log2(FC) in chromatin accessibility (A) or gene expression (B). Differential analysis was performed using a paired two-tailed DESeq2 test. (C,D) Gene Ontology enrichment analysis for differentially expressed genes increasing (C) or decreasing (D) in expression. Select terms are displayed. (E) The top five unique TF motifs for repressed or activated ATAC peaks. (F,G) Visualization of RNA-seq (blue) and ATAC-seq (orange) results at the MYH6 locus (F) and cCREs (G). Highlighted are cCRE regions: R1 (red), R2 (green), and R3 (purple) and a previously characterized MYH7 enhancer C3 (blue). (H) RT-qPCR analysis of transcript abundance for cCRE RNAs and CMTM5 transcripts in iPSC-CMs ± GSK3i. Relative expression is plotted (normalized to control, n = 3 replicates, mean ± SD). Statistics were calculated on dCt values (normalized to TBP) using a one-way ANOVA with Sidak's post hoc test to compare gene expression. (**) Padj < 0.01. See Supplemental Figure S2 and Supplemental Table S2.