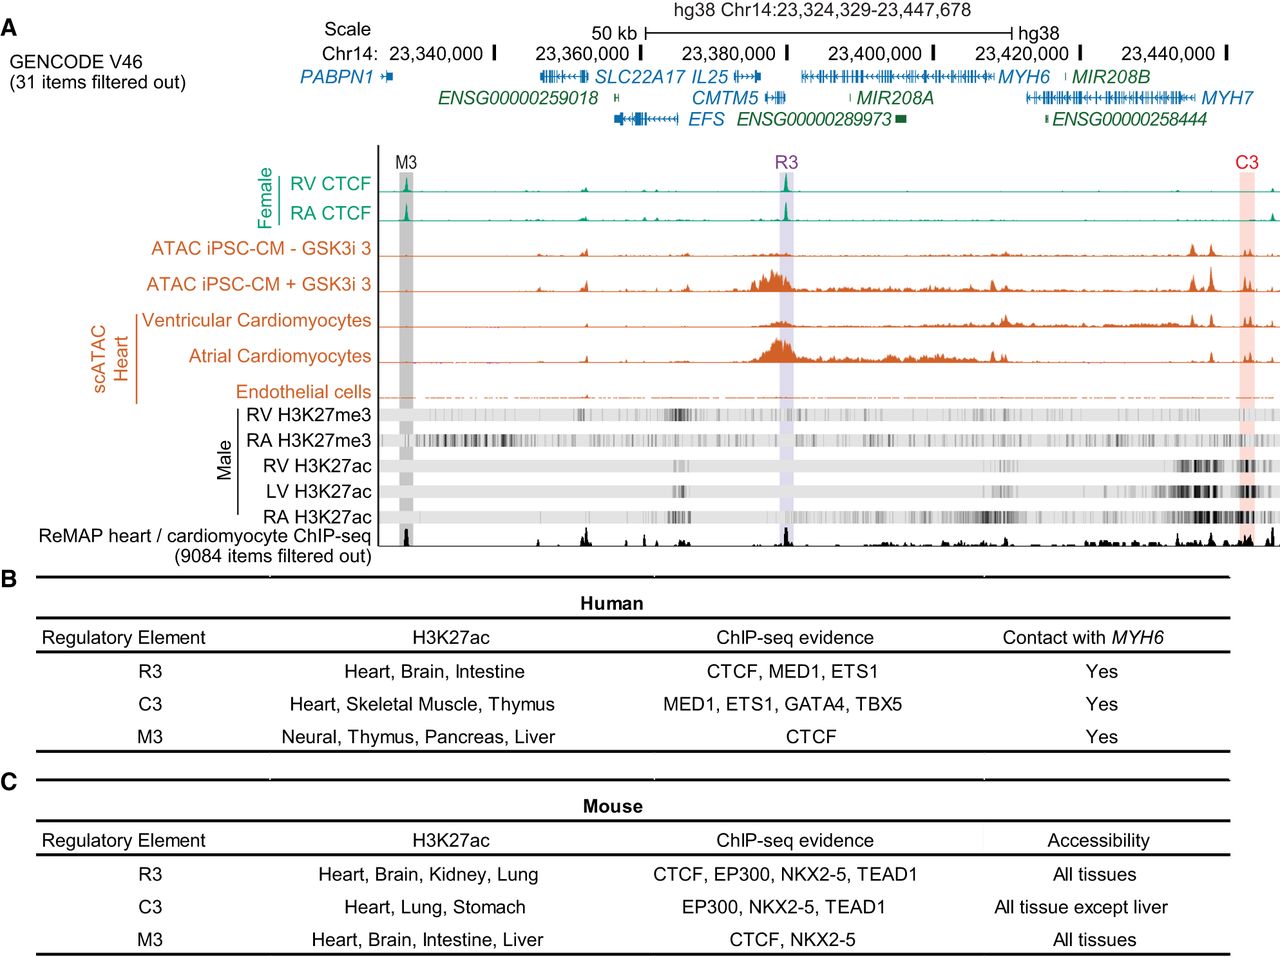
Figure 2.
Epigenetic landscape surrounding of the MYH6 locus. (A) Visualization of cardiac data sets including CTCF-ChIP (green), ATAC-seq profiles from iPSC-CMs and single-cell ATAC-seq in human hearts (orange), RNA-seq profiles in iPSC-CMs (blue), histone ChIP-seq, and ReMap ChIP-seq. The cCREs are labeled as follows: M3 (gray), R3 (purple), and C3 (orange). (B,C) Summary of the epigenetic landscape across the MYH6 locus in human (B) and mouse (C) tissues. ChIP-seq is from cardiac samples. See also Supplemental Figures S3–S7.