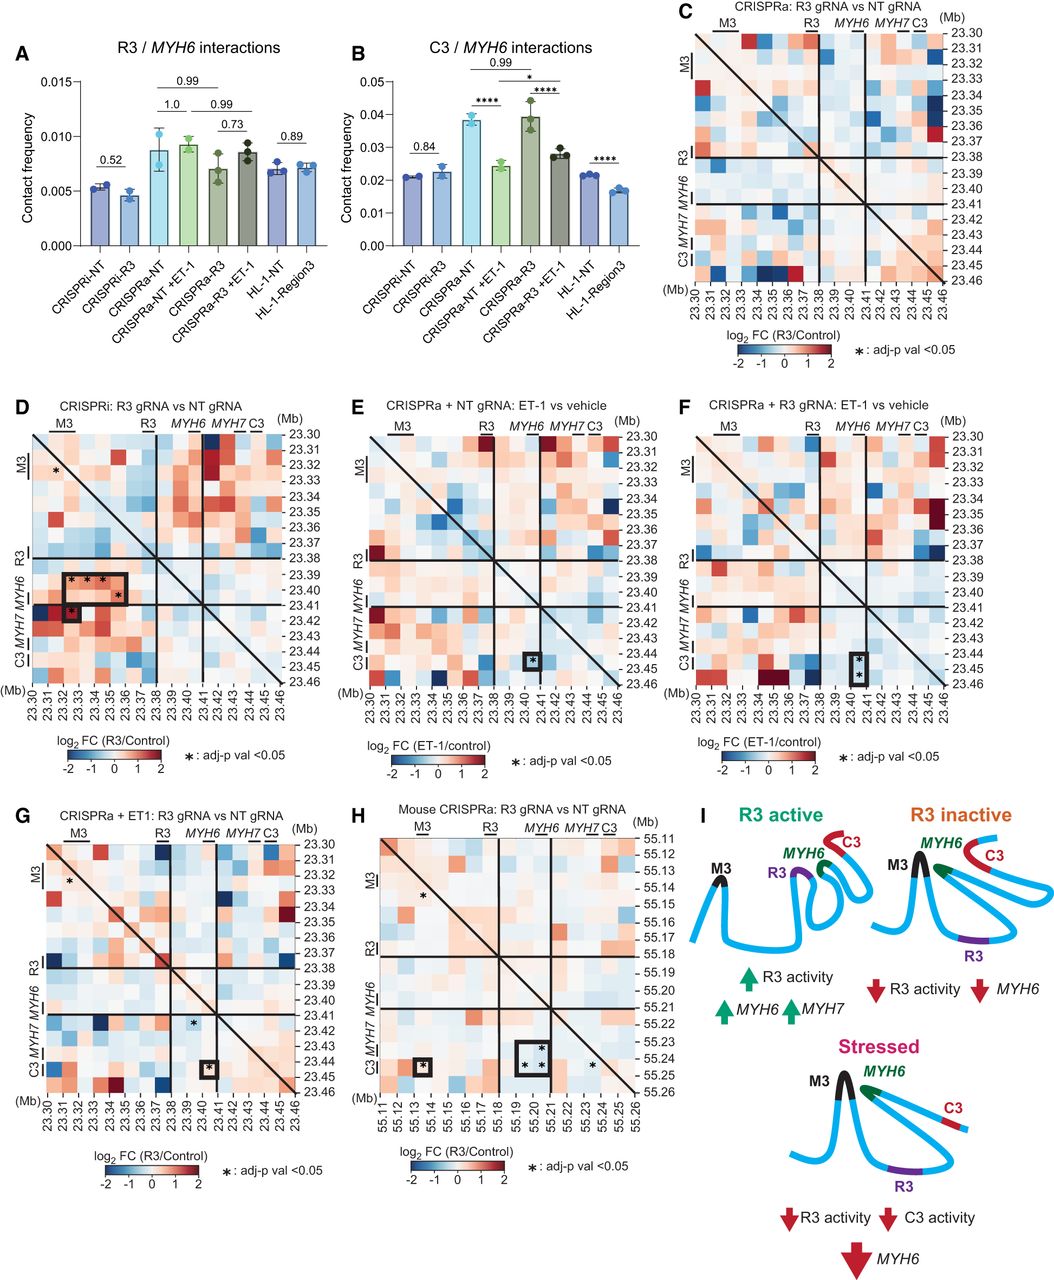
R3 activity alters chromatin looping surrounding MYH6 and MYH7. (A,B) Contact frequency between the MYH6 TSS and R3 (A) or C3 (B), normalized to total contacts in the region, as represented in panels C–H. (C–H) Differential contact maps showing the impact of R3 activity on chromatin looping across culture conditions. Enhancer regions (R3, C3, M3) and the TSS for MYH6 and MYH7 are indicated along each axis. Differential analysis was performed using a DESeq2 test with Wald statistics. Significant contacts (Padj < 0.05) are marked with an asterisk. Heatmaps compare differential contact frequency between R3 activation and control (C) or R3 repression and control (D) in human iPSC-CMs under nonstressed conditions. (E–G) Panels display differential contact frequencies after 72 h of ET-1 exposure: without R3 activation (E), with R3 activation (F), and with R3/control under stressed conditions (G). (H) Heatmap comparing R3 activation and control in unstressed HL-1 mouse atrial CMs. Regions of interest discussed in the text are highlighted with a thick border. (I) Model of myosin regulation. R3 activity is crucial for the expression of MYH6. Varying R3 activity alters MYH6 chromatin contacts. See also Supplemental Figure S10 and Supplemental Table S4.