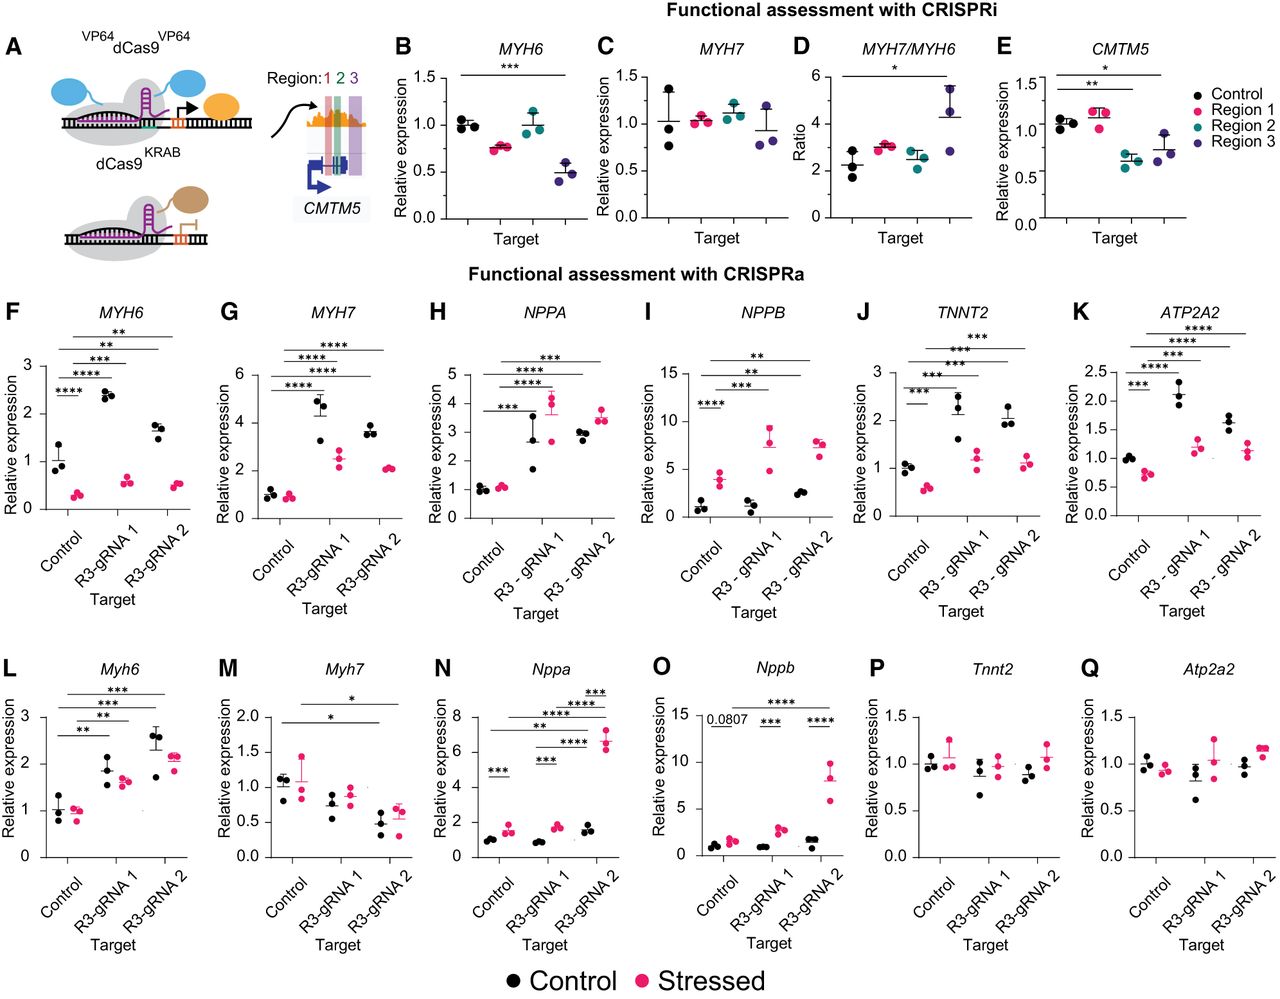
R3 perturbation by CRISPR-based epigenome editing alters cellular response to stress stimuli. (A) Schematic of cCRE targeting using CRISPR epigenome editors. (B–E) RT-qPCR for MYH6 (B), MYH7 (C), MYH7/MYH6 (D), and CMTM5 (E) 12 days after repression of each cCRE. A one-way ANOVA with a Dunnett's post hoc test was used to compare gene expression. (F–K) RT-qPCR for MYH6 (F), MYH7 (G), NPPA (H), NPPB (I), TNNT2 (J), and ATP2A2 (K) 15 days following activation of each cCRE in human iPSC-CMs ±1 µM ET-1 for 72 h. A two-way ANOVA with Tukey's post hoc test was used to compare gene expression. (L–Q) RT-qPCR for Myh6 (L), Myh7 (M), Nppa (N), Nppb (O), Tnnt2 (P), and Atp2a2 (Q) 15 days following activation of each cCRE in HL-1 mouse atrial CMs ± norepinephrine and FBS for 48 h. A two-way ANOVA with a Tukey's post hoc test was used to compare gene expression. Relative expression is plotted (n = 3 replicates, mean ± SD). Statistics were calculated on dCt values (normalized to TBP). See also Supplemental Figure S8.