
Abstract
R-loops, RNA:DNA hybrids that often form cotranscriptionally, are emerging as key regulators of genome function, yet their roles in shaping chromatin architecture and developmental potential remain incompletely defined. Here, we use inducible Rnaseh1 expression in mouse embryonic stem cells (mESCs) to achieve short-term, global R-loop depletion and to systematically interrogate their impact on chromatin structure and lineage specification. We find that R-loop loss has a minimal effect on steady-state gene expression or self-renewal. Instead, it leads to a striking reduction in H2A.Z occupancy at both active and bivalent promoters, accompanied by increased nucleosome density, revealing a previously unrecognized role for R-loops in maintaining promoter architecture. During gastruloid differentiation, R-loop-depleted mESCs exhibit accelerated ectodermal differentiation, along with dysregulation of lineage-specific transcription factors and impaired cell–cell signaling. Consistent with these alterations, R-loop-depleted cells show widespread perturbations in gene regulatory networks across several early cell types. These findings uncover a critical role for R-loops in shaping the H2A.Z chromatin landscape and preserving balanced lineage trajectories during early development, offering new insights into the epigenomic regulation of stem cell fate.
Chromatin-associated RNAs are increasingly recognized as key regulators of nuclear processes, including gene expression, RNA processing, and epigenetic modification. These RNAs, such as long noncoding RNAs, enhancer RNAs, and upstream antisense RNAs, often act near their sites of transcription, modulating local chromatin states and transcriptional activity. Although their importance in epigenetic regulation is well established, their biochemical properties pose challenges for functional characterization, and the mechanisms by which they influence chromatin architecture remain incompletely understood.
Among these RNAs, R-loops, typically cotranscriptional RNA:DNA hybrids that displace the nontemplate DNA strand, represent a major and dynamic class of chromatin-associated structures. Although unresolved R-loops are known to induce genome instability through replication–transcription conflicts and increased DNA fragility (Hatchi et al. 2015; Hamperl et al. 2017; Crossley et al. 2019), accumulating evidence suggests that R-loops also play regulatory roles in shaping the epigenome. For example, R-loops can inhibit DNA methylation by blocking DNA methyltransferases (Ginno et al. 2012) or recruiting demethylases (Arab et al. 2019; Sabino et al. 2022). In addition, R-loops promote the recruitment of the RNA methyltransferase METTL3-METTL14, leading to N6-methyladenosine (m6A) modification of RNA transcripts (Zhang et al. 2024), which impacts transcription termination, RNA stability, and translation (Yang et al. 2019; Ding et al. 2023). Finally, R-loops have been shown to colocalize with some active histone modifications, as expected given the requirement for transcription to generate R-loops.
We and others have previously shown that R-loops impact the binding of a few chromatin regulatory enzymes, including the Tip60-p400 histone acetyltransferase and histone exchange factor and the Polycomb Repressive Complex 2 (PRC2) (Chen et al. 2015; Skourti-Stathaki et al. 2019; Alecki et al. 2020). Notably, we previously observed a significant defect in the differentiation capacity of mouse embryonic stem cells (mESCs) that were partially depleted of R-loops (Chen et al. 2015). Despite these findings, a comprehensive understanding of how R-loops influence chromatin structure is lacking. Here we comprehensively investigate the direct roles of R-loops in the regulation of chromatin structure using an inducible Rnaseh1 mESC model to test the short-term effects of R-loop depletion on multiple features of chromatin architecture. Furthermore, to better understand how these perturbations contribute to defects in mESC pluripotency, we examined the impact of R-loop depletion on lineage allocation during differentiation in a gastruloid model.
Results
Short-term R-loop depletion does not disrupt mESC self-renewal or growth
To investigate the role of R-loops in shaping the epigenome in a system in which they are functionally important (Chen et al. 2015), we generated a doxycycline (Dox)-inducible Rnaseh1 (RHKI) mESC line. Although Rnaseh1 overexpression is a widely used method to deplete R-loops by degrading RNA within RNA:DNA hybrids, long-term overexpression can lead to cellular adaptation, potentially obscuring direct effects. To enable short-term and uniform R-loop depletion, we engineered a system using the ZX-1 mESC line, which harbors a targeted rtTA transactivator at the Gt(ROSA)26Sor locus and a Cre-loxP cassette at Hprt1 (Iacovino et al. 2011). We replaced the Cre cassette with Rnaseh1 via recombination (Supplemental Fig. S1A) and validated correct targeting and inducible expression. We determined Rnaseh1 overexpression plateaued at 0.5 µg/mL Dox (Supplemental Fig. S1B) and remained stable for at least 96 h after induction (Fig. 1A). RHKI cells showed no evident differences in doubling time or alkaline phosphatase staining upon Dox addition (Supplemental Fig. S1C,D), suggesting no effect of short-term Rnaseh1 overexpression on mESC proliferation or self-renewal.
Short-term R-loop disruption has minimal effects on mESCs. (A) Western blot of HA-RNASEH1 induction by doxycycline (Dox; 500 ng/mL) at 0, 24, 48, 72, and 96 h of induction. Tubulin is included as a loading control. (B) Disruption of R-loops by short-term induction of Rnaseh1. DRIP-qPCR is shown for several locations after 48 h of Dox treatment. Exogenous RNase H treatment after gDNA isolation is shown as an additional control. Mean and standard error of mean relative to the negative control locus are shown. (***) P < 0.001, (**) P < 0.01, (*) P < 0.05, (n.s.) nonsignificant (two-sided Student's t-test). (C) Changes in gene expression upon short-term Rnaseh1 induction in undifferentiated mESCs. Significance relative to log2 (fold change) measured by RNA-seq (n = 3 replicates per condition) is plotted. Twenty-two downregulated genes (orange) and 11 upregulated genes (blue) (|log2FC| ≥ 0.58, adjusted P-value ≤ 0.05) are indicated. (D) Gene expression of select genes from RNA-seq data. The expression level is transformed through regularized log transformation (rlog). Pou5f1 and Sox2 are genes with no significant changes; Rnaseh1, Hhip, Cdx1, and S100a1 are genes with significant changes upon Rnaseh1 induction.
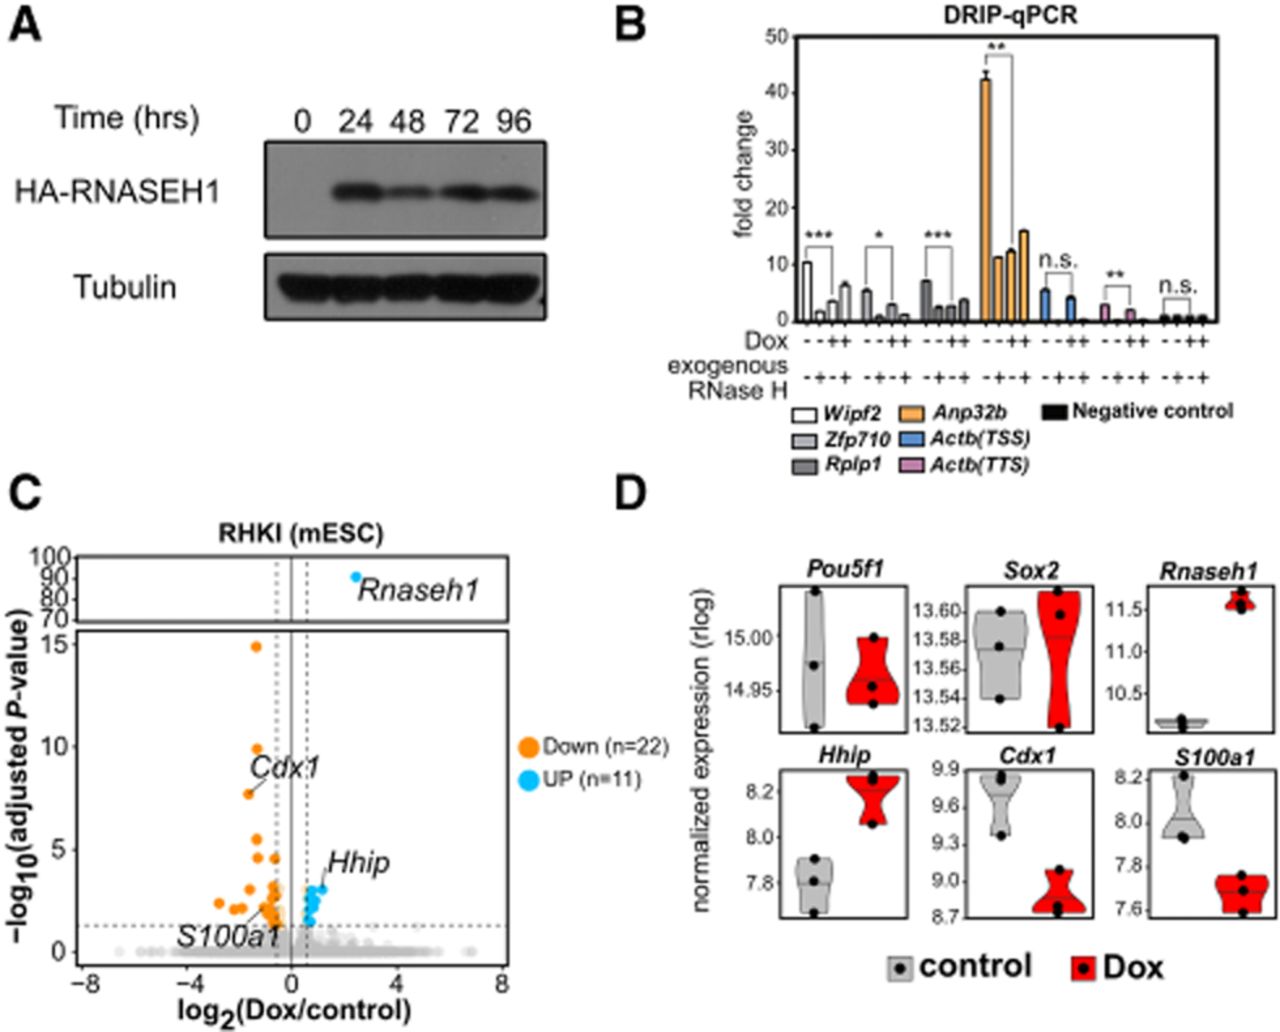
We next assessed R-loop depletion using DNA/RNA immunoprecipitation followed by quantitative PCR (DRIP-qPCR). We observed a moderate reduction in R-loop signal upon Dox addition at several loci, which plateaued at ∼48 h after induction (Fig. 1B; Supplemental Fig. S1E). Similar results were observed using DRIPc-seq (Supplemental Fig. S1F,G). These results are consistent with prior studies using constitutive Rnaseh1 overexpression (Chen et al. 2015; Maul et al. 2017; Pires et al. 2023) and confirm that short-term Rnaseh1 induction partially reduces R-loop levels in mESCs.
To assess transcriptional consequences of R-loop reduction, we performed RNA-seq after 48 h of Dox treatment. Only 33 genes were differentially expressed using a low fold change cutoff to detect even modest changes (|fold change| ≥ 1.5, adjusted P ≤ 0.05) (Fig. 1C; Supplemental Table S1), with no enriched Gene Ontology categories. Pluripotency genes (e.g., Pou5f1, Sox2) were unaffected, although a few developmental regulators (Cdx1, Hhip) showed modest changes (Fig. 1D). These results indicate that short-term R-loop depletion does not disrupt self-renewal or global gene expression but may prime cells for altered differentiation responses.
R-loops maintain promoter-proximal H2A.Z enrichment in mESCs
R-loops have been associated with various epigenetic features, including DNA hypomethylation and histone modifications linked to active transcription, such as H3K4me3 and H3K27ac (Ginno et al. 2012; Sanz et al. 2016; Arab et al. 2019). However, it remains unclear whether R-loops directly regulate these features or simply colocalize with them owing to shared association with transcriptional activity. To address this, we systematically profiled chromatin features following short-term R-loop depletion using CUT&Tag and CUT&RUN.
We observed small but significant changes in several histone marks such as H3K27ac and H3K27me3 (Fig. 2A; Supplemental Fig. S2A). Notably, the H3K27me3 response differed from that seen upon long-term R-loop depletion (Chen et al. 2015), highlighting the utility of short-term Rnaseh1 overexpression. In contrast, we observed a striking reduction in the histone variant H2A.Z occupancy following Rnaseh1 induction (Fig. 2A), which was absent in Dox-treated parental ZX-1 cells (Supplemental Fig. S2B), confirming specificity. In mammals, H2A.Z is typically enriched at transcription start sites (TSSs), including at both the –1 and +1 promoter-flanking nucleosomes, and at some enhancers (Raisner et al. 2005; Barski et al. 2007; Ku et al. 2012). Upon Rnaseh1 induction, H2A.Z occupancy at TSSs was prominently reduced, whereas promoter-distal DNase I hypersensitive sites, used here as a proxy for enhancers, were less strongly affected (Supplemental Fig. S2C).
R-loop depletion causes genome-wide changes in H2A.Z occupancy in mESCs. (A) Enrichment of R-loop-associated epigenetic features. Aggregation plots of indicated features, measured by CUT&Tag (n = 4 replicates for H2A.Z, H3K27me3, and H3K36me3 and n = 2 for all other epitopes), surrounding peak centers from published ChIP-seq data obtained from GEO (H3K4me3 and H3K27ac: GSE31039; H3K27me3: GSE123174; H2A.Z: GSE34483) or metagene profiles over gene bodies (H3K36me3 and RNAP2-S2P). Aggregation plots measuring the mean reads per 10 million were generated for each replicate, and the mean and standard error of mean for all replicates are shown. (***) P < 0.001, determined as described in the Supplemental Methods. (B) Heatmaps illustrating H2A.Z signal across peak centers of H2A.Z-down and H2A.Z-up peaks that differ between control and Dox treatment (defined with fold change of two or more and FDR ≤ 0.05). Two representative replicates of each condition are shown. (C) Quantification of genomic features of peaks belonging to the H2A.Z-up or H2A.Z-down peak set. The distribution of features across the mouse genome, denoted as “genome,” is shown for reference. (D) Dotplot of GO category enrichment of the top 12 GO-terms of genes near H2A.Z-down peaks. A Q-value ≤ 0.05 was used as the cutoff for GO category enrichment. (E) Genome browser tracks illustrating the effect of ectopic Rnaseh1 induction on H2A.Z enrichment. Black bars above gene models indicate significantly changed peaks. Two replicates each for control and Rnaseh1-induced (Dox) mESCs are shown.
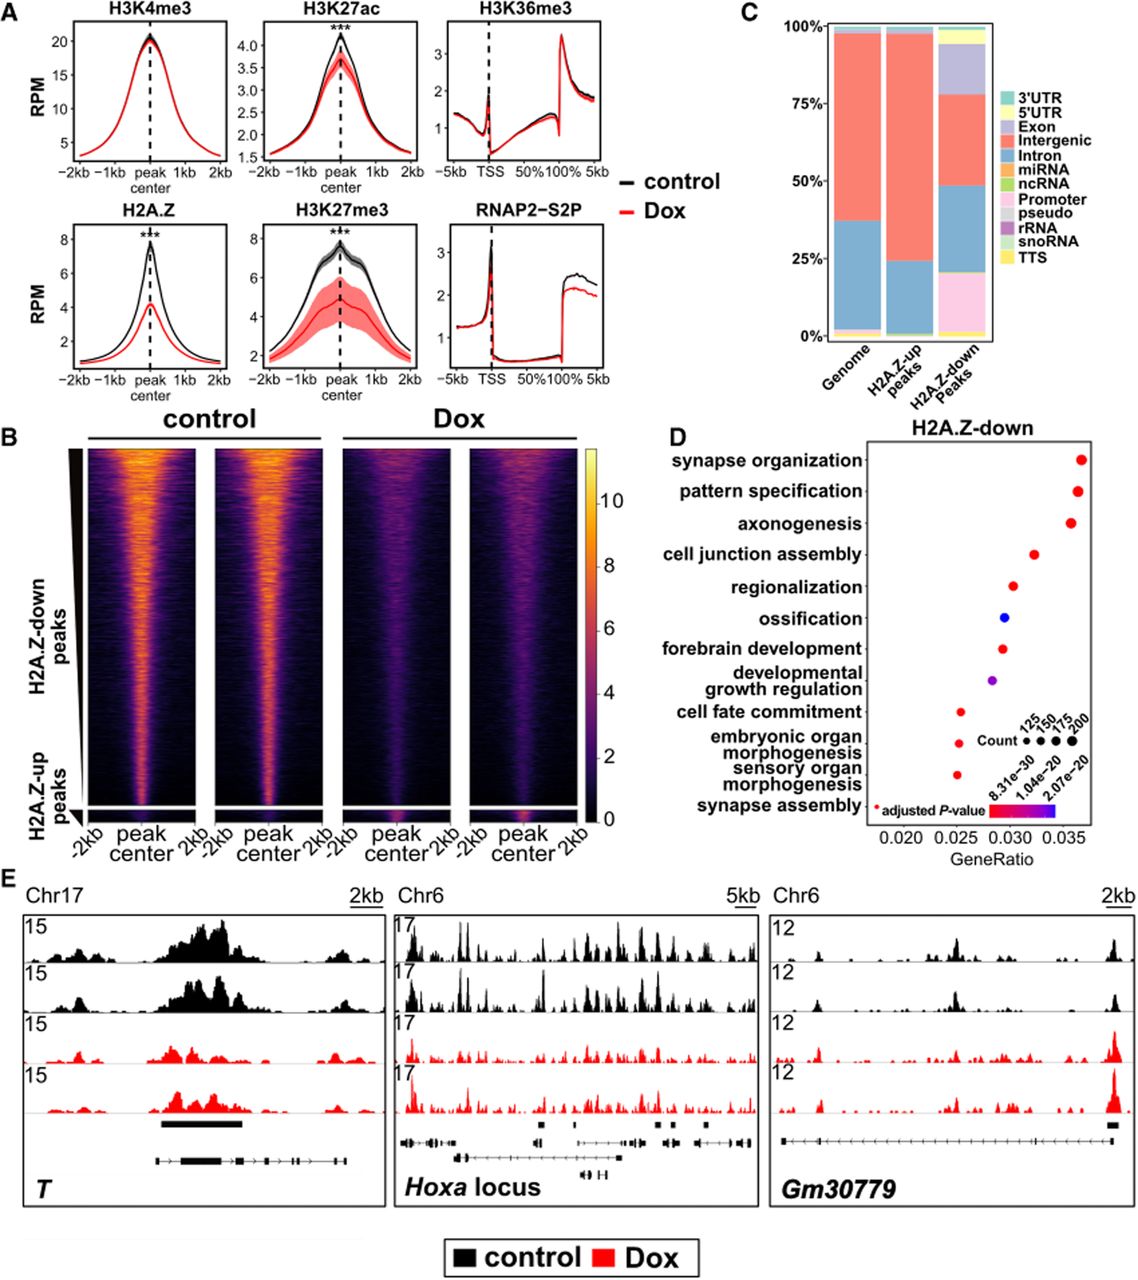
Genome-wide analysis revealed 9077 peaks with significantly reduced H2A.Z occupancy (H2A.Z-down) and only 318 with increased occupancy (H2A.Z-up) out of 61,420 peaks (Fig. 2B). H2A.Z-down peaks were predominantly located at promoter-proximal regions, in contrast to H2A.Z-up peaks (Fig. 2C), suggesting R-loops influence H2A.Z deposition mainly at promoters. R-loops were enriched at H2A.Z-down peaks relative to other H2A.Z peaks (Supplemental Fig. S2D), and R-loop levels were moderately and significantly correlated with Dox-dependent changes in H2A.Z levels (Supplemental Fig. S2E; for example loci, see Supplemental Fig. S2F). Gene Ontology analysis of genes near H2A.Z-down peaks revealed enrichment for developmental- and differentiation-related categories (Fig. 2D), despite low expression of these genes in self-renewing mESCs. Notably, H2A.Z loss was observed at promoters of key developmental regulators, including T and multiple Hoxa cluster genes (Fig. 2E). These findings suggest that R-loops promote H2A.Z accumulation at both lowly expressed and highly expressed genes in mESCs.
R-loops modestly reduce promoter-proximal nucleosome occupancy
R-loops are frequently found near TSSs and transcription termination sites (TTSs). Thus, if R-loops promote nucleosome occupancy surrounding TSSs, their depletion could indirectly reduce H2A.Z enrichment at these sites. To test this, we first performed ATAC-seq to assess changes in chromatin accessibility after short-term Rnaseh1 overexpression. Analysis of subnucleosomal fragments (≤120 bp), which mark nucleosome-free regions, revealed minimal differences: Zero differential ATAC-seq peaks were observed, and the mean signal across all the ATAC-seq peaks was very similar (Fig. 3A; Supplemental Fig. S3A,B). These data suggest that R-loop depletion has a minimal impact on chromatin accessibility.
R-loop disruption increases nucleosome occupancy at active and bivalent genes. (A) Aggregation plot of subnucleosomal ATAC-seq signal (1 to 120 bp fragments) across transcription start sites (TSSs) and TSS-distal DNase I hypersensitive sites (DHS w/o TSS; DNase-seq [GEO]: GSE37074) in control and Rnaseh1-overexpressing mESCs (n = 4 replicates each). Aggregation plots measuring the mean RPM (reads per 10 million) were generated for each replicate, and the mean and standard error of mean for all replicates are shown. (***) P < 0.001, determined as described in the Supplemental Methods. (B) Aggregation plot of MNase-seq signal (n = 2 replicates for each condition) in RPM surrounding the TSSs of high (n = 6166), medium (n = 6180), and low (n = 43,055) expression genes. Mean and standard error of mean are shown. (MN-mono) Mononucleosome-sized fragments (150–200 bp), (MN-sub) subnucleosome-sized fragments (1–120 bp). The three expression categories were determined using bulk-RNA-seq data from control mESCs. (*) P < 0.05, (***) P < 0.001, determined as described in the Supplemental Methods. (C) ChromHMM characterization of chromatin states from the epigenomic profiling data. (Left) Ten states resulting from ChromHMM analysis of all ATAC-seq, CUT&Tag, or CUT&RUN data measured in control mESCs. (Right) Enrichment of genomic features (CpG, TSS, and TTS) in each of the 10 states. (D) Aggregation plots of MN-mono, MN-sub and H2A.Z across active and bivalent promoter regions from ChromHMM. Mean RPM and standard error of mean are shown.
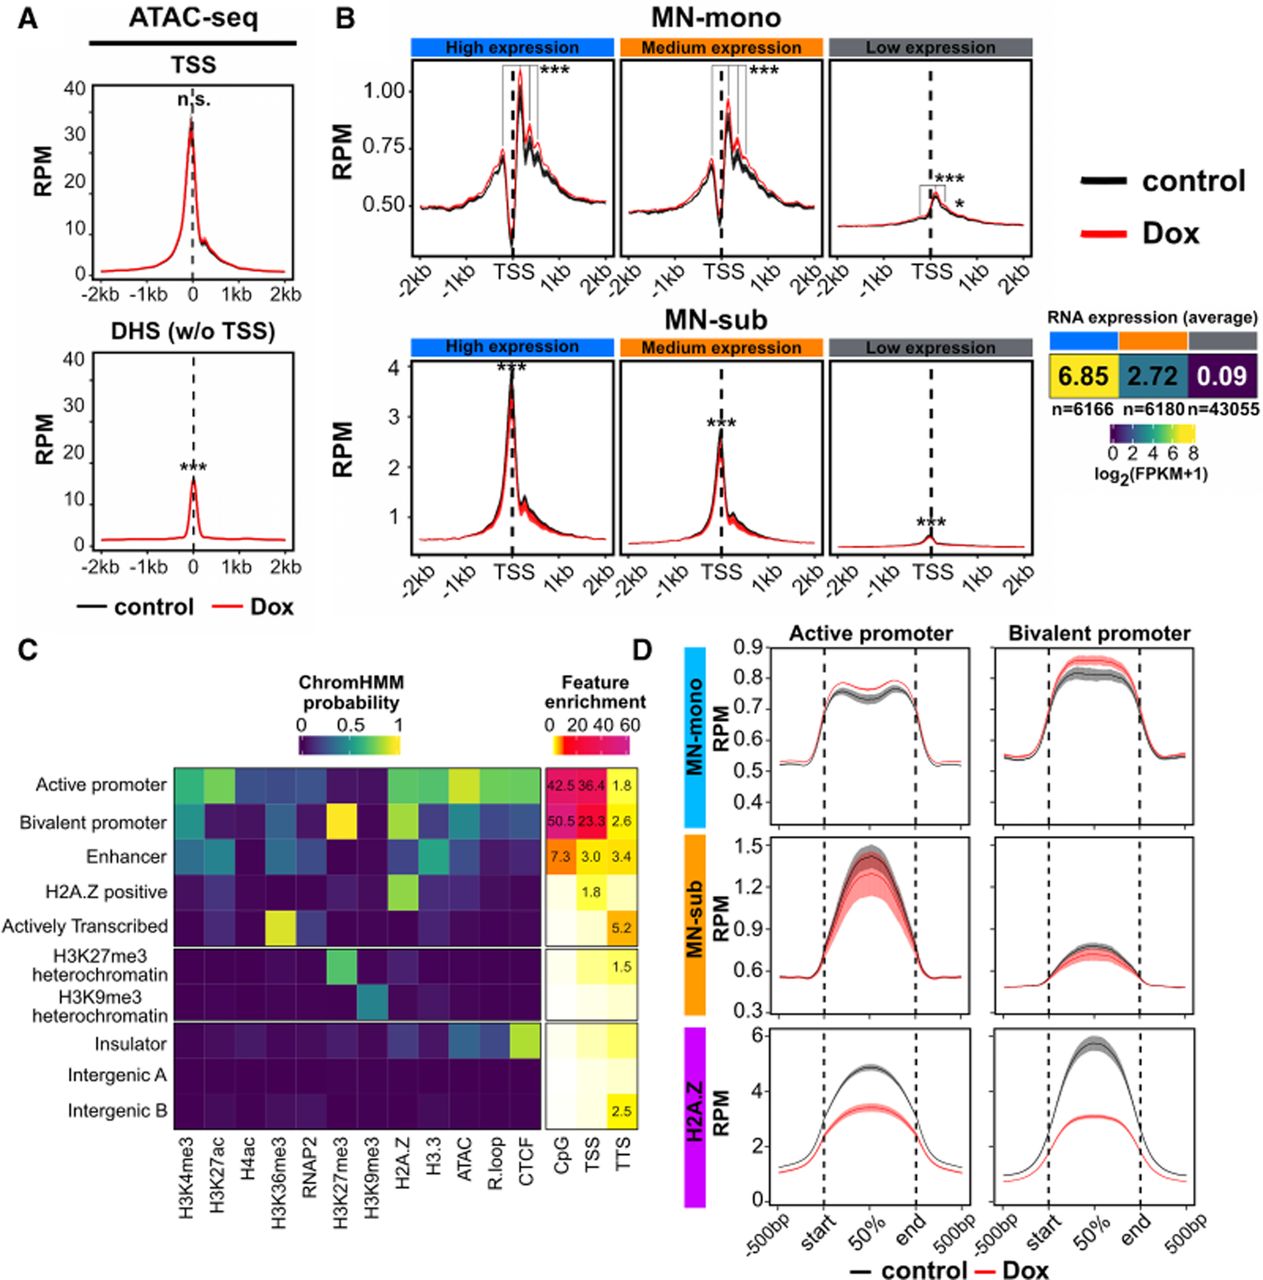
To more directly assess nucleosome positioning and occupancy, we performed MNase-seq, which captures nucleosome footprints across the genome (Lee et al. 2004; Song and Crawford 2010; Hughes and Rando 2014). We carefully titrated MNase digestion to ensure comparable digestion kinetics between conditions (Supplemental Fig. S3C) and analyzed both mononucleosome-sized (MN-mono) fragments (150–200 bp) and subnucleosomal (MN-sub) fragments (≤120 bp) at genes stratified by expression level. MN-sub fragments, which reflect nucleosome-depleted regions, were enriched upstream of TSSs and showed minimal changes upon R-loop depletion (Fig. 3B), consistent with the ATAC-seq results. MN-mono fragments revealed a small but significant increase in promoter-proximal nucleosome occupancy (Fig. 3B), which is also observed at H2A.Z-down peaks and TSSs (Supplemental Fig. S3D).
To further explore the chromatin context of these changes, we trained a ChromHMM model using epigenomic mapping data from control cells, identifying 10 distinct chromatin states (Fig. 3C). Modestly increased MN-mono signal and reduced H2A.Z signal was observed at ChromHMM states corresponding to active and bivalent promoters (Fig. 3D). Bivalent promoters, —marked by both H3K4me3 and H3K27me3, are typically found at developmental genes that are lowly transcribed in mESCs but poised for activation. Notably, these are two of three states characterized by high probability of H2A.Z association and two of three states characterized by the presence of R-loops (Fig. 3C; Supplemental Fig. S3E). In contrast, nucleosome occupancy remained largely unchanged across the remaining eight chromatin states (Supplemental Fig. S3F).
Together, these results demonstrate that R-loops promote H2A.Z enrichment and rule out the possibility that reduced H2A.Z levels result from nucleosome loss. We note that the modest increase in nucleosome occupancy observed upon Rnaseh1 overexpression appears to have little to no effect on gene expression, as evidenced by the minimal changes to the mESC transcriptome upon Dox addition (Fig. 1C). However, given the established role of H2A.Z in early development (Creyghton et al. 2008; Hu et al. 2013; Liu et al. 2022), its reduction at developmental loci may compromise the fidelity of lineage commitment.
R-loop disruption alters expression of key differentiation regulators
Given the observed effects of R-loop reduction on H2A.Z occupancy at promoters of developmental genes, we next investigated how R-loop depletion affects mESC differentiation. Our previous work showed that long-term R-loop disruption impairs exit from pluripotency during embryoid body formation (Chen et al. 2015). To more comprehensively assess lineage specification, we employed a gastruloid differentiation model, in which mESC aggregates are exposed to defined stimuli to form 3D structures that mimic aspects of gastrulation (Beccari et al. 2018; van den Brink and Oudenaarden 2021).
Using RHKI mESCs, we initiated gastruloid differentiation after a 2 day pretreatment with or without Dox (Fig. 4A). Bulk RNA-seq was performed at 72 and 120 h, representing middle and late stages of differentiation. Principal component analysis revealed that differentiation time was the primary driver of variance, with control and R-loop-depleted samples clustering by time point (Supplemental Fig. S1H), indicating that R-loop loss does not block differentiation per se. However, by 120 h, we identified 245 upregulated and 228 downregulated genes in R-loop-depleted gastruloids (Fig. 4B; Supplemental Table S1). Notably, several transcription factors (TFs) critical for lineage specification were differentially expressed, including downregulation of Cdx2 and Foxa2 and upregulation of Neurog3 and Sox5 (Fig. 4B,C). Trunk Hox genes (Hox5–Hox11), essential for posterior development (Gouti et al. 2017; van den Brink and Oudenaarden 2021; Ibarra-Soria et al. 2023), were also downregulated. Additionally, we observed altered expression of key signaling components, including Fgfr4 (FGF pathway) and Wnt5a/Wnt7a (WNT pathway).
Key developmental regulators are dysregulated in gastruloids from R-loop-depleted mESCs. (A) Gastruloid differentiation protocol and collection time points for bulk RNA-seq and scRNA-seq. Rnaseh1 was induced at day –2 for 2 days prior to differentiation. At day 0, cells were replated for gastruloid differentiation (see Methods). At day 2, CHIR was added for 1 day to stimulate WNT signaling. (B) Volcano plot of bulk RNA-seq data (n = 3 replicates per condition) at 120 h of gastruloid differentiation, indicating changes in gene expression upon Rnaseh1 overexpression. Upregulated (n = 228) and downregulated genes (n = 245) are highlighted in blue and orange, respectively (|log2FC| ≥ 0.58, adjusted P-value ≤ 0.05). (C) Example upregulated and downregulated genes at 120 h. Gene expression differences between control and Rnaseh1-overexpressing cells are shown as Z-scores. Three replicates for each condition were performed. (D) Violin plots of examples of upregulated and downregulated genes at 0, 72, and 120 h with a regression line to indicate the temporal expression pattern. Patterns were identified by k-means clustering. (E) Dotplots of GO analysis results showing with top 10 GO-terms for upregulated and downregulated genes. GO categories shown are with a Q-value ≤ 0.05.
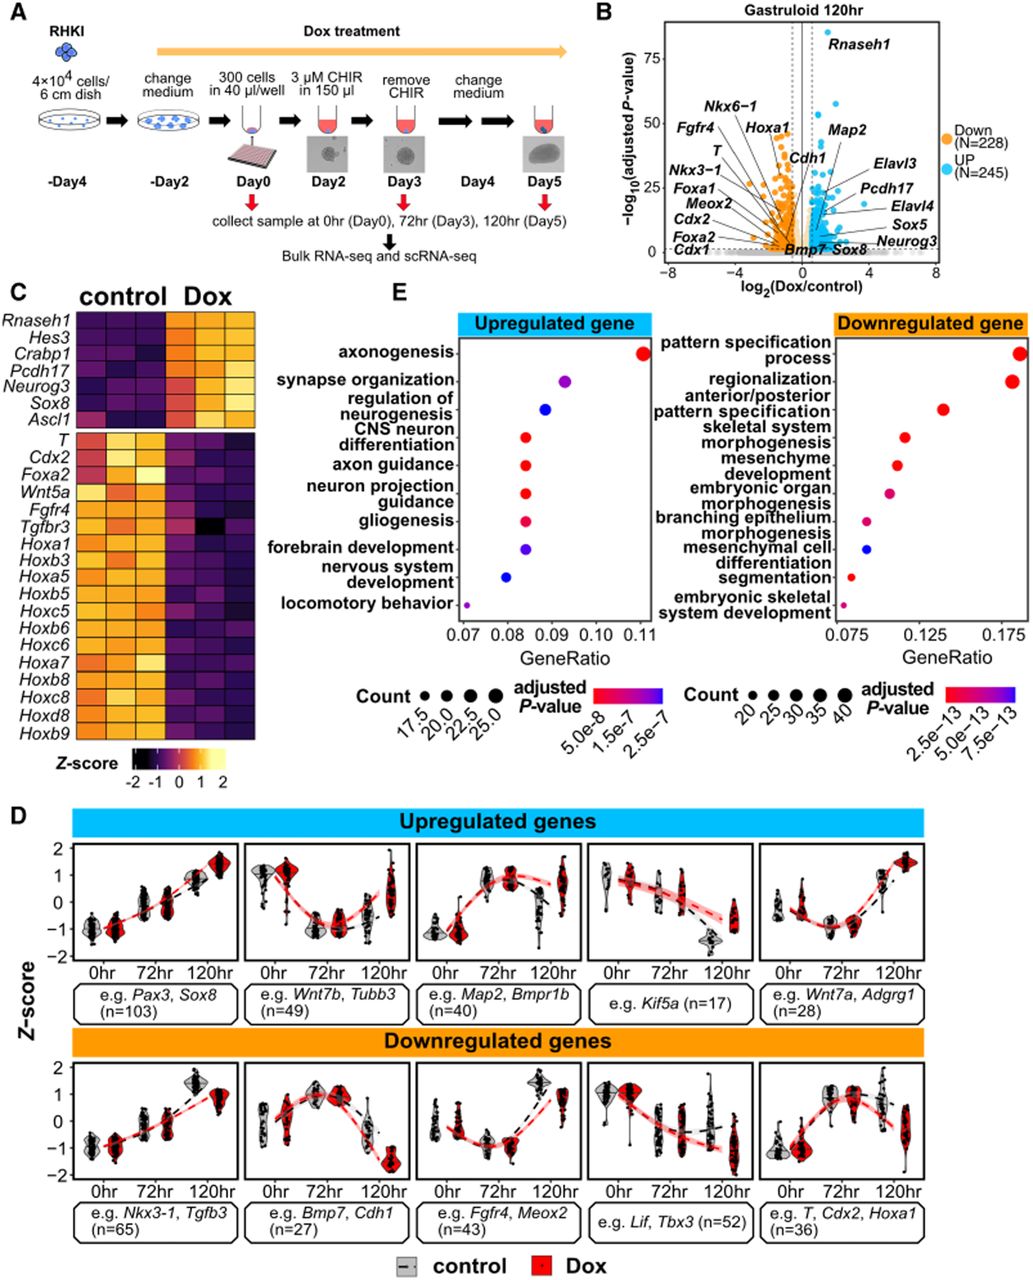
To explore the dynamics of these changes, we classified differentially expressed genes based on their temporal expression trajectories (Fig. 4D). For example, Pax3 and Sox3, which promote neural differentiation, were progressively induced and further elevated in R-loop-depleted cells, whereas other developmental regulators showed reduced expression in the absence of R-loops. Gene Ontology analysis revealed that upregulated genes were enriched for neuronal differentiation, whereas downregulated genes were associated with pattern specification and somite development (Fig. 4E). These findings suggest that R-loop depletion may selectively alter differentiation trajectories and/or rates, enhancing differentiation along ectodermal/neural pathways relative to mesodermal and endodermal lineages. However, bulk RNA-seq cannot identify the steps at which differentiation is altered or identify which cell types are most affected.
Distinct effects of R-loop disruption on different cell lineages during mESC differentiation
To directly assess whether R-loop depletion alters lineage specification, we performed single-cell RNA sequencing (scRNA-seq) during gastruloid differentiation in the presence or absence of Rnaseh1 overexpression, using the same differentiation protocol as for bulk RNA-seq. This approach enabled high-resolution profiling of cell states and developmental trajectories.
We integrated our scRNA-seq data with two published gastruloid data sets (Rosen et al. 2022; Suppinger et al. 2023) for joint analysis. After applying a unified preprocessing pipeline (see Methods), we observed strong concordance across data sets, with overlapping cell clusters in UMAP space (Supplemental Fig. S4A,B). Minor differences were attributable to differences in sampling time points; for example, our 0 h samples (undifferentiated mESCs) were unique to our study, whereas 72 and 120 h samples clustered closely with published data. To annotate cell types, we leveraged reference scRNA-seq data from mouse embryos (E3.5–E8.5) (Mohammed et al. 2017; Cheng et al. 2019; Pijuan-Sala et al. 2019; Qiu et al. 2022) and used CellMatch (Kearns et al. 2023) to assign gastruloid clusters to embryonic cell types (Supplemental Fig. S4C). We identified clusters corresponding to all three germ layers: ectoderm (e.g., caudal neuroectoderm, neuromesodermal progenitors [NMPs], spinal cord, neuron-like cells), mesoderm (e.g., primitive streak, paraxial mesoderm, splanchnic mesoderm), and endoderm (e.g., definitive endoderm/gut) (Fig. 5A,B). All clusters were present in both control and R-loop-depleted samples and expressed expected marker genes (Supplemental Fig. S4D; Supplemental Table S2), confirming their identities.
R-loop depletion alters differentiation in gastruloids. (A) Clusters of scRNA-seq data composed of two published data sets combined with control and Dox-induced RHKI cells from this study, shown as a UMAP. Cell type annotations are shown in B. (NMP) Neuromesodermal progenitors. (B) UMAP of scRNA-seq from RHKI across three time points (n = 2 for 0 h and n = 4 for 72 h and 120 h), split by treatment condition: control (left) and Dox (center). Cell annotations are indicated to the right. (C, bottom) Sankey plot showing the lineage trajectory of control scRNA-seq data. (Top) Simplified lineage diagram with dotted lines indicating the cell types corresponding to each germ layer or early progenitor. (D) Proportions of total cells in control and Dox conditions at 120 h of gastruloid differentiation. Colors correspond to cell types shown in C. (E) Violin plots of differentially expressed genes (DEGs) between control and Dox conditions for different differentiated cell types. DEGs were called as described in the Methods with adjusted P-values ≤ 0.05, |log2FC| ≥ 0.58, and the percentage of expressed cells ≥0.25. (PS) Primitive streak, (caudal NE) caudal neuroectoderm, (NMP) Neuromesodermal progenitor, (PSM-A) paraxial mesoderm A, (PSM-B) paraxial mesoderm B, (SM) splanchnic mesoderm. (F,G) Violin plots of critical genes among cell types in ectoderm trajectory (F) and genes related to retinoic acid signaling among NMP/spinal cord and PSM/SM (G). (*) adjusted P-value < 0.05, (***) adjusted P-value < 0.001.
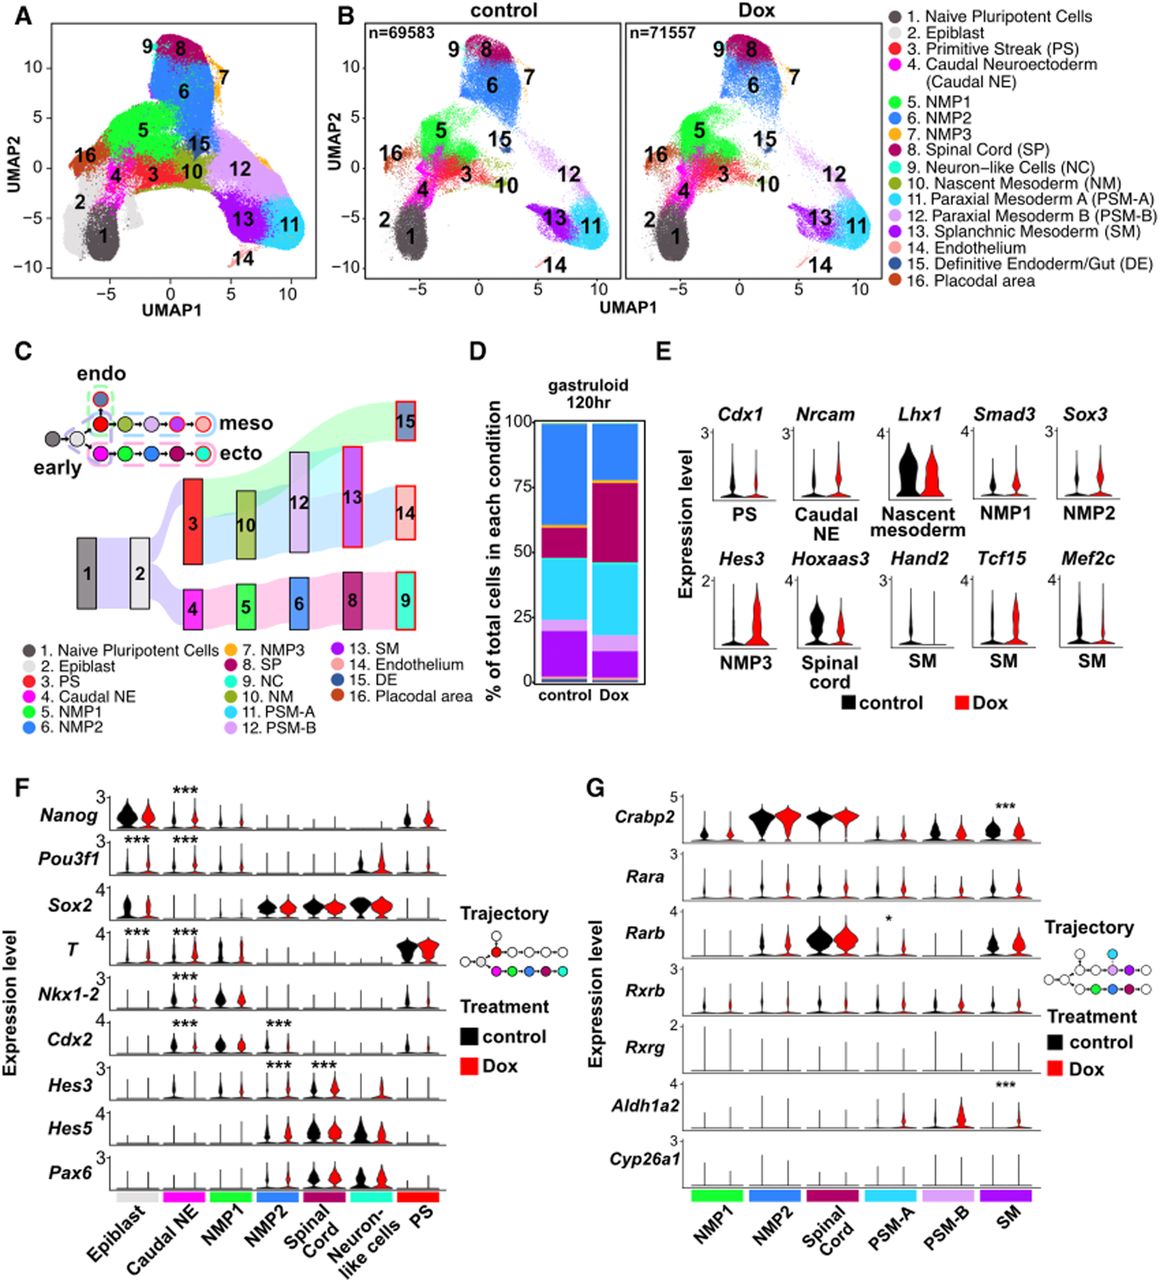
To explore lineage dynamics, we performed trajectory inference by integrating our data with time-resolved gastruloid data sets and applying a modified pyVIA algorithm that incorporates both transcriptomic similarity and time point information. This analysis reconstructed a comprehensive differentiation map with three major germ layer trajectories and revealed key lineage decision points (Fig. 5C; Supplemental Fig. S5A). Comparing transition probabilities between conditions, we found that R-loop depletion increased transitions from epiblast to caudal neuroectoderm and from spinal cord to neuron-like cells (Supplemental Fig. S5B). These changes were reflected in altered lineage proportions: NMP1 was modestly overrepresented in R-loop-depleted samples at 72 h, whereas NMP2 and spinal cord were overrepresented at 120 h (Fig. 5D; Supplemental Fig. S5C,D), suggesting accelerated differentiation toward neural fates. These findings indicate that R-loop loss perturbs early lineage decisions, accelerating ectodermal differentiation relative to mesoderm and endoderm.
R-loop depletion alters expression of lineage-specific TFs
To uncover the factors driving alterations in mESC differentiation, we examined TF expression across cell types. Many TFs critical for lineage specification were differentially expressed upon Rnaseh1 induction (Supplemental Table S3). In many cases, although only a modest difference in fold change was observed for key TFs in different cell types, we observed a more prominent change to the proportion of cells expressing the TF. For example, Klf2 was expressed in a smaller proportion of epiblast cells in Dox (46%) relative to control (63%), as was the case for Cdx1 in the primitive streak (33% in Dox; 45% in control). Conversely, Mxi1 was expressed in a larger fraction of paraxial mesoderm A cells in Dox conditions (Fig. 5E; Supplemental Fig. S5E; Supplemental Table S3). In splanchnic mesoderm, we observed reduced expression of Hand2 and Mef2c, two TFs essential for cardiac development (Lin et al. 1997; Liu et al. 2009; Miquerol and Kelly 2013; Anderson et al. 2017), suggesting compromised mesodermal potential.
Given that the first alterations in differentiation appear to originate at the epiblast stage, we closely examined TF expression at this transition point. Pou3f1, a neural-promoting TF expressed early in neurogenesis, was upregulated in both epiblast and caudal neuroectoderm in R-loop-depleted cells (Fig. 5F). Its early induction may contribute to the accelerated ectodermal differentiation. NMPs, which coexpress Sox2 and T, can adopt neural or mesodermal fates depending on the relative expression of these factors (Chalamalasetty et al. 2011). Although we did not capture the double-positive NMP state, the trajectory analysis indicated a transition from NMP1 to NMP2, characterized by increased Sox2 and decreased T expression, suggesting neuronal fate commitment of the NMPs. This transition was accompanied by upregulation of downstream neural TFs such as Hes3, Hes5, and Pax6, further supporting ectodermal commitment. We also observed downregulation of TFs involved in posterior axial patterning and early lineage specification, including Nkx1-2, Cdx1, and Cdx2. Interestingly, T expression was elevated in caudal neuroectoderm, which may enhance NMP formation and contribute to altered lineage dynamics (Henrique et al. 2015).
Together, these findings reveal that R-loop depletion induces cell type–specific changes in key lineage-specific TFs, consistent with the observed shifts in lineage allocation. These results highlight a previously unrecognized role for R-loops in regulating transcriptional programs that control early cell fate decisions.
Elevated retinoic acid signaling reinforces lineage differences in R-loop-depleted gastruloids
During gastrulation, WNT signaling is essential for primitive streak formation and anterior–posterior patterning (Morgani and Hadjantonakis 2019). In gastruloids, treatment with the WNT agonist CHIR99021 is critical for elongation and spatial patterning of lineage-specific gene expression (van den Brink et al. 2014; Cermola et al. 2021; Suppinger et al. 2023). In this system, alteration of growth factor exposure or simulation of cell–cell communication (CCC) can drive gastruloid differentiation toward specialized subtypes of gastruloids (Rossi et al. 2021, 2022; van den Brink and Oudenaarden 2021).
Given the observed lineage-specific differentiation changes in R-loop-depleted gastruloids, we therefore investigated whether altered CCC contributes to this phenotype. Differential expression analysis revealed significant changes in genes involved in intercellular signaling. For example, Fgfr1 (FGF/MAPK pathway) was dysregulated in multiple mesodermal populations; Notch1 and Notch2 were altered in paraxial mesoderm; and TFs such as Smad3 and Tcf7l1, which mediate TGFB and WNT signaling, were also affected (Fig. 5E; Supplemental Fig. S5F,G).
Notably, genes involved in retinoic acid (RA) signaling, a pathway critical for neuronal commitment of NMPs, were significantly altered. Aldh1a2, encoding the enzyme responsible for RA synthesis, was upregulated in mesodermal populations, whereas Cyp26a1, encoding a protein that degrades RA, remained low in both mesoderm and ectoderm (Fig. 5G). This imbalance suggests RA signaling from mesoderm to ectoderm may be enhanced in Rnaseh1-overexpressing gastruloids. High expression of the RA adaptor gene Crabp2 in NMP2 and spinal cord cells further supports increased RA signaling in ectodermal lineages. Slight upregulation of Rarb in mesoderm also suggests increased RA responsiveness, which may inhibit paraxial mesoderm differentiation (Russell et al. 2018).
To directly assess CCC changes, we used CellChat (Jin et al. 2021, 2025) to infer ligand–receptor interactions between cell types. This analysis revealed increased RA signaling from mesodermal populations (PSM-A, PSM-B) to ectodermal lineages (NMP2, spinal cord) in R-loop-depleted gastruloids (Fig. 6A). The most significantly enhanced interaction was Aldh1a2–(Crabp2–Rarb) (Fig. 6B; Supplemental Fig. S6A), suggesting a mesoderm-to-ectoderm RA signaling axis that reinforces neural fate commitment. Additional changes in FGF, Notch, and TGFB signaling were also observed (Supplemental Fig. S6B). Together, these findings suggest that altered CCC, particularly increased RA-mediated signaling, contributes to the ectodermal acceleration observed in R-loop-depleted gastruloids.
Alterations in signaling and lineage-specific gene regulatory networks (GRNs) in R-loop-depleted gastruloids. (A) The heatmap of communication probability of retinoic acid (RA) signaling among mesoderm cells (PSM-A, PSM-B, SM) and ectoderm cells (NMP1, NMP2, spinal cord). The sources and targets of inferred RA signaling are indicated. (B) The communication probabilities of indicated ligand-receptor pairs in RA signaling from PSM-A to mesoderm cell types (PSM-A, PSM-B, SM) and ectodermal cell types (NMP1, NMP2, spinal cord). (C) Barplots depicting the proportion of targets in the indicated module related to the total target in each specific cell type/treatment combination. (D) Network plots illustrating TF–target relationships in the Rarb module for spinal cord. The trajectory diagram highlights the cell type in the trajectory map. “Unique” edges indicate TF–target pairs that only exist in a specific combination of cell type and treatment, shown with a dashed line, whereas solid lines denote nonunique pairs. Edge thickness indicates the correlation strength of the TF–target pair. The line color of each edge indicates a positive or negative correlation between TF and its targets. (E) Dotplot of GO analysis results for target genes in the Rarb module. Shared targets indicate genes are positively correlated and shared between control and Dox. A Q-value ≤ 0.05 was used as the cutoff for GO category enrichment. (F) Network plots illustrating TF–target relationships in the Hand1, Hand2, and Mef2c modules for splanchnic mesoderm. Labels are as in D. (G) Dotplot of GO analysis results for target gene categories in Mef2c module. The positively correlated, control-specific targets (left) and the targets shared between the control and Dox (right) are shown. A Q-value ≤ 0.05 was used as the cutoff for GO category enrichment.

R-loop depletion rewires gene regulatory networks to promote neuronal differentiation
To understand how altered CCC and TF activity contribute to altered differentiation, we reconstructed gene regulatory networks (GRNs) using scMTNI (Zhang et al. 2023), incorporating trajectory information to improve inference. Because of limited cell numbers in several terminal cell types, we focused on intermediate cell types.
We first examined GRN changes at the early bifurcation from epiblast to either caudal neuroectoderm or primitive streak. Upon Rnaseh1 induction, we observed an increase in predicted T target genes across the early lineages (Supplemental Fig. S6C), which remained after normalizing for total edges (Fig. 6C). We also observed expansion of Sox11, Cdx2, and Pou3f1 regulatory modules in caudal neuroectoderm, alongside a reduction in the Nkx1-2 module. Although WNT signaling is required for T induction, correlation analysis among T, Lef1, Tcf7l1, and Nkx1-2 (Tamashiro et al. 2012) did not reveal major differences between conditions (Supplemental Fig. S6D), suggesting that altered WNT responsiveness is not the primary driver of T upregulation.
Consistent with enhanced RA signaling, the Rarb module was modestly expanded in spinal cord cells upon R-loop depletion (Fig. 6D). Shared Rarb targets were enriched for sensory system development, whereas Dox-specific targets included Dlg2 and Crabp2, genes involved in neuronal differentiation and RA signaling, respectively (Fig. 6E; Supplemental Fig. S6E; Sanders et al. 2022). These findings support a model in which RA signaling reinforces ectodermal fate commitment. In contrast, splanchnic mesoderm cells showed reduced expression of cardiogenic TF genes, Hand2 and Mef2c (Fig. 5E), and GRN analysis revealed a marked reduction in Hand1, Hand2, and, especially, Mef2c target modules (Fig. 6F). GO analysis of Mef2c targets unique to control cells showed enrichment for muscle development, whereas shared targets were associated with cardiac development (Fig. 6G; Supplemental Fig. S6F), suggesting impaired cardiogenic potential in R-loop-depleted cells.
Together, these results demonstrate that R-loop depletion leads to widespread GRN rewiring, accelerating neuronal gene programs relative to mesodermal and cardiogenic regulatory networks. These changes likely underlie the enrichment of differentiated ectodermal cell types and reduced mesodermal differentiation observed in R-loop-depleted gastruloids.
Discussion
R-loops are required for normal H2A.Z localization in mESCs
In this study, we used an inducible Rnaseh1 overexpression system to investigate the role of R-loops in chromatin regulation and mESC differentiation. Unlike previous studies that relied on long-term Rnaseh1 overexpression, which are potentially confounded by cellular adaptation or transgene silencing, our system allowed us to examine the short-term consequences of R-loop depletion. Despite the broad potential of RNASEH1 to target RNA/DNA hybrids, short-term R-loop depletion had minimal effects on steady-state mRNA levels or self-renewal, suggesting that the observed chromatin changes are direct consequences of R-loop loss. Notably, R-loop depletion was partial (twofold to threefold or less reduction at many genes), consistent with prior studies (Chen et al. 2015; Maul et al. 2017) and may therefore underestimate the full impact of R-loops on chromatin architecture.
Although most chromatin features, including histone modifications, RNA Polymerase II occupancy, and overall chromatin accessibility, were largely unaffected, we observed a pronounced reduction in H2A.Z occupancy at ∼20% of H2A.Z peaks and a small increase in nucleosome occupancy. These changes were evident at both highly expressed genes and bivalent genes, many of which regulate developmental programs. Considering the modest effect on steady-state mRNA levels in mESCs depleted of R-loops, this suggests that neither the small effect on nucleosome occupancy nor the larger effect on promoter-proximal H2A.Z levels has a major effect on mESC gene expression during self-renewal. However, given that H2A.Z is essential for proper differentiation (Hu et al. 2013), R-loops appear to facilitate mESC differentiation by maintaining H2A.Z levels at key regulatory genes. This aligns with our previous observation that Rnaseh1 overexpression reduces binding of Tip60-p400 (Chen et al. 2015), a chromatin remodeling complex involved in H2A.Z deposition. To date, the mechanism linking R-loops to Tip60-p400 function remains unclear, as no physical interaction between RNA/DNA hybrids and any Tip60-p400 and SRCAP component was detected in a previous survey of RNA/DNA hybrid binding proteins (Wu et al. 2021b). Thus, we speculate that R-loops indirectly promote H2A.Z deposition by Tip60-p400 and/or SRCAP through temporarily interfering with nucleosome formation, thus creating a nucleosome-free span of DNA favorable for the binding and/or activity of one or both enzymes.
R-loop disruption in mESCs alters the repertoire of differentiation outcomes
To explore the functional consequences of R-loop depletion, we used the gastruloid model to examine differentiation across all three germ layers. Bulk RNA-seq revealed dysregulation of key developmental genes, including Cdx2 and multiple Hox genes, many of which were also marked by R-loop-dependent H2A.Z occupancy in mESCs. scRNA-seq enabled reconstruction of differentiation trajectories that were consistent with prior gastruloid studies (Rosen et al. 2022; Suppinger et al. 2023), as well as embryonic development (Tani et al. 2020). Notably, R-loop depletion altered early lineage decisions, with increased expression of TFs such as Pou3f1 and T in epiblast and caudal neuroectoderm, along with rewiring of the T GRN. At later stages, we observed elevated RA signaling from the mesoderm to ectoderm, likely reinforcing ectodermal commitment. RA-related genes such as Crabp2 were upregulated, and GRN analysis revealed expansion of Rarb modules in spinal cord cells. In contrast, cardiogenic networks driven by Hand2 and Mef2c were diminished, suggesting impaired mesodermal potential. These findings highlight how R-loops influence not only chromatin architecture but also downstream functions such as transcriptional networks and intercellular signaling pathways that coordinate lineage specification.
Together, our results demonstrate that R-loops are critical for establishing chromatin states that prime developmental genes for activation and for maintaining balanced lineage trajectories during early differentiation. Although dispensable for self-renewal, R-loops are essential for robust multilineage potential. Future studies using lineage-specific R-loop depletion or in vivo models will be important to dissect the temporal- and context-specific roles of R-loops in development.
Limitations of the study
The study of R-loop functions is limited by imperfect tools available for both mapping and perturbation of R-loops in cells. We employed an inducible allele of Rnaseh1 to facilitate conditional R-loop depletion, but R-loop reduction was only partial and required 1–2 days to deplete R-loops at the loci we examined. Consequently, the effects of R-loops during differentiation may be owing to a combination of effects in mESCs and in various differentiation progenitors. Multiple approaches for mapping R-loops have been described but have been shown to exhibit limited overlap in the locations of R-loops identified by each, especially at genes with medium to low expression (Mukhopadhyay et al. 2024). In addition, categorization of genomic loci by changes in epigenomic features, such as H2A.Z-down regions, creates a binary distinction between loci with significant changes in H2A.Z levels upon R-loop disruption and those that were not significant. This implies (often incorrectly) that loci not classified as H2A.Z-down or H2A.Z-up are unchanged and may introduce error when quantifying other epigenetic features at H2A.Z-down, H2A.Z-up, and “other” loci. Although our study indicates R-loops are important for normal H2A.Z deposition in mESCs, the mechanisms underlying this requirement are unknown. Finally, although the gastruloid model of differentiation exhibits some features of developing embryos, mESC differentiation in gastruloids is not equivalent to development in vivo. Consequently, the functions of R-loops in developing embryos in vivo may be somewhat different from those inferred from the altered differentiation profiles in this study. Finally, it should be noted that our bulk and scRNA-seq measurements capture mRNA levels, not nascent transcription, leaving open the possibility that post-transcriptional mechanisms play a role in the observed changes in mRNA levels upon R-loop depletion.
Methods
Cell culture
ZX-1 cells (gift from Michael Kyba) (Iacovino et al. 2011) were maintained in standard ESC medium (high-glucose DMEM, 10% FBS, glutamine, MEM NEAA, β-mercaptoethanol, and LIF) on feeder cells. For feeder-free culture, cells were gradually adapted with reduction of feeder cells as well as switching to 2i/LIF medium (NDiff 227 with LIF, 2% FBS, 3 µM CHIR-99021, 1 µM PD0325901) on gelatin-coated dishes. ZX-1 and RHKI cells were passaged every other day using Accutase and plated at 2–2.5 × 10⁵ cells per 6 cm dish at 5% CO2, 37°C. Details of RHKI cell line generation and validation are provided in the Supplemental Methods.
Gastruloid differentiation
RHKI cells were differentiated into gastruloids as previously described (Baillie-Johnson et al. 2015; Cermola et al. 2021), with minor modifications. Briefly, cells were seeded at 300 cells/well in NDiff 277 medium in U-bottom 96-well plates. CHIR-99021 (3 µM) was added on day 2, and medium was refreshed on days 3 and 4. For Rnaseh1 induction, 0.5 µg/mL Dox was added from day –2 to day 5. Samples were collected at days 0, 3, and 5 for RNA-seq and scRNA-seq. Full protocol details are provided in the Supplemental Methods.
Protein extraction and western blotting
Cell pellets were lysed in buffer containing 50 mM Tris-HCl (pH 7.5), 250 mM NaCl, 3 mM EDTA, 3 mM EGTA, 1% Triton X-100, 0.5% NP-40, and 10% glycerol supplemented with 1× Halt protease inhibitor (Thermo Fisher Scientific). After a 15 min incubation on ice, lysates were centrifuged at 15,000g for 15 min at 4°C. The supernatant was used for protein quantification (Bio-Rad), followed by boiling in protein loading dye prior to SDS-PAGE and western blot analysis. Primary antibodies were used at the following dilutions: anti-tubulin (Abcam, 1:5000) and anti-HA (Cell Signaling, 1:1000); secondary antibodies, goat antirabbit HRP were diluted 1:5000.
RNA extraction and RNA-seq
Total RNA was extracted using the Direct-zol RNA microprep kit (Zymo) with on-column DNase I digestion. Bulk RNA-seq libraries were prepared using the Illumina stranded mRNA prep kit and sequenced on a NovaSeq (PE150). For scRNA-seq, gastruloids were dissociated with Accutase, and single-cell suspensions were processed using the 10x Genomics Chromium Next GEM single cell 3′ kit. Libraries were sequenced on a NovaSeq targeting 20,000 reads per cell. Details of bulk and scRNA-seq sample processing are provided in the Supplemental Methods.
DRIP-qPCR and DRIPc-seq
DRIP was performed as previously described (Sanz and Chédin 2019; Dowling et al. 2024) with minor modifications. Genomic DNA from RHKI cells (±Dox) was extracted, digested with restriction enzymes, and treated with RNase III. DNA was immunoprecipitated using the S9.6 antibody, and enrichment was quantified by qPCR. For DRIPc-seq, IPed RNA/DNA hybrids were digested with DNase I, libraries were prepared using a NEBNext Ultra II directional RNA library prep kit, and sequenced on a NovaSeq. Oligonucleotides used in this study are included in Supplemental Table S4. Full protocol details are provided in the Supplemental Methods.
CUT&RUN and MapR
CUT&RUN and MapR were performed following established protocols (Hainer and Fazzio 2019; Yan and Sarma 2020) using anti-CTCF and RHΔ-MNase, respectively. Briefly, cells were bound to Concanavalin A (ConA) beads, incubated with primary antibodies or fusion proteins, and subjected to targeted chromatin digestion. Libraries were prepared using a modified NEBNext Ultra II protocol and sequenced on a NovaSeq (PE150). Detailed procedures, including digestion conditions, library prep modifications, and sequencing parameters, are provided in the Supplemental Methods.
CUT&Tag
CUT&Tag was performed as described previously (Kaya-Okur et al. 2019), using antibodies against H3K4me3, H3K27me3, H3K27ac, H3K36me3, H4ac, H3.3, and phospho-Rpb1(Ser2). Briefly, cells were bound to ConA beads, incubated with primary and secondary antibodies, and treated with pA-Tn5 transposase. Libraries were prepared using Nextera primers and sequenced on a NovaSeq (PE150). Full protocol details are provided in the Supplemental Methods.
ATAC-seq
ATAC-seq was performed following established protocols (Buenrostro et al. 2015; Corces et al. 2017). Cells were lysed and tagmented with Tn5, and DNA was purified and amplified. Libraries were gel-purified, QC'd, and sequenced (NovaSeq PE150; 10–20 million reads per library). For full details, see the Supplemental Methods.
MNase-seq
MNase-seq was conducted as previously described (Henikoff et al. 2011). Cells were fixed; nuclei were isolated and digested with varying MNase concentrations; and DNA was purified. Libraries were gel-purified and sequenced (NovaSeq PE150; 50–60 million reads per library). Detailed procedures are included in the Supplemental Methods.
Data analysis
Chromatin profiling data analysis
CUT&RUN, CUT&Tag, MapR, DRIPc-seq, ATAC-seq, and MNase-seq data were processed using standard pipelines. Reads were trimmed with Trimmomatic (Bolger et al. 2014), aligned to the mm10 genome using Bowtie 2 (Langmead and Salzberg 2012), and filtered for quality and duplicates. bigWig files were generated with deepTools (Ramírez et al. 2016) or bedGraphToBigWig (Kent et al. 2010), and peak calling was performed using HOMER (Heinz et al. 2010). Differential peaks were identified using HOMER and annotated with BEDTools (Quinlan and Hall 2010) and clusterProfiler (Wu et al. 2021a). For MNase-seq, reads were stratified by fragment size, and merged BAMs were used to assess nucleosome occupancy. Chromatin states were inferred using ChromHMM (Ernst and Kellis 2012), and visualizations were generated with deepTools, HOMER, and ggplot2 (Wickham 2016). Full pipeline details are provided on GitHub and in the Supplemental Code (see below).
Bulk RNA-seq analysis
Reads were trimmed with Trimmomatic and aligned to mm10 (with annotation; GENCODE vM25) using STAR (Dobin et al. 2013). Gene-level quantification was performed with RSEM (Li and Dewey 2011), and differential expression was assessed using DESeq2 (Soneson et al. 2016). Genes with an adjusted P-value ≤ 0.05 and |log2FC| ≥ 0.58 were considered differentially expressed. PCA, heatmaps, and violin plots were generated in R (R Core Team 2022). Gene Ontology enrichment was performed using clusterProfiler. Time course expression trends were analyzed using DEGreport (https://www.bioconductor.org/packages/release/bioc/html/DEGreport.html). Full pipeline details are provided on GitHub and in the Supplemental Code (see below).
scRNA-seq analysis
Raw reads were aligned to the mm10 genome (mm10-2020) using Cell Ranger (10x Genomics), and gene count matrices were processed using Seurat and SCANPY (Wolf et al. 2018; Hao et al. 2021, 2024). Doublets were identified with DoubletFinder (McGinnis et al. 2019), and cells were filtered based on mitochondrial content, feature count, and cell cycle scores. PCA were performed with using Harmony for batch effect correction (Korsunsky et al. 2019), followed by UMAP reduction for visualization and clustering with PARC from pyVIA (Stassen et al. 2021). Cell types were annotated using CellMatch and validated against published gastruloid and embryonic data sets. Trajectory inference was performed using pyVIA, integrating real time point information from our data set and two published references.
Pseudotime was initially inferred at the cluster level using pyVIA, achieving ≥70% correlation with real time points. Single-cell pseudotime was then refined using Margaret (Pandey and Zafar 2022), leveraging the same adjacency matrix and time point alignment strategy. For comparisons between control and Dox-treated samples, pseudotime distributions and trajectory weights were analyzed without time-series constraints to avoid the bias owing to limited time points in our data set. Differential gene expression was assessed using MAST (Finak et al. 2015) with subsampling to control for cell number differences. CCC was inferred using CellChat (Jin et al. 2021, 2025) with CellChatDB.mouse as the collection of ligand-receptor pairs.
GRNs were inferred using a multistep approach combining SCENIC and scMTNI, which incorporated trajectory information during GRN inference (Aibar et al. 2017; Zhang et al. 2023). Baseline GRNs were constructed from control data (ours and published), stratified by cell type, and refined through repeated subsampling. Final GRNs for control and Dox-treated conditions were derived from robust TF–target edges conserved across subsamples. Functional differences were assessed via overlap and GO enrichment analyses. Full pipeline details are provided on GitHub and in the Supplemental Code (see below).
Code availability
Full pipeline details and scripts are provided on GitHub, accessible through Zenodo (https://doi.org/10.5281/zenodo.15603611) and as Supplemental Code.
Data access
Raw data generated in this study have been submitted to the NCBI Gene Expression Omnibus (GEO; https://www.ncbi.nlm.nih.gov/) under accession numbers GSE299105 (ATAC-seq), GSE299106 (CUT&RUN and MapR), GSE299108 (MNase-seq), GSE299110 (bulk RNA-seq), GSE299112 (scRNA-seq), GSE299115 (CUT&Tag), GSE299350 (ZX-1 CUT&Tag), and GSE314560 (DRIPc-seq).
Competing interest statement
The authors declare no competing interests.
Acknowledgments
We thank Michael Kyba for ZX-1 cells. We thank I.-H. Wang for advice on analysis of scRNA-seq data. We thank J. Benanti, A. Herchenröther, S. Gopalan, E. Hass, T. Basak, and P. Gautam for critical comments on the manuscript. This work was funded by grants R01HD072122 and R01HD104971 from the National Institute of Child Health and Human Development (National Institutes of Health).
Author contributions: C.-H.C. helped conceive of the study, designed experiments, performed all experiments, performed all data analyses, prepared all figures, and helped draft the manuscript. T.G.F. acquired funding; helped conceive, design, and oversee the study; and helped draft the manuscript.
Notes
[1] Supplementary material [Supplemental material is available for this article.]
[2] Article published online before print. Article, supplemental material, and publication date are at https://www.genome.org/cgi/doi/10.1101/gr.281088.125.
[3] Freely available online through the Genome Research Open Access option.
References
- ↵Aibar S, González-Blas CB, Moerman T, Huynh-Thu VA, Imrichova H, Hulselmans G, Rambow F, Marine J-C, Geurts P, Aerts J, 2017. SCENIC: single-cell regulatory network inference and clustering. Nat Methods 14: 1083–1086. 10.1038/nmeth.4463
- ↵Alecki C, Chiwara V, Sanz LA, Grau D, Pérez OA, Boulier EL, Armache K-J, Chédin F, Francis NJ. 2020. RNA-DNA strand exchange by the Drosophila Polycomb complex PRC2. Nat Commun 11: 1781. 10.1038/s41467-020-15609-x
- ↵Anderson CM, Hu J, Thomas R, Gainous TB, Celona B, Sinha T, Dickel DE, Heidt AB, Xu S-M, Bruneau BG, 2017. Cooperative activation of cardiac transcription through myocardin bridging of paired MEF2 sites. Development 144: 1235–1241. 10.1242/dev.138487
- ↵Arab K, Karaulanov E, Musheev M, Trnka P, Schäfer A, Grummt I, Niehrs C. 2019. GADD45A binds R-loops and recruits TET1 to CpG island promoters. Nat Genet 51: 217–223. 10.1038/s41588-018-0306-6
- ↵Baillie-Johnson P, van den Brink SC, Balayo T, Turner DA, Martinez Arias A. 2015. Generation of aggregates of mouse embryonic stem cells that show symmetry breaking, polarization and emergent collective behaviour in vitro. J Vis Exp (105): 53252. 10.3791/53252
- ↵Barski A, Cuddapah S, Cui K, Roh T-Y, Schones DE, Wang Z, Wei G, Chepelev I, Zhao K. 2007. High-resolution profiling of histone methylations in the human genome. Cell 129: 823–837. 10.1016/j.cell.2007.05.009
- ↵Beccari L, Moris N, Girgin M, Turner DA, Baillie-Johnson P, Cossy A-C, Lutolf MP, Duboule D, Arias AM. 2018. Multi-axial self-organization properties of mouse embryonic stem cells into gastruloids. Nature 562: 272–276. 10.1038/s41586-018-0578-0
- ↵Bolger AM, Lohse M, Usadel B. 2014. Trimmomatic: a flexible trimmer for Illumina sequence data. Bioinformatics 30: 2114–2120. 10.1093/bioinformatics/btu170
- ↵Buenrostro JD, Wu B, Chang HY, Greenleaf WJ. 2015. ATAC-seq: a method for assaying chromatin accessibility genome-wide. Curr Protoc Mol Biol 109: 21.29.1–21.29.9. 10.1002/0471142727.mb2129s109
- ↵Cermola F, D'Aniello C, Tatè R, Cesare DD, Martinez-Arias A, Minchiotti G, Patriarca EJ. 2021. Gastruloid development competence discriminates different states of pluripotency. Stem Cell Rep 16: 354–369. 10.1016/j.stemcr.2020.12.013
- ↵Chalamalasetty RB, Dunty WC, Biris KK, Ajima R, Iacovino M, Beisaw A, Feigenbaum L, Chapman DL, Yoon JK, Kyba M, 2011. The Wnt3a/β-catenin target gene Mesogenin1 controls the segmentation clock by activating a notch signalling program. Nat Commun 2: 390. 10.1038/ncomms1381
- ↵Chen PB, Chen HV, Acharya D, Rando OJ, Fazzio TG. 2015. R loops regulate promoter-proximal chromatin architecture and cellular differentiation. Nat Struct Mol Biol 22: 999–1007. 10.1038/nsmb.3122
- ↵Cheng S, Pei Y, He L, Peng G, Reinius B, Tam PPL, Jing N, Deng Q. 2019. Single-cell RNA-seq reveals cellular heterogeneity of pluripotency transition and X chromosome dynamics during early mouse development. Cell Rep 26: 2593–2607.e3. 10.1016/j.celrep.2019.02.031
- ↵Corces MR, Trevino AE, Hamilton EG, Greenside PG, Sinnott-Armstrong NA, Vesuna S, Satpathy AT, Rubin AJ, Montine KS, Wu B, 2017. An improved ATAC-seq protocol reduces background and enables interrogation of frozen tissues. Nat Methods 14: 959–962. 10.1038/nmeth.4396
- ↵Creyghton MP, Markoulaki S, Levine SS, Hanna J, Lodato MA, Sha K, Young RA, Jaenisch R, Boyer LA. 2008. H2AZ is enriched at polycomb complex target genes in ES cells and is necessary for lineage commitment. Cell 135: 649–661. 10.1016/j.cell.2008.09.056
- ↵Crossley MP, Bocek M, Cimprich KA. 2019. R-loops as cellular regulators and genomic threats. Mol Cell 73: 398–411. 10.1016/j.molcel.2019.01.024
- ↵Ding S-Q, Zhang X-P, Pei J-P, Bai X, Ma J-J, Zhang C-D, Dai D-Q. 2023. Role of N6-methyladenosine RNA modification in gastric cancer. Cell Death Discov 9: 241. 10.1038/s41420-023-01485-z
- ↵Dobin A, Davis CA, Schlesinger F, Drenkow J, Zaleski C, Jha S, Batut P, Chaisson M, Gingeras TR. 2013. STAR: ultrafast universal RNA-seq aligner. Bioinformatics 29: 15–21. 10.1093/bioinformatics/bts635
- ↵Dowling JW, Smith JR, Forero A. 2024. Protocol for detection of in vitro R-loop formation using dot blots. STAR Protoc 5: 102857. 10.1016/j.xpro.2024.102857
- ↵Ernst J, Kellis M. 2012. ChromHMM: automating chromatin-state discovery and characterization. Nat Methods 9: 215–216. 10.1038/nmeth.1906
- ↵Finak G, McDavid A, Yajima M, Deng J, Gersuk V, Shalek AK, Slichter CK, Miller HW, McElrath MJ, Prlic M, 2015. MAST: a flexible statistical framework for assessing transcriptional changes and characterizing heterogeneity in single-cell RNA sequencing data. Genome Biol 16: 278. 10.1186/s13059-015-0844-5
- ↵Ginno PA, Lott PL, Christensen HC, Korf I, Chédin F. 2012. R-loop formation is a distinctive characteristic of unmethylated human CpG island promoters. Mol Cell 45: 814–825. 10.1016/j.molcel.2012.01.017
- ↵Gouti M, Delile J, Stamataki D, Wymeersch FJ, Huang Y, Kleinjung J, Wilson V, Briscoe J. 2017. A gene regulatory network balances neural and mesoderm specification during vertebrate trunk development. Dev Cell 41: 243–261.e7. 10.1016/j.devcel.2017.04.002
- ↵Hainer SJ, Fazzio TG. 2019. High-resolution chromatin profiling using CUT&RUN. Curr Protoc Mol Biol 126: e85. 10.1002/cpmb.85
- ↵Hamperl S, Bocek MJ, Saldivar JC, Swigut T, Cimprich KA. 2017. Transcription-replication conflict orientation modulates R-loop levels and activates distinct DNA damage responses. Cell 170: 774–786.e19. 10.1016/j.cell.2017.07.043
- ↵Hao Y, Hao S, Andersen-Nissen E, Mauck WM, Zheng S, Butler A, Lee MJ, Wilk AJ, Darby C, Zager M, 2021. Integrated analysis of multimodal single-cell data. Cell 184: 3573–3587.e29. 10.1016/j.cell.2021.04.048
- ↵Hao Y, Stuart T, Kowalski MH, Choudhary S, Hoffman P, Hartman A, Srivastava A, Molla G, Madad S, Fernandez-Granda C, 2024. Dictionary learning for integrative, multimodal and scalable single-cell analysis. Nat Biotechnol 42: 293–304. 10.1038/s41587-023-01767-y
- ↵Hatchi E, Skourti-Stathaki K, Ventz S, Pinello L, Yen A, Kamieniarz-Gdula K, Dimitrov S, Pathania S, McKinney KM, Eaton ML, 2015. BRCA1 recruitment to transcriptional pause sites is required for R-loop-driven DNA damage repair. Mol Cell 57: 636–647. 10.1016/j.molcel.2015.01.011
- ↵Heinz S, Benner C, Spann N, Bertolino E, Lin YC, Laslo P, Cheng JX, Murre C, Singh H, Glass CK. 2010. Simple combinations of lineage-determining transcription factors prime cis-regulatory elements required for macrophage and B cell identities. Mol Cell 38: 576–589. 10.1016/j.molcel.2010.05.004
- ↵Henikoff JG, Belsky JA, Krassovsky K, MacAlpine DM, Henikoff S. 2011. Epigenome characterization at single base-pair resolution. Proc Natl Acad Sci 108: 18318–18323. 10.1073/pnas.1110731108
- ↵Henrique D, Abranches E, Verrier L, Storey KG. 2015. Neuromesodermal progenitors and the making of the spinal cord. Development 142: 2864–2875. 10.1242/dev.119768
- ↵Hu G, Cui K, Northrup D, Liu C, Wang C, Tang Q, Ge K, Levens D, Crane-Robinson C, Zhao K. 2013. H2A.Z facilitates access of active and repressive complexes to chromatin in embryonic stem cell self-renewal and differentiation. Cell Stem Cell 12: 180–192. 10.1016/j.stem.2012.11.003
- ↵Hughes AL, Rando OJ. 2014. Mechanisms underlying nucleosome positioning in vivo. Annu Rev Biophysics 43: 41–63. 10.1146/annurev-biophys-051013-023114
- ↵Iacovino M, Bosnakovski D, Fey H, Rux D, Bajwa G, Mahen E, Mitanoska A, Xu Z, Kyba M. 2011. Inducible cassette exchange: a rapid and efficient system enabling conditional gene expression in embryonic stem and primary cells. Stem Cells 29: 1580–1588. 10.1002/stem.715
- ↵Ibarra-Soria X, Thierion E, Mok GF, Münsterberg AE, Odom DT, Marioni JC. 2023. A transcriptional and regulatory map of mouse somite maturation. Dev Cell 58: 1983–1995.e7. 10.1016/j.devcel.2023.07.003
- ↵Jin S, Guerrero-Juarez CF, Zhang L, Chang I, Ramos R, Kuan C-H, Myung P, Plikus MV, Nie Q. 2021. Inference and analysis of cell-cell communication using CellChat. Nat Commun 12: 1088. 10.1038/s41467-021-21246-9
- ↵Jin S, Plikus MV, Nie Q. 2025. CellChat for systematic analysis of cell–cell communication from single-cell transcriptomics. Nat Protoc 20: 180–219. 10.1038/s41596-024-01045-4
- ↵Kaya-Okur HS, Wu SJ, Codomo CA, Pledger ES, Bryson TD, Henikoff JG, Ahmad K, Henikoff S. 2019. CUT&Tag for efficient epigenomic profiling of small samples and single cells. Nat Commun 10: 1930. 10.1038/s41467-019-09982-5
- ↵Kearns NA, Lobo M, Genga RMJ, Abramowitz RG, Parsi KM, Min J, Kernfeld EM, Huey JD, Kady J, Hennessy E, 2023. Generation and molecular characterization of human pluripotent stem cell-derived pharyngeal foregut endoderm. Dev Cell 58: 1801–1818.e15. 10.1016/j.devcel.2023.08.024
- ↵Kent WJ, Zweig AS, Barber G, Hinrichs AS, Karolchik D. 2010. BigWig and BigBed: enabling browsing of large distributed datasets. Bioinformatics 26: 2204–2207. 10.1093/bioinformatics/btq351
- ↵Korsunsky I, Millard N, Fan J, Slowikowski K, Zhang F, Wei K, Baglaenko Y, Brenner M, Loh P, Raychaudhuri S. 2019. Fast, sensitive and accurate integration of single-cell data with Harmony. Nat Methods 16: 1289–1296. 10.1038/s41592-019-0619-0
- ↵Ku M, Jaffe JD, Koche RP, Rheinbay E, Endoh M, Koseki H, Carr SA, Bernstein BE. 2012. H2a.Z landscapes and dual modifications in pluripotent and multipotent stem cells underlie complex genome regulatory functions. Genome Biol 13: R85. 10.1186/gb-2012-13-10-r85
- ↵Langmead B, Salzberg SL. 2012. Fast gapped-read alignment with Bowtie 2. Nat Methods 9: 357–359. 10.1038/nmeth.1923
- ↵Lee C-K, Shibata Y, Rao B, Strahl BD, Lieb JD. 2004. Evidence for nucleosome depletion at active regulatory regions genome-wide. Nat Genet 36: 900–905. 10.1038/ng1400
- ↵Li B, Dewey CN. 2011. RSEM: accurate transcript quantification from RNA-seq data with or without a reference genome. BMC Bioinformatics 12: 323. 10.1186/1471-2105-12-323
- ↵Lin Q, Schwarz J, Bucana C, Olson EN. 1997. Control of mouse cardiac morphogenesis and myogenesis by transcription factor MEF2C. Science 276: 1404–1407. 10.1126/science.276.5317.1404
- ↵Liu N, Barbosa AC, Chapman SL, Bezprozvannaya S, Qi X, Richardson JA, Yanagisawa H, Olson EN. 2009. DNA binding-dependent and -independent functions of the Hand2 transcription factor during mouse embryogenesis. Development 136: 933–942. 10.1242/dev.034025
- ↵Liu X, Zhang J, Zhou J, Bu G, Zhu W, He H, Sun Q, Yu Z, Xiong W, Wang L, 2022. Hierarchical accumulation of histone variant H2A.Z regulates transcriptional states and histone modifications in early mammalian embryos. Adv Sci 9: 2200057. 10.1002/advs.202200057
- ↵Maul RW, Chon H, Sakhuja K, Cerritelli SM, Gugliotti LA, Gearhart PJ, Crouch RJ. 2017. R-loop depletion by over-expressed RNase H1 in mouse B cells increases activation-induced deaminase access to the transcribed strand without altering frequency of isotype switching. J Mol Biol 429: 3255–3263. 10.1016/j.jmb.2016.12.020
- ↵McGinnis CS, Murrow LM, Gartner ZJ. 2019. DoubletFinder: doublet detection in single-cell RNA sequencing data using artificial nearest neighbors. Cell Syst 8: 329–337.e4. 10.1016/j.cels.2019.03.003
- ↵Miquerol L, Kelly RG. 2013. Organogenesis of the vertebrate heart. Wiley Interdiscip Rev Dev Biol 2: 17–29. 10.1002/wdev.68
- ↵Mohammed H, Hernando-Herraez I, Savino A, Scialdone A, Macaulay I, Mulas C, Chandra T, Voet T, Dean W, Nichols J, 2017. Single-cell landscape of transcriptional heterogeneity and cell fate decisions during mouse early gastrulation. Cell Rep 20: 1215–1228. 10.1016/j.celrep.2017.07.009
- ↵Morgani SM, Hadjantonakis A-K. 2019. Signaling regulation during gastrulation: insights from mouse embryos and in vitro systems. Curr Top Dev Biol 137: 391–431. 10.1016/bs.ctdb.2019.11.011
- ↵Mukhopadhyay P, Miller H, Stoja A, Bishop AJR. 2024. Approaches for mapping and analysis of R-loops. Curr Protoc 4: e1037. 10.1002/cpz1.1037
- ↵Pandey K, Zafar H. 2022. Inference of cell state transitions and cell fate plasticity from single-cell with MARGARET. Nucleic Acids Res 50: e86. 10.1093/nar/gkac412
- ↵Pijuan-Sala B, Griffiths JA, Guibentif C, Hiscock TW, Jawaid W, Calero-Nieto FJ, Mulas C, Ibarra-Soria X, Tyser RCV, Ho DLL, 2019. A single-cell molecular map of mouse gastrulation and early organogenesis. Nature 566: 490–495. 10.1038/s41586-019-0933-9
- ↵Pires VB, Lohner N, Wagner T, Wagner CB, Wilkens M, Hajikazemi M, Paeschke K, Butter F, Luke B. 2023. RNA-DNA hybrids prevent resection at dysfunctional telomeres. Cell Rep 42: 112077. 10.1016/j.celrep.2023.112077
- ↵Qiu C, Cao J, Martin BK, Li T, Welsh IC, Srivatsan S, Huang X, Calderon D, Noble WS, Disteche CM, 2022. Systematic reconstruction of cellular trajectories across mouse embryogenesis. Nat Genet 54: 328–341. 10.1038/s41588-022-01018-x
- ↵Quinlan AR, Hall IM. 2010. BEDTools: a flexible suite of utilities for comparing genomic features. Bioinformatics 26: 841–842. 10.1093/bioinformatics/btq033
- ↵Raisner RM, Hartley PD, Meneghini MD, Bao MZ, Liu CL, Schreiber SL, Rando OJ, Madhani HD. 2005. Histone variant H2A.Z marks the 5′ ends of both active and inactive genes in euchromatin. Cell 123: 233–248. 10.1016/j.cell.2005.10.002
- ↵Ramírez F, Ryan DP, Grüning B, Bhardwaj V, Kilpert F, Richter AS, Heyne S, Dündar F, Manke T. 2016. deepTools2: a next generation web server for deep-sequencing data analysis. Nucleic Acids Res 44: W160–W165. 10.1093/nar/gkw257
- ↵R Core Team. 2022. R: a language and environment for statistical computing. R Foundation for Statistical Computing, Vienna. https://www.R-project.org/.
- ↵Rosen LU, Stapel LC, Argelaguet R, Barker CG, Yang A, Reik W, Marioni JC. 2022. Inter-gastruloid heterogeneity revealed by single cell transcriptomics time course: implications for organoid based perturbation studies. bioRxiv 10.1101/2022.09.27.509783
- ↵Rossi G, Broguiere N, Miyamoto M, Boni A, Guiet R, Girgin M, Kelly RG, Kwon C, Lutolf MP. 2021. Capturing cardiogenesis in gastruloids. Cell Stem Cell 28: 230–240.e6. 10.1016/j.stem.2020.10.013
- ↵Rossi G, Giger S, Hübscher T, Lutolf MP. 2022. Gastruloids as in vitro models of embryonic blood development with spatial and temporal resolution. Sci Rep 12: 13380. 10.1038/s41598-022-17265-1
- ↵Russell RP, Fu Y, Liu Y, Maye P. 2018. Inverse agonism of retinoic acid receptors directs epiblast cells into the paraxial mesoderm lineage. Stem Cell Res 30: 85–95. 10.1016/j.scr.2018.05.016
- ↵Sabino JC, de Almeida MR, Abreu PL, Ferreira AM, Caldas P, Domingues MM, Santos NC, Azzalin CM, Grosso AR, de Almeida SF. 2022. Epigenetic reprogramming by TET enzymes impacts co-transcriptional R-loops. eLife 11: e69476. 10.7554/eLife.69476
- ↵Sanders B, D'Andrea D, Collins MO, Rees E, Steward TGJ, Zhu Y, Chapman G, Legge SE, Pardiñas AF, Harwood AJ, 2022. Transcriptional programs regulating neuronal differentiation are disrupted in DLG2 knockout human embryonic stem cells and enriched for schizophrenia and related disorders risk variants. Nat Commun 13: 27. 10.1038/s41467-021-27601-0
- ↵Sanz LA, Chédin F. 2019. High-resolution, strand-specific R-loop mapping via S9.6-based DNA–RNA immunoprecipitation and high-throughput sequencing. Nat Protoc 14: 1734–1755. 10.1038/s41596-019-0159-1
- ↵Sanz LA, Hartono SR, Lim YW, Steyaert S, Rajpurkar A, Ginno PA, Xu X, Chédin F. 2016. Prevalent, dynamic, and conserved R-loop structures associate with specific epigenomic signatures in mammals. Mol Cell 63: 167–178. 10.1016/j.molcel.2016.05.032
- ↵Skourti-Stathaki K, Triglia ET, Warburton M, Voigt P, Bird A, Pombo A. 2019. R-loops enhance polycomb repression at a subset of developmental regulator genes. Mol Cell 73: 930–945.e4. 10.1016/j.molcel.2018.12.016
- ↵Soneson C, Love MI, Robinson MD. 2016. Differential analyses for RNA-seq: transcript-level estimates improve gene-level inferences. F1000Res 4: 1521. 10.12688/f1000research.7563.2
- ↵Song L, Crawford GE. 2010. DNase-seq: a high-resolution technique for mapping active gene regulatory elements across the genome from mammalian cells. Cold Spring Harb Protoc 2010: pdb.prot5384. 10.1101/pdb.prot5384
- ↵Stassen SV, Yip GGK, Wong KKY, Ho JWK, Tsia KK. 2021. Generalized and scalable trajectory inference in single-cell omics data with VIA. Nat Commun 12: 5528. 10.1038/s41467-021-25773-3
- ↵Suppinger S, Zinner M, Aizarani N, Lukonin I, Ortiz R, Azzi C, Stadler MB, Vianello S, Palla G, Kohler H, 2023. Multimodal characterization of murine gastruloid development. Cell Stem Cell 30: 867–884.e11. 10.1016/j.stem.2023.04.018
- ↵Tamashiro DAA, Alarcon VB, Marikawa Y. 2012. Nkx1-2 is a transcriptional repressor and is essential for the activation of Brachyury in P19 mouse embryonal carcinoma cell. Differentiation 83: 282–292. 10.1016/j.diff.2012.02.010
- ↵Tani S, Chung U, Ohba S, Hojo H. 2020. Understanding paraxial mesoderm development and sclerotome specification for skeletal repair. Exp Mol Med 52: 1166–1177. 10.1038/s12276-020-0482-1
- ↵van den Brink SC, van Oudenaarden A. 2021. 3D gastruloids: a novel frontier in stem cell-based in vitro modeling of mammalian gastrulation. Trends Cell Biol 31: 747–759. 10.1016/j.tcb.2021.06.007
- ↵van den Brink SC, Baillie-Johnson P, Balayo T, Hadjantonakis A-K, Nowotschin S, Turner DA, Arias AM. 2014. Symmetry breaking, germ layer specification and axial organisation in aggregates of mouse embryonic stem cells. Development 141: 4231–4242. 10.1242/dev.113001
- ↵Wickham H. 2016. ggplot2: elegant graphics for data analysis. Springer-Verlag, New York. https://ggplot2.tidyverse.org.
- ↵Wolf FA, Angerer P, Theis FJ. 2018. SCANPY: large-scale single-cell gene expression data analysis. Genome Biol 19: 15. 10.1186/s13059-017-1382-0
- ↵Wu T, Hu E, Xu S, Chen M, Guo P, Dai Z, Feng T, Zhou L, Tang W, Zhan L, 2021a. clusterProfiler 4.0: a universal enrichment tool for interpreting omics data. Innovation 2: 100141. 10.1016/j.xinn.2021.100141
- ↵Wu T, Nance J, Chu F, Fazzio TG. 2021b. Characterization of R-loop–interacting proteins in embryonic stem cells reveals roles in rRNA processing and gene expression. Mol Cell Proteomics 20: 100142. 10.1016/j.mcpro.2021.100142
- ↵Yan Q, Sarma K. 2020. MapR: a method for identifying native R-loops genome wide. Curr Protoc Mol Biol 130: e113. 10.1002/cpmb.113
- ↵Yang X, Liu Q-L, Xu W, Zhang Y-C, Yang Y, Ju L-F, Chen J, Chen Y-S, Li K, Ren J, 2019. m6A promotes R-loop formation to facilitate transcription termination. Cell Res 29: 1035–1038. 10.1038/s41422-019-0235-7
- ↵Zhang S, Pyne S, Pietrzak S, Halberg S, McCalla SG, Siahpirani AF, Sridharan R, Roy S. 2023. Inference of cell type-specific gene regulatory networks on cell lineages from single cell omic datasets. Nat Commun 14: 3064. 10.1038/s41467-023-38637-9
- ↵Zhang J, Chen F, Tang M, Xu W, Tian Y, Liu Z, Shu Y, Yang H, Zhu Q, Lu X, 2024. The ARID1A-METTL3-m6A axis ensures effective RNase H1-mediated resolution of R-loops and genome stability. Cell Rep 43: 113779. 10.1016/j.celrep.2024.113779