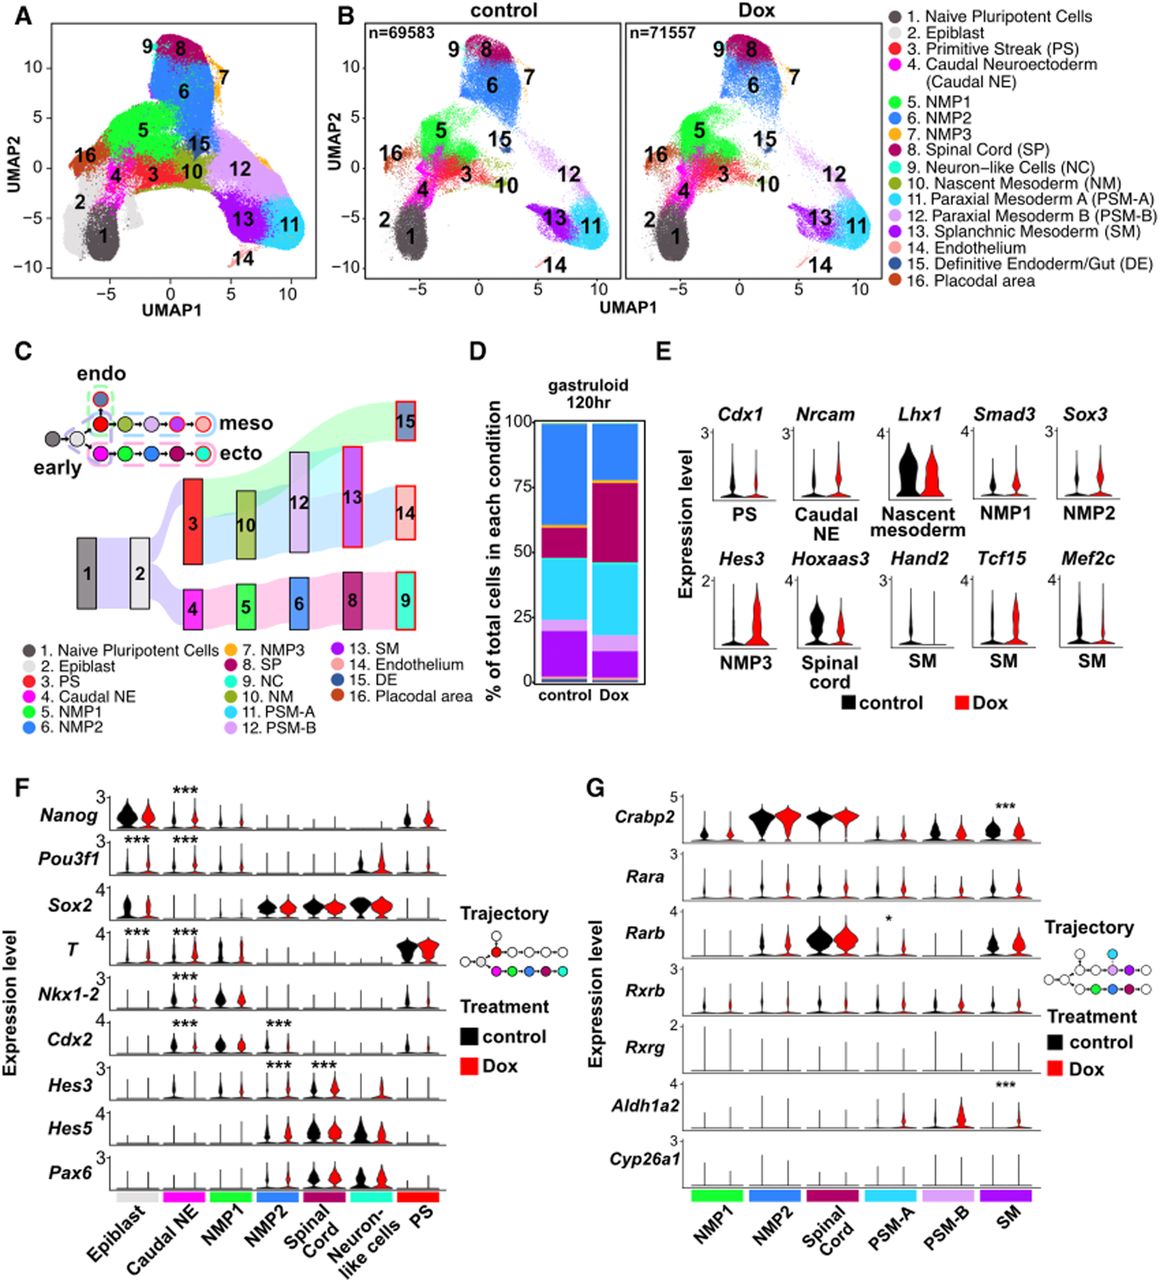
R-loop depletion alters differentiation in gastruloids. (A) Clusters of scRNA-seq data composed of two published data sets combined with control and Dox-induced RHKI cells from this study, shown as a UMAP. Cell type annotations are shown in B. (NMP) Neuromesodermal progenitors. (B) UMAP of scRNA-seq from RHKI across three time points (n = 2 for 0 h and n = 4 for 72 h and 120 h), split by treatment condition: control (left) and Dox (center). Cell annotations are indicated to the right. (C, bottom) Sankey plot showing the lineage trajectory of control scRNA-seq data. (Top) Simplified lineage diagram with dotted lines indicating the cell types corresponding to each germ layer or early progenitor. (D) Proportions of total cells in control and Dox conditions at 120 h of gastruloid differentiation. Colors correspond to cell types shown in C. (E) Violin plots of differentially expressed genes (DEGs) between control and Dox conditions for different differentiated cell types. DEGs were called as described in the Methods with adjusted P-values ≤ 0.05, |log2FC| ≥ 0.58, and the percentage of expressed cells ≥0.25. (PS) Primitive streak, (caudal NE) caudal neuroectoderm, (NMP) Neuromesodermal progenitor, (PSM-A) paraxial mesoderm A, (PSM-B) paraxial mesoderm B, (SM) splanchnic mesoderm. (F,G) Violin plots of critical genes among cell types in ectoderm trajectory (F) and genes related to retinoic acid signaling among NMP/spinal cord and PSM/SM (G). (*) adjusted P-value < 0.05, (***) adjusted P-value < 0.001.