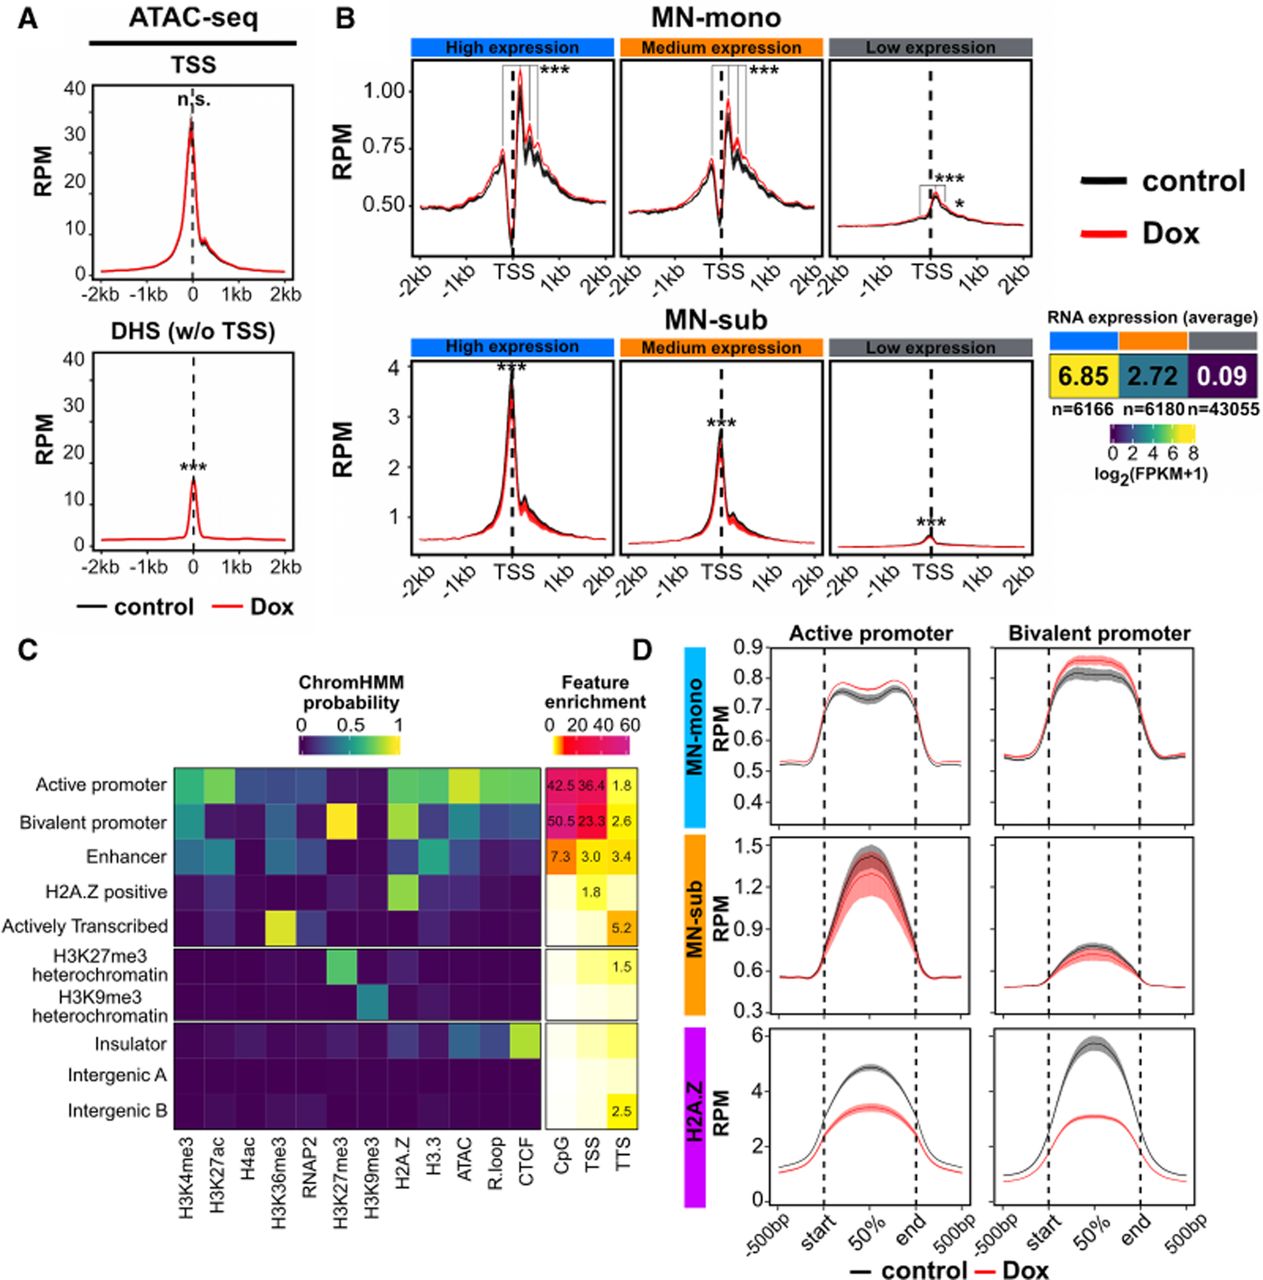
R-loop disruption increases nucleosome occupancy at active and bivalent genes. (A) Aggregation plot of subnucleosomal ATAC-seq signal (1 to 120 bp fragments) across transcription start sites (TSSs) and TSS-distal DNase I hypersensitive sites (DHS w/o TSS; DNase-seq [GEO]: GSE37074) in control and Rnaseh1-overexpressing mESCs (n = 4 replicates each). Aggregation plots measuring the mean RPM (reads per 10 million) were generated for each replicate, and the mean and standard error of mean for all replicates are shown. (***) P < 0.001, determined as described in the Supplemental Methods. (B) Aggregation plot of MNase-seq signal (n = 2 replicates for each condition) in RPM surrounding the TSSs of high (n = 6166), medium (n = 6180), and low (n = 43,055) expression genes. Mean and standard error of mean are shown. (MN-mono) Mononucleosome-sized fragments (150–200 bp), (MN-sub) subnucleosome-sized fragments (1–120 bp). The three expression categories were determined using bulk-RNA-seq data from control mESCs. (*) P < 0.05, (***) P < 0.001, determined as described in the Supplemental Methods. (C) ChromHMM characterization of chromatin states from the epigenomic profiling data. (Left) Ten states resulting from ChromHMM analysis of all ATAC-seq, CUT&Tag, or CUT&RUN data measured in control mESCs. (Right) Enrichment of genomic features (CpG, TSS, and TTS) in each of the 10 states. (D) Aggregation plots of MN-mono, MN-sub and H2A.Z across active and bivalent promoter regions from ChromHMM. Mean RPM and standard error of mean are shown.