

Abstract
High-throughput bottom-up proteomic data cover thousands of proteins and related co- and post-translational modifications (CTMs/PTMs). Yet, it remains an open question how to holistically explore such data and their relationship to complementary omics/phenotypic information. Graphical models are particularly suited to study molecular networks and underlying regulatory mechanisms, as they can distinguish direct from indirect relationships, aside from their generalizability to diverse data types. Here, we propose PriOmics to integrate proteomic data with complementary omics and phenotypic data. PriOmics models intensities of individual proteotypic peptides and incorporates their protein affiliation as prior knowledge to resolve statistical relationships between proteins and CTMs/PTMs. This is verified in simulation studies, which also demonstrate that PriOmics can disentangle regulatory effects of protein modifications from those of respective protein abundances. These findings are substantiated in a diffuse large B cell lymphoma (DLBCL) data set in which we integrate SWATH-MS-based proteomics with transcriptomic and phenotypic data.
State-of-the-art proteomic approaches such as liquid chromatography coupled to quadrupole-time of flight tandem mass spectrometry (LC-QTOF-MS/MS) facilitate the high-throughput characterization of proteomes (Aebersold and Mann 2016). The field developed from assessing proteins, peptides, and associated co- and post-translational modifications (CTMs/PTMs) in a few specimens to large-scale studies in medicine and systems biology comprising hundreds of specimens to resolve regulatory mechanisms and to discover novel biomarkers (Hüttenhain et al. 2019; Bader et al. 2020; Bai et al. 2020; Salie et al. 2022). Studies of CTMs/PTMs have received increased attention in recent years, comprising among others phospho-proteomics to reveal kinase–substrate interactions in plants (Wu et al. 2019), the identification of high-risk groups in cancer (Archer et al. 2018), and the study of molecular mechanisms in cancer treatment (Xu 2019).
The integration of multiomics data is essential in biological research, providing a comprehensive view of complex systems by combining genomics, transcriptomics, proteomics, and metabolomics. Each layer offers unique insights into cellular functions and diseases, and various strategies have been developed for data-driven integration (Ritchie et al. 2015; Picard et al. 2021; Hernández-Lemus and Ochoa 2024). Common approaches combine omics layers into a single data set to facilitate interomic analysis. A multitude of different multivariate statistical techniques and machine learning–based or network-based (Zitnik et al. 2024) methods can be applied after data concatenation. Recent integration methods, such as model-ensemble methods, analyze each omic layer independently before synthesizing results, retaining layer-specific features but potentially missing interomic interactions (Vahabi and Michailidis 2022). Mixed integration methods apply a transformation step prior to analysis, for example, by using kernel- or graph-based methods (Picard et al. 2021). Afterward, mostly the same algorithms can be applied as used for early integration pipelines. Furthermore, intermediate integration methods facilitate integration by identifying shared patterns among omics data sets, accommodating both common and unique factors specific to each data type. As such, multiomics factor analysis (MOFA) is used to model common latent factors across multiple omics layers (Argelaguet et al. 2018). Unified nonnegative matrix factorization (UNMF) focuses on decomposing nonnegative matrices into interpretable, lower-dimensional components that capture the underlying structure and patterns within individual data sets (Lee and Seung 1999; Abe and Shimamura 2023). In contrast, mutual information (MI)–based algorithms assess dependencies between omics variables by quantifying the amount of shared information (Margolin et al. 2006). Here, we consider a holistic perspective and propose to integrate omics layers statistically using a dedicated network inference method based on probabilistic graphical models.
Naive pair-wise measures of association such as Pearson's correlation were shown to be prone to false positives as a consequence of indirect relationships mediated by one or more other variables (Altenbuchinger et al. 2020; Shutta et al. 2023). To resolve such spurious associations, molecular variables have to be considered in their multivariate context. Probabilistic graphical models are designed for this purpose (Altenbuchinger et al. 2019, 2020) and were recently adapted to the multiomics setting (Shutta et al. 2023) to study, for instance, gene regulation via promoter methylation. However, (multi-)omics data sets might demonstrate even higher complexity, which is not yet captured by existing approaches. First, (multi-)omics data are usually accompanied by complex and highly relevant phenotypic data that warrant direct incorporation into statistical model development, as suggested, for example, by Feng and Ning (2019) and Li et al. (2022). Second, some omics technologies require a tailored solution. For instance, genomic information, such as somatic mutations in cancer, should be incorporated as categorical variables. Similarly, state-of-the-art proteomic data require tailored solutions, as outlined in the following.
Bottom-up LC-MS/MS proteomic approaches like sequential window acquisition of all theoretical fragment–ion spectra mass spectrometry (SWATH-MS) quantify protein expression on the level of peptides following digestion of proteomes with endopeptidases such as trypsin. The measurement of thousands of peptides across hundreds of samples provides highly reproducible and consistent quantitative results (Ludwig et al. 2018). Peptide intensities are typically computed by summing or averaging peak areas of the most intense fragment ions of a peptide. To infer the abundance of a protein, one or many proteotypic peptides are aggregated to yield protein intensities (Fig. 1B). Multiple strategies have been suggested for this process (Silva et al. 2006; Schwanhäusser et al. 2011; Cox et al. 2014), of which the averaging of the most intense peptides per protein is one of the most common strategies (Ludwig et al. 2012). These aggregation steps can potentially lower measurement noise, but they also have several major drawbacks. First, peptides contributing to the same protein intensity can differ with respect to measurement quality (noise), and consequently, the computed protein abundance can be blurred through low-quality peptide measurements. Thus, a specific peptide could be a better representative of the protein than the average value (Fig. 1A). Second, CTMs/PTMs, such as protein N-terminal acetylation, phosphorylation, glycosylation, and ubiquitination, can affect protein structure, function, and stability. For instance, the RNA and protein encoded by the gene MYC are known to be of high prognostic relevance in many cancer entities (Dang 2012). However, its phosphorylation patterns can confer additional prognostic value, as shown for medulloblastomas in the work of Archer et al. (2018). To reveal the specific roles of protein MYC and its differentially phosphorylated isoforms, their respective quantities have to be considered. Naive aggregation can potentially hide such highly relevant information. A similar challenge arises in transcriptomics in which multiple sequencing reads need to be aggregated into a single transcript abundance. Probabilistic tools, such as RNA-seq by expectation maximization (RSEM) (Li and Dewey 2011), have provided effective transcript aggregation. However, protein aggregation faces a more complicated problem, as peptides, especially modified versions, may exhibit different behaviors and functional roles than their nonmodified counterparts. Further, the data quality between both fields differs a lot. Bulk RNA-seq typically provides sufficiently high read counts, whereas peptide identification via mass spectrometry often yields more sparse and noisier data (Aebersold and Mann 2016). Consequently, naive aggregation strategies might blur estimates of protein abundances if one or more peptides of a protein are captured inaccurately.
Concepts of conventional peptide aggregation strategies. Naive network inferred at the level of peptides (A) and at the level of proteins (B).
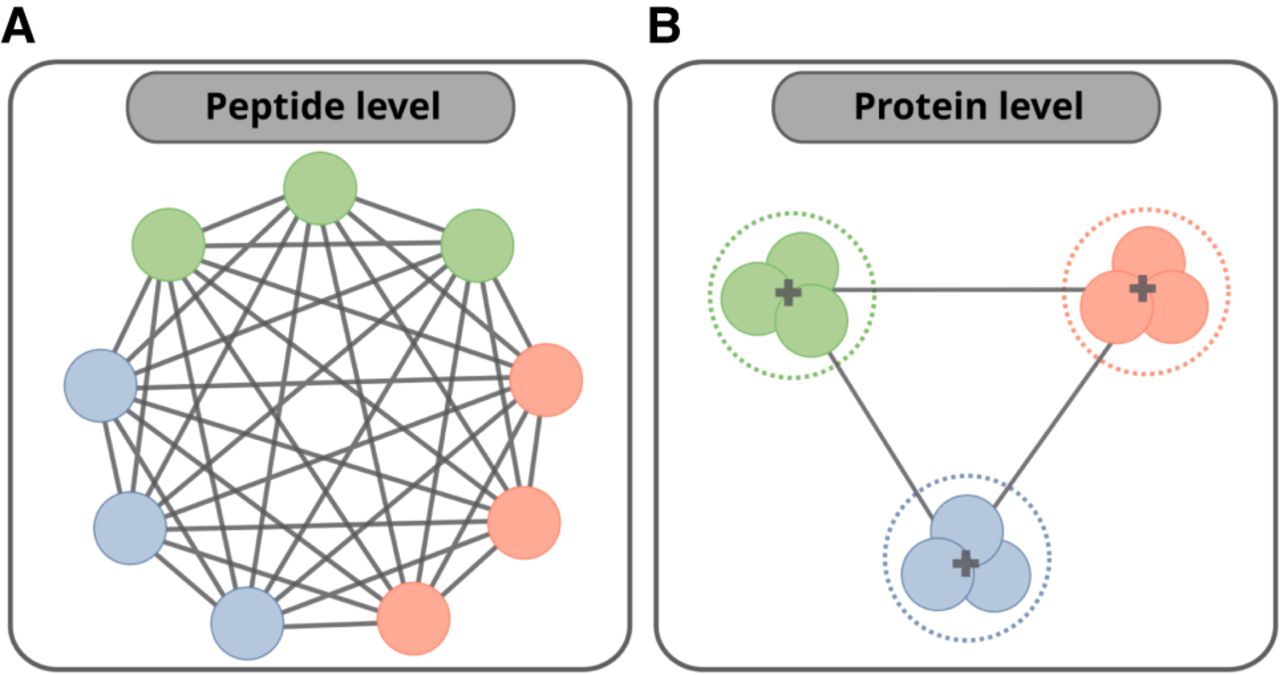
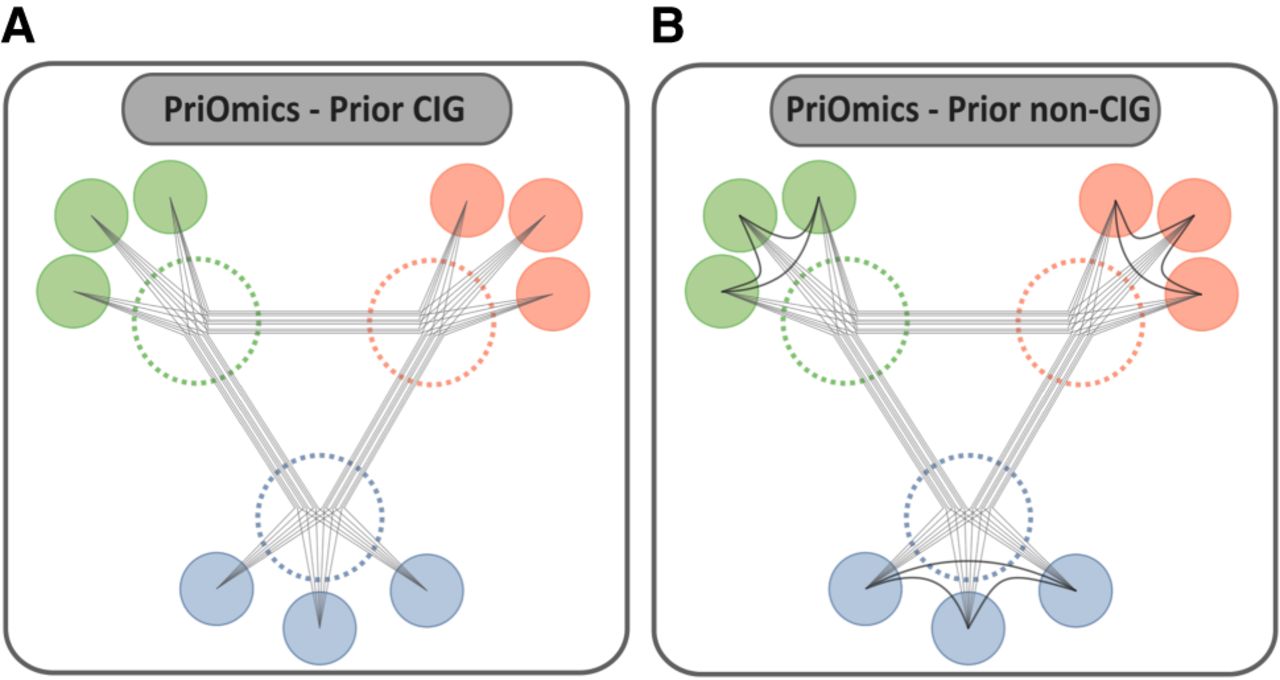
Peptide aggregation faces several key limitations: (1) standard peptide aggregation procedures can introduce biases and lead to a critical loss of information; (2) the statistical redundancy from multiple peptides per protein poses a significant challenge for conventional graphical models; and (3) it is often difficult to distinguish the regulatory effects of protein modifications (CTMs/PTMs) from changes in overall protein abundance. Here, we introduce PriOmics, which is a probabilistic graphical modeling approach specifically designed to overcome these challenges. PriOmics accounts for redundant molecular variables (multiple peptides of the same protein) without a prior aggregation step. The algorithm is implemented in two distinct variants based on assumptions about peptide relationships: one treating grouped peptides as conditionally independent (“PriOmics-CIG”) and one allowing for dependencies between them (“PriOmics-non-CIG”), accommodating specific use cases as conceptualized in Figure 2, A and B. PriOmics models individual peptides but takes into account their corresponding protein identity, thus directly addressing the limitations of aggregation and redundancy inherent in standard peptide aggregation procedures. Moreover, this peptide-level resolution allows PriOmics to disentangle regulatory effects of protein modifications from those of respective protein abundances. PriOmics can also incorporate categorical data types to facilitate the integration of complex proteomic data with pheno- and genotypical information. We demonstrate the performance of PriOmics both in simulation studies and in an application to proteome–transcriptome data integration in diffuse large B cell lymphoma (DLBCL), in which we also take into account phenotypic information on patient samples. In these evaluations, we compare PriOmics to several competing approaches, including standard mixed graphical models (MGMs), popular MI-based network inference methods, and strategies based on peptide aggregation. The biological application reveals key molecular variables that drive the differentiation of DLBCLs into their cell of origin (COO).
Concepts of the PriOmics peptide aggregation strategies. Both methods account for the protein affiliation, but prior CIG (conditionally independent variables–grouped) (A) removes edges a priori between proteotypic peptides of a protein, whereas prior non-CIG (nonconditionally independent variables–grouped) (B) retains them. The former is more appropriate for technical, noisy copies of an identical variable (peptides that represent the same protein abundance), and the latter is more appropriate for variables that are related but likely represent different biological variables (e.g., different phosphorylation sites of the same protein).
Results
Problem setting
As a probabilistic graphical modeling approach, PriOmics is designed to model complex statistical dependencies between variables. It can account for both continuous variables such a gene and protein expression levels and categorical variables such as geno-/phenotypes. Thus, PriOmics is a general framework that enables the integration of diverse data modalities that can distinguish direct from indirect dependencies. To establish a PriOmics model, the user has to provide two full data matrices, one that contains the measurements of all continuous variables (e.g., protein and gene expression levels) and a matched matrix containing all categorical variables (e.g., geno- and phenotypes). Both data matrices are required to represent the same set of samples. Given these data, PriOmics infers a statistical model with parameters representing statistical dependencies, in which vanishing parameters correspond to conditional independence (CI; see Methods). PriOmics pays particular attention to the specific nature of proteomic data, in which multiple peptides can represent the same protein abundance. As such, the user can specify prior information via two grouping priors. Prior conditionally independent variables (grouped), that is, “CIG,” assumes that individual proteotypic peptides serve as a proxy for the same underlying protein abundances. Here, the grouped peptides are assumed to be conditionally independent (CI). Typically, noisy peptide measurements blur estimates of protein abundances in aggregation methods. As such, PriOmics “CIG” models peptides jointly without prior aggregation step while accounting for the fact that multiple peptides likely represent the same protein via a grouping prior. As an alternative, users can choose prior nonconditionally independent variables (grouped), that is, “non-CIG,” in which the members of a group are assumed to be related but still represent different biological variables. As such, variables are not assumed to be CI. This model type can be particularly relevant if different proteotypic peptides belong to the same protein but carry different CTMs and PTMs and, thus, might carry different biologically meaningful information.
In the following, we will describe the basic concept of PriOmics and will show that holistic analysis strategies of high-throughput proteomic data have to account for the fact that multiple proteotypic peptides likely represent the same underlying protein abundance. Otherwise, analyses are prone to erroneous conclusions. These findings will be substantiated in systematic simulation studies presented in subsequent sections. Finally, we will provide an exemplary application to a combined proteomic–transcriptomic data set of DLBCLs.
Graphical models, redundant variables, and group-parsimonious networks
The inference of probabilistic graphical models, such as Gaussian graphical models (GGMs) or MGMs, is affected by redundant variables. To illustrate this, we generated artificial data according to the exemplary network structure shown in Supplemental Figures S1 and S2A, consisting of five continuous variables (A, B, C, D, E) and three categorical variables with binary outcome (X, Y, Z). Then, we generated two noisy copies of B and three noisy copies of variables C and E, to simulate the possible presence of multiple peptides representing the same protein. The corresponding ground-truth network is visualized in Supplemental Figure S2B, in which we contrast it with different approaches to reconstruct the underlying network (Supplemental Fig. S2C–G). These are, first, the network structure estimated via ordinary univariate analysis, in which we used linear regression for continuous–continuous edges and used logistic regression for continuous–binary and binary–binary edges (Supplemental Fig. S2C). Because each edge is estimated twice, we show the respective average (only edges with P-values < 0.05, adjusted for the false-discovery rate according to the method of Benjamini and Hochberg (1995) (BH), are shown; Matthews correlation coefficient (MCC) = 0.71). We observed a pattern typically seen in ordinary pair-wise association analysis, as exemplified by variables B and D, which are individually connected to variable E but not to each other in the ground-truth network (Supplemental Figure S2B). Erroneously, the univariate analysis in Supplemental Figure S2C shows an edge between B and D as a consequence of B and D's individual relationship to E. This observation illustrates that pair-wise association measures are prone to false-positive associations and, thus, molecular variables have to be considered simultaneously in order to disentangle direct from indirect relationships. Similar observations were repeatedly made for pair-wise correlation networks (Shutta et al. 2023). Note that the latter are restricted to continuous variables only. As an alternative analysis strategy, we explored multivariate node-wise linear and logistic regressions (Supplemental Fig. S2D). This analysis strategy takes possible indirect relationships into account, but it does not allow for variables to be technical replicates of each other. In fact, all genuine interactions were too weak and, consequently, were removed after BH adjustment (MCC = 0). This effect was substantially mitigated using the classical, regularized MGM as proposed by Lee and Hastie (2015) and implemented via pseudo-log-likelihood optimization (referred to as PLL-MGM) (Supplemental Fig. S2E). However, still a high proportion of edges were not observed (MCC = 0.72). In particular, when redundant variables were involved, edges were usually observed to only a few, but not to all members, of the group, as exemplified for edges between variables representing B & E and A & C, respectively. Next, we evaluated PriOmics and obtained the networks shown in Supplemental Figure S2, F and G, for CIG and non-CIG, respectively. PriOmics-CIG correctly distinguished direct from indirect relationships, as can be seen from the absence of edges between B and E and between A and C, respectively. Moreover, it can deal with technical replicates of variables; if there is an edge between one peptide and another variable, then all peptides of the respective protein are connected to this variable. PriOmics-non-CIG shows a similar behavior (Supplemental Fig. S2G). However, because non-CIG does not strictly assume that variables of the same group are technical replicates, it infers also relationships between those replicates, at the price of reduced edge weights to other variables. In summary, PriOmics can deal with redundant variables but requires a priori specification of the underlying data generating process. The latter is not always available, and as a consequence, performance can be compromised, as can be seen by comparing panels F and G of Supplemental Figure S2 (MCC = 1. vs. MCC = 0.93); the prior was correctly specified for Supplemental Figure S2F (CIG, as variables B, C, and E contain technical replicates) and incorrectly for Supplemental Figure S2G. Matrix representations of all derived networks are depicted in Supplemental Figure S3. In summary, we showed typical pitfalls in the analysis of proteomic data in a simple simulation, namely, indirect edges and multiple replicates of individual variables. For large-scale performance evaluations, see results in the next section.
An important ingredient of PriOmics is its regularization scheme dedicated to the analysis of proteomic data. PriOmics adapts the MGM loss function to account for redundant variables by enforcing within-group edges to equal zero (CIG) and makes use of regularization strategies taking into account the grouping of variables (CIG and non-CIG). For prior CIG, the parameters representing direct interactions between variables within the same group ( for ) are guaranteed to be exactly zero owing to the constraint imposed during optimization, whereas for prior non-CIG, these within-group interaction parameters are allowed to be nonzero if the data and the regularization term support such an interaction.
The need for model regularization has been emphasized repeatedly for GGMs (Schäfer and Strimmer 2005a,b) and MGMs (Lee and Hastie 2015); for P > n, the maximum likelihood estimate of the multivariate Gaussian is not defined, and even if n > P, the parameter estimates can have a large variance if both are of the same order of magnitude. Thus, model regularization is mandatory. Standard LASSO regularization enforces sparseness with respect to individual edges (see, e.g., the graphical LASSO) (Friedman et al. 2008), whereas PriOmics utilizes group-LASSO regularization terms to further encode the grouping of variables. To illustrate this feature, we repeated the previous analysis but now decreased the regularization parameter successively from λ = 1.6 to λ = 0. Each individual λ was applied to both CIG (Supplemental Fig. S4) and non-CIG (Supplemental Fig. S5). We make the following observations:
Networks become increasingly connected upon decreasing λ.
Variables that belong to the same variable group either are all connected to a neighbor or are not connected.
Simulation studies
The former example illustrates the basic features of PriOmics. To further test the performance of PriOmics against other methods, we performed several simulation studies, exploring both different sample sizes and different edge densities (the proportion of edges). Simulations were designed to capture key features relevant to multiomics data sets: high dimensionality (with scenarios when P > n), the presence of both continuous and categorical variables, underlying sparse network structures, and, importantly, the block structure introduced by redundant variables (simulating multiple peptides per protein) alongside unique variables (simulating other omics or phenotypes).
PriOmics improves on network inference in settings with redundant variables
We evaluated PriOmics and the competing methods for a fixed number of 75 (i.e., 150) duplicated continuous, 50 nonduplicated continuous, and 30 discrete variables for different sample sizes n (n ∈ {100, 175, 250, 375, 500, 750, 1000, 1500, 2000}), in which the subsets were always drawn from the next bigger one. The 75 continuous variables with noisy copies represent a scenario in which different peptides represent the same protein (see Supplemental Code). The set of 50 ordinary nonduplicated continuous variables were included to represent a typical second omics layer, such as gene expression levels or metabolite abundances. We performed 12 different simulation scenarios with varying edge densities η for continuous–continuous, continuous–discrete, and discrete–discrete edges as summarized in Supplemental Table S1. Here, simulated continuous–continuous edges were further differentiated according to the two omics layers. Investigated edge densities were motivated by the work of Schäfer and Strimmer (2005a) and Shutta et al. (2023), in which edge densities of 1%–2% and 0.4%–10.1% were studied, respectively. Noteworthy, the investigated simulation scenarios are also supported by the empirical edge densities observed in the DLBCL analysis shown below (see also Supplemental Tables S2, S3, S6). Each simulation scenario was repeated a total of 30 times to provide error estimates.
First, we compared the performance of PriOmics to the competing methods with respect to the reconstruction of continuous–continuous edges in terms of MCC and area under the precision-recall curves (AUC-PR). The results for simulation scenario 1 of Supplemental Table S1 are shown in Figure 3. The MCCs for PriOmics-CIG were higher than those obtained for the MGMs without peptide grouping in almost all scenarios, with improvements of up to 31.7% for simulation 1a, 27.8% for simulation 1b, and 22.3% for simulation 1c. Similarly, PriOmics-non-CIG performed better than PLL-MGM for all sample sizes, but improvements were smaller than for PriOmics-CIG (see Fig. 3). The corresponding AUC-PRs underlined the overall better performance of PriOmics (Supplemental Fig. S7). We further included comparison methods based on MI. These do not rely on the inference of conditional independence statements, providing an alternative conceptual approach to network inference. Studied approaches are context likelihood of relatedness (CLR), algorithm for the reconstruction of accurate cellular networks (ARACNE), and maximum relevance minimum redundancy network (MRNET). Although all three methods yielded comparatively high AUC-PR values, those were accompanied by an inflated number of false positives; the graphical modeling approaches (PriOmics-CIG, PriOmics-non-CIG, and PLL-MGM) set a substantially higher number of edges to zero, and as such, respective edges cannot be ranked for evaluation, biasing their AUC-PR values toward smaller values. Considering MCC, MI-based approaches perform substantially worse than the graphical modeling approaches as a consequence of inflated false positives. In general, AUC-PRs increased with n, and the largest improvements for PriOmics were observed for medium and large sample sizes. Improvements for sample sizes n < 250 were smaller, but the overall performance was better for both PriOmics-CIG and PriOmics-non-CIG compared with the other methods. For instance, the improvements in MCCs of PriOmics-CIG compared with PLL-MGM were 0.15 and 0.29 for scenario 1a and 0.07 and 0.16 for scenario 1b, respectively, for 100 and 175 samples. PriOmics also showed better sample efficiency, often achieving the performance of PLL-MGM's with substantially fewer samples (e.g., cf. n = 250 vs. n = 500 in scenario 1a). Further, we observed that the edge recovery was better for small edge densities (scenario 1a) with maximum AUC-PRs of 0.963 and 0.932, respectively, for PriOmics-CIG and PriOmics-non-CIG. These findings are supported by the alternative simulation scenarios 2 through 4 (see Supplemental Fig. S8–S13).
Performance comparison of a pseudo-log-likelihood MGM implementation (PLL-MGM), the PriOmics implementations with different priors (“CIG” and “non-CIG”), a node-wise LASSO regression MGM implementation (“NW-MGM”), and three MI-based algorithms (“CLR,” “ARACNE,” and “MRNET”) on simulated data. The plots show the average MCC versus sample size n of 30 runs. The top row shows results for the continuous–continuous edges; the middle row, for the continuous–discrete edges; and the bottom row, for the discrete–discrete edges. The columns correspond to the three different simulation studies 1a to 1c with varying edge densities, as summarized in Supplemental Table S1. The error bars correspond to ±1 SDD.
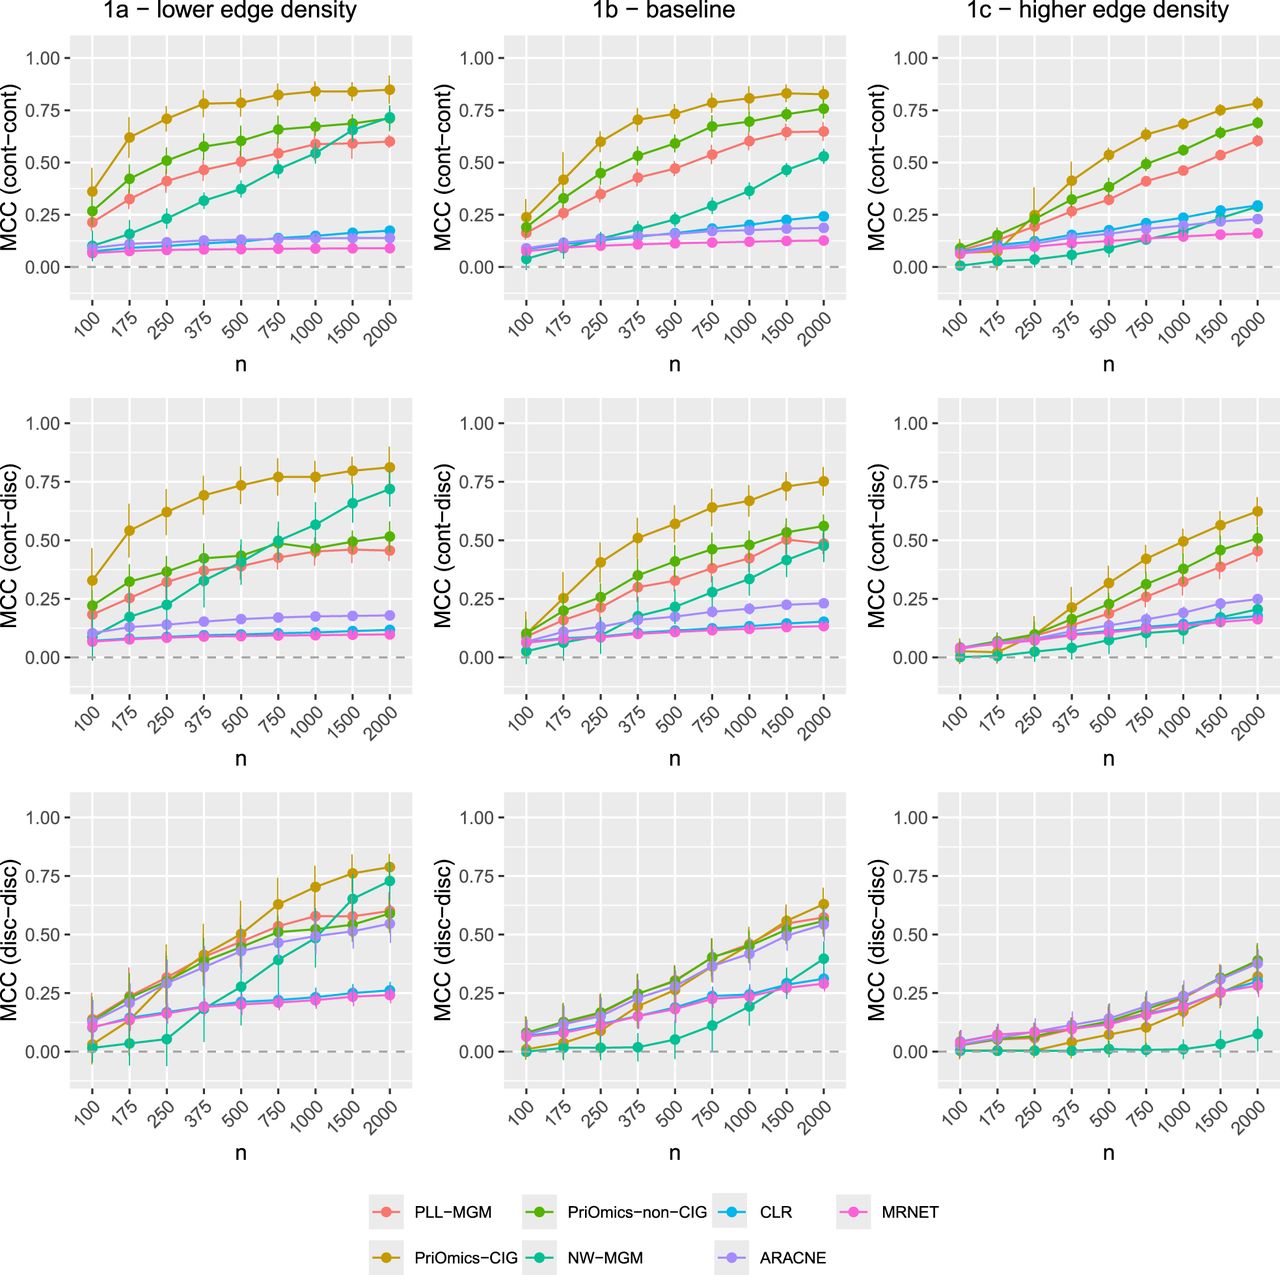
Next, we verified the reconstruction of continuous–discrete edges (Fig. 3, middle row) and discrete–discrete edges (Fig. 3, bottom row). For all methods, MCC and AUC-PR had a tendency to be lower than for the reconstruction of continuous–continuous edges. PriOmics-CIG showed best performance results with respect to MCC (and similarly AUC-PR) for continuous–discrete edges compared with PLL-MGM but was weaker for discrete–discrete edges, while still outperforming the node-wise MGM (NW-MGM). PriOmics-non-CIG yielded comparable results to PLL-MGM for edges involving categorical features. One should note that the model priors directly affect continuous–continuous edges via prior Equation 5, although their effect on continuous–discrete and discrete–discrete is only an indirect one, which might explain the minor differences to PLL-MGM.
In summary, this simulation study shows that both PriOmics-CIG and PriOmics-non-CIG substantially improve edge recovery compared with the state-of-the-art approaches through systematically addressing redundant variables by removing within-group edges (PriOmics-CIG) and by using a regularization scheme, which a priori takes into account the grouping of variables (PriOmics-CIG and PriOmics-non-CIG).
PriOmics provides robust results even when model assumptions are violated
We conducted an additional simulation to investigate how the PriOmics approaches respond to violated model assumptions. To this end, we systematically increased the number of false group assignments and assessed the method's ability to accurately reconstruct the underlying network. As a benchmark, we aggregated peptides using the maxLFQ method (Cox et al. 2014) and subsequently applied PLL-MGM for network inference. The results, illustrated in Supplemental Figure S14, show the performance curves for PriOmics alongside the benchmark, demonstrating that PriOmics maintains robust performance even when the model assumptions are violated. Moreover, performance remains substantially more stable than for maxLFQ. Corresponding performance evaluations in previous simulation studies are given in Supplemental Figures S15–S18. In summary, we observed that both PriOmics approaches can handle inaccuracies in group assignments while still achieving reliable network reconstruction.
Application to DLBCL data
Non-Hodgkin lymphomas (NHLs) arising from B or T cells represent a highly heterogeneous group of diseases with DLBCL being the most frequent, accounting for almost one third of NHLs (Non-Hodgkin's Lymphoma Classification Project 1997). Routinely, DLBCL patients are stratified simply according to the stage of the disease (i.e., the sites of manifestations) or taking additional phenotypic and clinical variables into account, such as age, general constitution (i.e., performance status), serum lactate dehydrogenase (LDH) level, or the occurrence of B symptoms (i.e., fever, drenching night sweats, and loss of >10% of body weight over 6 months), according to the international prognostic index (IPI) (NHLPF Project 1993). On the molecular level, DLBCLs are commonly differentiated according to their COO into germinal center B cell-like (GCB) and activated B cell-like (ABC) depending on the expression of specific genes (Rosenwald et al. 2002; Hans et al. 2004). More recently, aggressive lymphomas expressing the “double hit” or the “molecular high grade” signatures have been proposed as separate subtypes (Ennishi et al. 2019; Sha et al. 2019). These signatures characterize GCB tumors with genetic and dark zone biological features similar to both follicular lymphomas and Burkitt lymphomas. In addition, molecular classification schemes based on transcriptomics and proteomics were previously proposed (Rimsza et al. 2011; Reinders et al. 2020; Staiger et al. 2020; Wright et al. 2020) and, more recently, more sophisticated genetic classifiers (Chapuy et al. 2018; Schmitz et al. 2018). These recent developments warrant a holistic approach for revealing different pathomechanisms underlying DLBCL and predicting treatment response. Here, we will perform an exemplary analysis of a high-throughput proteomic data set of DLBCL using PriOmics.
Data set
The data set includes 344 DLBCL specimens from the German High-Grade Lymphoma Study Group (DSHNHL) (Reinders et al. 2020), comprising proteomic data of formalin-fixed paraffin-embedded (FFPE) tissue slides generated using microLC-SWATH-MS, including in total the label-free mass spectrometric intensities of 7720 nonmodified peptides and 666 peptides with CTMs and/or PTMs. Two additional transcriptomic data sets were available for 330 of the 344 patients, consisting of 145 genes measured by NanoString nCounter (Staiger et al. 2020) and 296 genes measured by HTG EdgeSeq (for overview, see Supplemental Table S4). Alongside the omic data, we included 10 categorical variables, comprising nine binary variables and one multilabel variable (Supplemental Table S5). Initially, we employed PriOmics on the proteomic data set, along with clinical and phenotypic features, and referred to this as data set 1 (DS1). Following this, we applied PriOmics to the combined data set (DS2), which incorporates proteomics, transcriptomics, and clinical and phenotypic data. The details of DS1 and DS2 are outlined in Supplemental Table S4.
PriOmics model development
PriOmics was applied to DS1 in three different scenarios, using priors CIG and non-CIG to encode the protein affiliation and without prior assumptions (i.e., PLL-MGM), respectively. The more comprehensive data set DS2 was processed using the priors to group peptides according to their associated protein. The transcriptomic data were modeled as individual variables without underlying group property. All PriOmics models converged using a stopping criterion of , defined according to the method of O'Donoghue and Candès (2015). In total, models for 30 different penalization parameters (λ) were evaluated. In a first instance, we selected models using the lowest extended Bayesian information criterion (EBIC) (Chen and Chen 2008), with γ = 0.5 resulting in λ values of 1.130, 0.693, and 0.425, respectively, for models with priors CIG, non-CIG, and PLL-MGM. Because the selected models yielded only few nonzero associations as shown in Supplemental Table S6, we subsequently chose the Bayesian Information Criterion (BIC) as model evaluation criterion. This yielded denser networks and facilitated a more detailed biological interpretation. Here, λ values of 0.332, 0.294, and 0.142, respectively, for CIG, non-CIG, and PLL-MGM were found to be optimal for regularization. A summary of the inferred DS1 models can be found in Supplemental Table S6 and Supplemental Figures S19–S21. Analogously, the model selection for DS2 was conducted with the BIC using λ values of 0.294, 0.294, and 0.142, respectively, for CIG, non-CIG, and PLL-MGM. Further details of model selection are depicted in Supplemental Figures S22–S24.
Holistic omics data integration with phenotypic variables in DLBCL
In PriOmics networks, protein–protein edges represent associations filtered for indirect ones. These edges may indicate physical interactions, shared roles in signaling pathways, or coregulation in biological processes. Additionally, they capture aspects of cellular composition, highlighting coexpressed or colocalized proteins and offering proteome-specific insights beyond transcriptional data. We used PriOmics to integrate proteomic and transcriptomic data with the phenotypic variables summarized in Supplemental Table S5. This analysis provides both sanity checks of the algorithm and a comprehensive characterization of the interdependencies between molecular and phenotypic variables in DLBCL. Unless otherwise mentioned, the analyses were performed with BIC as model selection criterion. The full network representations of DLBCL models (PriOmics-CIG, PriOmics-non-CIG, and PLL-MGM) are visualized in Supplemental Figures S25 (DS1) and S26 (DS2).
PriOmics reduces false-positive findings
We first applied PriOmics and competing methods to the combined proteomic and phenotypic data (DS1). PriOmics yielded networks with 46,989 and 44,339 edges (Supplemental Tables S6, S7), corresponding to edge densities of 1.87% and 1.76% for CIG and non-CIG, respectively, without taking into account edges within protein groups to maintain comparability. Edges obtained by both approaches were consistent with an overlap of 63.3% (Supplemental Fig. S27B). PLL-MGM yielded a similar edge density of 2.11%, but the individual edges agreed only moderately to those of PriOmics, with an overlap of 10.4% and 11.4%, respectively, for CIG (Supplemental Fig. S27C) and non-CIG (Supplemental Fig. S27D). A Venn diagram (Supplemental Figure S27A) illustrates the overlap between PriOmics-CIG, PriOmics-non-CIG, and PLL-MGM. One should note that if a peptide is connected to a variable, then presumably the remaining peptides of the same protein should be also connected to this variable. This is always the case for PriOmics, as this prior knowledge is encoded via regularization. However, PLL-MGM yielded highly inconsistent results, in which, on average, only 56.84% of the expected edges were selected. It is noteworthy that PLL-MGM and PriOmics-non-CIG differ only in model regularization, and as such, this observation might be attributed to the l1 regularization of PLL-MGM. The latter induces sparseness in individual edges only and not edge groups. The NW-MGM approach yielded an almost vanishing edge density of 0.059% and therefore was excluded from further comparison.
Finally, we compared the PriOmics networks to those obtained by two naive univariate screenings, one using a significance threshold for BH-adjusted P-values of α = 0.05 and a more restrictive model with α = 10−28. The latter threshold yielded an edge density of 1.87% and was chosen such that it agreed approximately with the PriOmics networks. The univariate approach with α = 0.05, however, yielded a dense network covering 62.66% of all possible edges, suggesting a huge number of false-positive findings. It is noteworthy that although this univariate approach selected the majority of all possible edges, it did not capture all of those selected by PriOmics-CIG (7423) (Supplemental Fig. S27E). The more restrictive univariate model with α = 10−28 showed a substantial disagreement to PriOmics-CIG, with only 9.43% consistent edges (Supplemental Fig. S27F). Moreover, the edges were inconsistent with respect to the underlying protein grouping, as suggested by an average edge proportion within protein groups of 35.78%. The Venn diagram in Supplemental Figure S28 quantifies the differences in inferred edges between methods. In summary, we observed a limited overlap between PriOmics and univariate screening. This was even the case when the latter was thresholded to match the density of PriOmics-CIG (Supplemental Fig. S27F), highlighting the need to discriminate direct from indirect relationships.
Associations to COO
The differentiation of DLBCLs according to their COO into GCB and ABC is used widely in patient stratification in randomized clinical trials (Alizadeh et al. 2000). Recently, proteomic-based GCB/ABC subtyping was suggested (Reinders et al. 2020). Thus, we focused first on a PriOmics analysis of the proteomic and phenotypic data only (without transcriptomic data) to explore whether the COO first-order neighborhood (Fig. 4) resembles the signature suggested by (Reinders et al. 2020) and whether it includes additional potential proteomic markers for COO subtyping (the first-order neighborhood should contain the most directly associated proteins). The ABC neighborhood (Fig. 4A) of the PriOmics-CIG model comprises in total 19 peptides from 12 different proteins, in which the tryptic peptide at the protein N terminus of PDLIM1 ([1Ac]-TTQQIDLQPGPWGFR) was acetylated after cotranslational cleavage of the N-terminal methionine by methionine aminopeptidase. Edges to the COO are chosen to represent the differentiation of ABC versus “unclassified.” The corresponding network visualizing the differentiation between GCB and “unclassified” is shown in Supplemental Figure S29, A and B, in which most edge signs are flipped. This is in line with the fact that those molecular features, which are positively associated with ABC, are usually negatively associated with GCB. In this analysis, “unclassified” DLBCLs are considered as an individual entity, as motivated by the unsupervised clustering performed by Lenz et al. (2008). One of two variables, which differentiate both ABC and GCB with the same edge sign from unclassified DLBCL, is a peptide proteotypic for DNA methyltransferase 1 (DNMT1). DNMT1, which belongs to a family of DNA methyltransferases that catalyze the transfer of the methyl moiety from S-adenosylmethionine to DNA, plays an important role in maintaining genome-wide methylation patterns during DNA replication (Mensah et al. 2021). DNMT1 is frequently expressed in both GCB and non-GCB DLBCL, but more strongly so in the former (Loo et al. 2018). More importantly, however, GCB and ABC DLBCLs have been suggested to feature specific and distinct epigenetic alterations, including DNA promoter methylation profiles (Shaknovich et al. 2010). In contrast, unclassified DLBCLs have been described to display nonspecific and, on average, lower DNA methylation levels. This appears to be consistent with the present finding that DNMT1 can distinguish both ABC and GCB DLBCLs from unclassified cases (Shaknovich et al. 2010). The second protein that differentiates both ABC and GCB with the same edge sign from unclassified DLBCL, is switching B cell complex subunit SWAP70 (SWAP70). SWAP70 is a Rac family guanine nucleotide exchange factor that, independently of RAS, transduces signals from tyrosine kinase receptors to RAC (Shinohara et al. 2002). Following B cell stimulation, expression of SWAP70 increases rapidly, and it translocates from the cytoplasm to the nucleus, where it plays a role in immunoglobulin class switching, as well as to the plasma membrane, where it associates with the B cell receptor (Masat et al. 2000). SWAP70 plays an important role in the regulation of cellular actin dynamics (Baranov et al. 2016) and is required for polarization and homing of B cells into secondary lymphoid organs (Pearce et al. 2006). Its ability to activate RAC1 may help to explain why SWAP70 distinguishes both ABC- and GCB-like DLBCLs from unclassified cases. SWAP70 has been observed to regulate NOTCH2 (Meng et al. 2015), which is frequently mutated in unclassified DLBCL, defining together with BCL6 gene rearrangements the so-called BN2 subgroup of DLBCL (Schmitz et al. 2018). However, even though BN2-like DLBCLs are associated with either NOTCH2 gain-of-function mutations or a relative increase in NOTCH2, NOTCH2 is rarely activated in these tumors (Shanmugam et al. 2021). Hence, it appears reasonable, albeit to be proven, that decreased expression of SWAP70, and thus reduced activation of RAC1 and NOTCH2, is a common feature of unclassified, mostly BN2-like DLBCLs that distinguishes them from other DLBCLs.
First-order neighborhood networks of “ABC”-labeled DLBCLs compared with “unclassified” DLBCLs. (A,B) Based on PriOmics models calculated on the proteomic data set (DS1) with PriOmics-CIG (A) or PriOmics-non-CIG (B). The model (C) includes additional transcriptomic data (DS2) with PriOmics-CIG for proteomic data and no prior for RNA data. Genes from the first data source (HTG) are depicted as squares, genes from the second data source (Nanostring) as hexagons, nonmodified peptides as circles, peptides with a CTM or PTM as triangles, and discrete variables as diamonds. Adjacent nodes of the same color represent the protein affiliation. Edge colors indicate positive (blue) or negative (red) associations. Edge color intensity indicates the association strength. The node labels refer to the gene or protein name together with the amino acid sequence of the associated peptide, separated by an underscore. CTMs and PTMs are displayed in square brackets ([1Ac] = acetylation). Edge weights are understood relative to the baseline COO = “unclassified.”
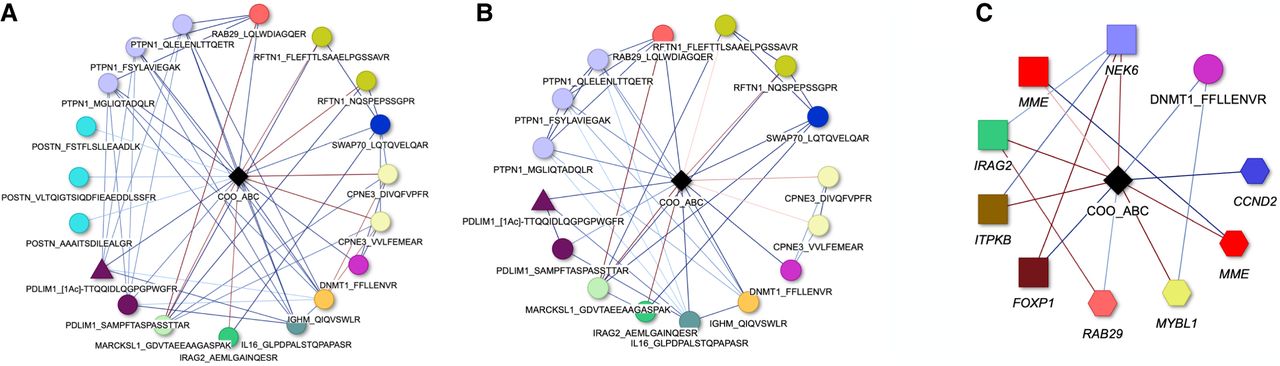
The majority of identified proteins in the COO first-order neighborhood are established COO markers, such as inositol 1,4,5-triphosphate receptor associated 2 (IRAG2; encoded by IRAG2, also known as JAW1) (Wright et al. 2003; Tedoldi et al. 2006; Blenk et al. 2007; Rimsza et al. 2011; Su et al. 2013; Liu et al. 2018; Yan et al. 2020), IL16 (interleukin 16) (Wright et al. 2003, 2020; Rimsza et al. 2011), immunoglobulin heavy constant mu (IGHM) (Blenk et al. 2007; Rimsza et al. 2011; Liu et al. 2018; Reinders et al. 2020; Yan et al. 2020), and protein tyrosine phosphatase non-receptor type 1 (PTPN1) (Wright et al. 2003; Reinders et al. 2020). We further confirmed the sign of the association for each of the proteins. For instance, the downregulation (negative association) of PTPN1 and IGHM in GCB-DLBCLs was already described by Reinders et al. (2020). Further, PDZ and LIM domain 1 (PDLIM1) was positively associated with the ABC subtype in the PriOmics model. Its corresponding gene, PDLIM1, was found to be upregulated in CD5+ cases that are associated with ABC (Xu-Monette et al. 2015). However, only a minority of DLBCL patients showed CD5 expression. The loss of the closely related gene family member PDLIM2 has been reported as a defect commonly shared by classical Hodgkin lymphoma (cHL) and anaplastic large cell lymphoma (ALCL), indicating a potential tumor suppressing functionality (Wurster et al. 2017). Further studies showed that PDLIM1 acts as a cancer-inducing regulator (Zhou et al. 2021), for example, in breast cancer (Liu et al. 2015). One of the two peptides representing PDLIM1 was acetylated at the free alpha-amino group of the protein N terminus after prior cotranslational cleavage of the protein N-terminal methionine ([1Ac]-TTQQIDLQPGPWGFR; AA positions 2–17). This common protein modification affects ∼80% of all human proteins, including PDLIM1 (Ree et al. 2018). The minor discrepancy in the edge weights assigned to both peptides of PDLIM1 (0.017 for SAMPFTASPASSTTAR [AA positions 123–138] and 0.055 for [1Ac]-TTQQIDLQGPGPWGFR) and the positive correlation obtained for PriOmics-non-CIG (Fig. 4B) suggest that the two peptides are technical replicates and that abundance of PDLIM1 rather than its differential acetylation is a marker for COO. To further explore how results are affected by the selected prior, we compared the previous COO neighborhood to the one obtained by using PriOmics-non-CIG (potential interrelationships between peptides of the same protein) (see Fig. 4A,B). The established edges to COO were almost identical to those obtained for PriOmics-CIG. Although the connections to three peptides of the protein POSTN disappeared, additional edges arose among grouped peptides (those are enforced to zero for PriOmics-CIG). Note that the assumptions of both priors CIG and non-CIG might be partially violated; most peptides affiliated with the same protein might be technical replicates (violating the assumptions of prior non-CIG) but not necessarily all (violating the assumptions of prior CIG). Thus, the observation that both analyses strongly coincide in their results serves as an important sanity check for PriOmics. For comparison, we also show the COO neighborhood established by PLL-MGM, which comprises 41 peptides, each representing a different protein (Supplemental Fig. S30). Thus, in this case, it remains to be elucidated whether the individual peptides or the underlying protein abundance is associated with COO. The latter information becomes directly accessible using PriOmics by considering the individual edge weights, as demonstrated by the previous example of PDLIM1.
As mentioned afore, PriOmics-non-CIG, in contrast to PriOmics-CIG, does not strictly assume that tryptic peptides derived from the same protein are technical replicates. Data-independent acquisition of tryptic peptides by SWATH-MS and their assignment to particular proteins is based on a peptide library generated previously using data-dependent acquisition followed by removal of tryptic peptides that are not unique, that is, that match more than one protein. Closer inspection of the two PriOmics models in Figure 4 revealed a difference in association strength with the COO label between the two peptides believed to be proteotypic for CPNE3 in the PriOmics-non-CIG model but not the CIG model. A renewed search against the UniProtKB/Swiss-Prot database (UniProt Consortium 2023) revealed that only the peptide VVLFEMEAR was indeed proteotypic for CPNE3, whereas the peptide DIVQFVPFR was shared by the CPNE paralogs 2 thru 9. Thus, the two peptides represent different variables. Differences in strength of association with the COO label were also noted for RFTN1, with RFTN1_NQSPEPSSGPR showing a much stronger negative association with COO-ABC than RFTN1_FLEFTTLSAAELPGSSAVR. In this case, the difference in association may be because of phosphorylation of S220, the first serine residue from the N-terminal end of NQSPEPSSGPR, which is a reported phosphorylation site of RFTN1 (Simpson et al. 2023). Because phosphopeptides are typically present at substoichiometric levels compared with nonmodified peptides of a protein and are also less efficiently ionized and prone to neutral loss of the phosphate group in collision-induced dissociation, which translates into reduced intensities of sequence informative fragment ions, failure to detect both the phosphorylated and the nonmodified peptide is common (Boersema et al. 2009). Nevertheless, differences in phosphorylation of a protein may be detected indirectly via differences in the amount of nonmodified protein detected. In contrast to CPNE3 and RFTN1, the three tryptic peptides derived from PTPN1 showed no differences in association strength with COO-ABC in the PriOmics-non-CIG model, thus indicating that these three peptides are indeed technical replicates.
Besides investigating the explorative property of the PriOmics models, we also tested their predictive performance in a fourfold cross-validation. In detail, we estimated the probabilities of identifying the correct COO-status of the DLBCL specimens included in DS1 and DS2. To that end, it was necessary to find optimal cutoffs that define the probability ranges for each of the three COO subtypes. The PriOmics models resulted in an overall agreement rate (proportion of correctly classified COO labels) of 0.76 and 0.73 on data set DS1 averaged across all folds, respectively, for CIG and non-CIG. Compared with the true COO labels of the 66 ABC-like, 100 unclassified, and 178 GCB-like DLBCLs, as determined by NanoString nCounter gene expression analysis using the COO classifier of Szczepanowski et al. (2017), both PriOmics models yielded perfect areas under the receiver operating characteristics (AUC-ROCs) of one for the ABC and GCB specimens (Supplemental Figs. S31, S32). Only the unclassified specimens that lie in a gray area between GCB and ABC were difficult to predict with averaged ROC-AUCs of 0.76 (PriOmics-CIG) and 0.82 (PriOmics-non-CIG). The multiclass ROC-AUCs of COO predictions were 0.86 and 0.87 (Supplemental Table S8), respectively, for PriOmics-CIG and PriOmics-non-CIG. Consequently, reliable COO classification on the moderately sized DS1 (344 samples), along the solid simulation results for 250 and 375 samples (e.g., scenario 1a), suggest that PriOmics effectively captures key multiomics relationships even with moderate sample sizes.
Upon incorporation of additional transcriptomic features (data set DS2), the network of the ABC neighborhood (Fig. 4C) revealed associations for eight genes and one peptide. The gene MME (neprilysin) occurred twice, owing to its presence in both gene data sets. Again, most edge signs were flipped, comparing ABC to GCB specimens (Supplemental Fig. S29C), with “unclassified” specimens serving as reference. The only protein detected in both DS1 and DS2 was DNMT1, which yielded congruent signs of the edge weights. RAB29, member RAS oncogene family (RAB29) and IRAG2 were observed as protein entity in DS1 and as gene entity in DS2, which might indicate an increased predictive role of RNAs compared with respective proteins. Further, genes cyclin D2 (CCND2), MYB proto-oncogene like 1 (MYBL1), forkhead box P1 (FOXP1), inositol-trisphosphate 3-kinase B (ITPKB), and NIMA related kinase 6 (NEK6) were associated with COO. Out of the 20 genes for ABC/GCB classification proposed by Wright et al. (2003) and Reddy et al. (2017), PriOmics identified eight genes/proteins. The importance of FOXP1 as a main driver of DLBCL pathogenesis, especially in ABC-DLBCLs, was stated in multiple studies, although different FOXP1 isoforms might have different functions (Dekker et al. 2016; Gascoyne and Banham 2017). Further, CCND2 was repeatedly described as a prognostic marker (Wang et al. 2020; Li et al. 2021a). In a combined study of three cohorts with 250 GCB- and ABC-DLBCL patients each, Liu et al. (2018) identified 87 differentially expressed genes (DEGs) in the ABC group. Ten of these DEGs were also present in the PriOmics based networks of DS1 and/or DS2, namely MYBL1, MME, MARCKSL1 (MARCKS like 1), ITPKB, IRAG2, POSTN, IGHM, FOXP1, CCND2, and RAB29. All edge signs were in line with these findings, except POSTN. From the 19 COO-associated genes and proteins identified with PriOmics, SWAP70, CPNE3, and six other markers were also found in a study comparing EZB-DLBCL subtypes (Schmitz et al. 2018) to non-EZB-DLBCLs (Xu-Monette et al. 2022). An overview of the COO-associated genes and proteins identified by PriOmics-CIG is given in Supplemental Table S9. First-order neighborhoods of PLL-MGM derived networks on DS2 are shown in Supplemental Figure S33, A (GCB-DLBCL) and B (ABC-DLBCL). Details about the particular edge strengths of the COO-associated variables are displayed in Supplemental Figures S34–S39. Additional network analyses and corresponding figures can be found in Supplemental Methods Section 1, Supplemental Tables S10–S13, and Supplemental Figures S42–S49.
PriOmics reveals PTMs as confounding variables in high-throughput proteomic data
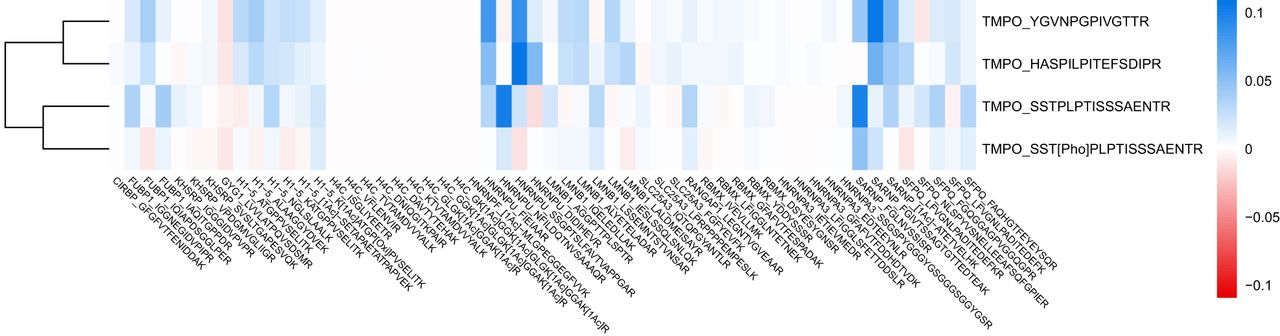
PriOmics-CIG assumes that the intensities of individual proteotypic peptides serve as a proxy for the underlying protein abundances, whereas PriOmics-non-CIG is more appropriate for proteins that are represented by both nonmodified and co- or post-translationally modified peptides, as CTMs and PTMs play important roles in the regulation of the lifetime, structure, activity, location, and interaction of proteins (Conibear 2020). However, quantitative assessment of modified peptides by mass spectrometry may be affected by differences in ionization efficiency and stability in collision-induced dissociation compared with the nonmodified paralog (Gao and Wang 2007). This has to be taken into consideration when interpreting differences in correlation patterns between nonmodified and post-translationally modified peptides with other proteins. The entire proteome data set contains only one pair of peptides representing both the nonmodified peptide and its modified paralog, which harbors a known PTM, namely, phosphorylation of T160 of thymopoietin (TMPO) (Fig. 5). Nonphosphorylated TMPO is an integral component of the inner nuclear membrane that binds to both lamin B1 (LMNB1) and chromatin. TMPO plays an important role in nuclear envelope organization (Foisner and Gerace 1993). In metaphase, upon phosphorylation, TMPO loses both its LMNB1 and chromosome binding ability, resulting in the disassembly of nuclei. During late anaphase and early telophase, TMPO becomes again localized to the surface of chromosomes, where it may facilitate reassembly of the nuclear envelope, whereas LMNB1 colocalizes with TMPO at detectable levels only upon completion of cytokinesis. There is no clear negative or positive correlation between the intensities of nonphosphorylated and phosphorylated TMPO and the intensities of the five LMNB1 peptides, which may be owing to subtle differences in ionization efficiency or technical variance of quantitation. However, there is a clear negative or at least weaker association with the nuclear ribonucleoproteins HNRNPU, HNRNPA3, and SFPQ, the histone H1-5, and the far upstream element binding protein 1 (FUBP1), which is a master transcription regulator of a number of genes, including MYC, and whose abundance has been already reported to decrease during mitosis (Kang et al. 2020). The decreased levels of HNRNPU and H1-5 observed with increased levels of phosphorylated TMPO reflect most likely their known phosphorylation during mitosis. The scaffold attachment factor A (SAF-A) or HNRNPU, a nuclear RNA-binding protein with RNA-to-DNA tethering activity, has been shown to remove, upon phosphorylation by Aurora-B, nuclear RNAs from the surface of prophase chromosomes to facilitate chromosome alignment and segregation in metaphase and anaphase, respectively (Sharp et al. 2020). Consequently, one would expect that the abundance of nonphosphorylated HNRNPU to correlate negatively with phosphorylated TMPO. This is particularly obvious for nonphosphorylated HNRNPU_S*S*GPT*S*LFAVTVAPPGAR, which contains four reported phosphorylation sites, marked by an asterisk, at amino acid positions S187, S188, T191, and S192. As these sites become phosphorylated, the abundance of nonmodified HNRNPU will decrease. Correspondingly, increasing phosphorylation of T10 of H1-5, which is contained in H1-5_[1Ac]-SETAPAETATPAPVEK, has been observed to start during prophase and to increase to its highest level in metaphase (Talasz et al. 2009). Another known threonine phosphorylation site is T39, which is found in H1-5_KATGPPVSELITK and H1-5_ATGPPVSELITK (Behrends and Engmann 2020). However, its cell cycle–dependent phosphorylation has not been investigated yet. The same holds true for heterogeneous nuclear ribonucleoprotein A3 (HNRNPA3), which has been implicated in the regulation of chromosome segregation (Ou et al. 2020), and whose serine residues at positions 355, 356, and 358, which are contained in the peptide HNRNPA3_SSGSPYGGGYGSGGGSGGYGSR, have been reported to be phosphorylated under cellular stress and transformation-promoting conditions. But whether these sites will also be phosphorylated during mitosis, as described for HNRNPU, remains to be elucidated. In summary, it appears that the PriOmics-non-CIG is capable of identifying PTMs that are of biological relevance.
Association patterns of four peptides affiliated with the protein encoded by TMPO (Lamina-associated polypeptide 2, isoforms beta/gamma) in a PriOmics-non-CIG model. Phosphorylation of the peptide SSTPLPTISSSAENTR (bottom) results in alternating association scheme. (1Ac) Acetylation; (Pho) phosphorylation; (Oxi) oxidation.
Discussion
In recent years, the complexity of biomedical data analysis increased substantially as a consequence of new experimental possibilities to generate (multi-)omic data. These data are usually high dimensional, comprising 10,000s and more molecular variables and generating both an increasingly detailed picture of biological systems and challenges for data analysis. One major challenge are so-called spurious or erroneous associations, which are indirect associations as a consequence of one or multiple mediating variables. As seen in our analysis and in those of many others (Schäfer and Strimmer 2005a; Shutta et al. 2023), applying ordinary multiple testing strategies is not sufficient to control these false-positive findings. Instead, variables have to be considered in their multivariate context to identify potential mediators of associations. PriOmics is designed to do so, while taking into account the specific nature of individual omics such as for untargeted high-throughput proteomic data. Moreover, PriOmics can model both continuous and categorical variables, which is a prerequisite to account for the increasing complexity of (multi-)omic data. We exemplified this by using PriOmics to integrate continuous variables such as peptide and RNA abundances with categorical variables, such as phenotypic variables, in DLBCL specimens. In our analysis, we could demonstrate that PriOmics established rather sparse models in which only 1.76% − 1.87% of all possible edges were present. Moreover, we could demonstrate that the joint analysis of multiple tiers of omics is a prerequisite to better resolve the underlying ground truth, as exemplified by edges established to the COO classification of DLBCLs. Here, we found that incorporating gene transcript levels in addition to peptide abundances, shielded COO associated peptides in favor of their respective RNA expression (seen for the gene–protein pairs IRAG2–IRAG2 and RAB29–RAB29) (Fig. 4). This may reflect the higher quantitative accuracy of measurements of gene expression over data-independent acquisition-based tandem mass spectrometry of tryptic digests of proteomes, although it cannot be excluded that COO is determined more strongly by gene rather than protein expression levels. Finally, we were able to retain highly relevant information about individual peptides without requiring further aggregation to protein abundances. This allowed us to reveal PTMs as potential confounding variables of respective protein abundances. One should also note that there is an increasing interest in PTMs as biomarkers and gateways for novel therapies in cancer treatment. PTMs occur by adding functional groups to the amino acid sequence of peptides, that is, phosphorylation, glycosylation, ubiquitination, and several others. Hence, they increase the complexity of the human proteome eminently. In cancer development, their importance has been stated repeatedly (Sharma et al. 2019; Chen et al. 2020; Li et al. 2021b), further highlighting the need for robust and accurate methods for both measuring and analyzing large-scale proteomic data.
Building on these observations, our simulation study illustrates the PriOmics’ performance gains compared with other state-of-the-art approaches. Specifically, the priors CIG and non-CIG provided a distinct advantage in handling grouped variables. Unlike PLL-MGM, which lacks mechanisms to model group structure effectively, PriOmics allows one to explicitly capture the conditional independence of redundant features, subsequently improving the general modeling performance. Additionally, PriOmics’ ability to retain peptide-level information yields insights that aggregation-based methods, such as maxLFQ, cannot provide. By preserving the nuances of PTMs and their effects, PriOmics offers new possibilities for understanding complex regulatory mechanisms, particularly in contexts like cancer biology, in which PTMs play pivotal roles (Karve and Cheema 2011; Narayan et al. 2016; Ardito et al. 2017). The robustness of PriOmics across various simulation settings further underscores its utility, as its systematic calibration using BIC/EBIC ensures stable model inference. MI-based methods, although widely used for their simplicity, often generated dense networks in our simulations with indirect, less relevant associations. PriOmics, employing a multivariate framework, addresses this by capturing complex dependency structures, yielding sparser, biologically more interpretable networks with fewer false positives. A similar statement was drawn by Çakır et al. (2009), in which the advantages of partial correlation-based networks compared to relevance networks were highlighted for simulated metabolic networks. Compared with MOFA (Argelaguet et al. 2018), PriOmics offers enhanced specificity by modeling peptide-level data directly rather than focusing on shared latent factors, which can obscure biological details such as PTMs. Although those general approaches for multiomics integration are broadly applicable, they often lack domain-specific adjustments, such as the grouping priors that PriOmics employs to reflect the biological relationships between peptides and proteins. Additionally, dimensionality reduction can challenge interpretation, whereas PriOmics is designed to maintain high-resolution insights.
PriOmics incorporates many aspects relevant for state-of-the-art omic analysis, but it does have some limitations. PriOmics networks are undirected, meaning that PriOmics cannot infer causal relationships. The latter can be clarified by prior knowledge. Moreover, there is ongoing research on establishing causal relationships from observational data, which could be also promising in combination with PriOmics. Kernfeld et al. (2024), for example, utilize model-X knockoffs to effectively manage causality and control false-discovery rates in multiomics data. Further, we want to emphasize that although PriOmics can properly deal with both categorical and continuous data, it makes assumptions about the data, namely, that the variables follow probability density Equation 1. This might be inappropriate for continuous variables, which strongly deviate from normality. Here, data transformations could be an option. Moreover, technical copies of variables were incorporated by a priori removing specific edges and by using optimized regularization strategies, not directly in terms of a joint probability density. Despite this limitation, it worked well in practice and offers a reasonable trade-off in analyses in which it is not entirely clear if variables are copies or if they carry distinct biological information.
In summary, PriOmics facilitates the joint analysis of complex multiomics data, especially proteomic data, while making a priori peptide to protein aggregation obsolete. The latter allows for retention of potentially relevant biological information such as those related to CTMs and PTMs. Moreover, PriOmics ability to model both continuous and categorical variables might open numerous possibilities to explore the complex interplay between the different tiers of regulation captured by nowadays omics.
Methods
Mixed graphical model
Probability density function
MGMs can simultaneously account for different data types. We closely follow the nomenclature of Lee and Hastie (2015) and build on their probability density function
PriOmics
PriOmics builds on mixed graphical modeling to facilitate the integration of high-throughput proteomic data with additional complex data sources, such as complementary omic layers and/or phenotypic information. It models the data on the level of peptides to reveal potentially relevant regulatory mechanisms and induces parsimonious network structures, taking into account prespecified peptide groups (see also Supplemental Fig. S40). Importantly, PriOmics allows to quantify our assumptions about biological data by selecting between two different grouping priors. A summary of these priors together with standard peptide-based and protein-based network inference concepts is shown in Figures 1 and 2.
Group priors
Prior “CIG”–conditionally independent variables (grouped)
Multiple proteotypic peptides likely represent the same biological variable in a network (here a protein abundance). However, this cannot be guaranteed. For instance, summing up or averaging only the intensities of nonmodified peptides or both nonmodified and modified peptides of a protein may mask important functional information. Thus, there are good reasons for either treating peptides as technical copies or as individual biological variables. Consequently, an appropriate prior should be a trade-off between both. Our suggested strategy is to enforce conditional independence among peptides, which belong to the same protein, and to group them via group regularization terms, as argued in the following.
The conditional probability , see Equation 3, corresponds to the linear regression of response variable xs on the predictor variables and y (Hastie et al. 2009). Let variable xs and be two members of a group S, where S collects the indices of a set of redundant variables (technical copies), that is, noisy copies of an identical biological variable. Then, first, if xs is the regression target, none of the variables should be included as predictor variable; otherwise, a perfect copy of xs would explain all variance of xs. This motivates the enforcement of conditional independence between s and via setting during model development. Vice versa, if we consider variable xt with as a regression target, then the variable that is represented by the members of group S contributes |S| times (via its copies). This constraint cannot be directly incorporated into model development, because it would violate Equation 2. However, it is still possible to take into account the grouping property via appropriate regularization strategies. Namely, we employ a group-LASSO regularization, which enforces group-wise sparseness parsimonious networks (see also Fig. 2; Supplemental Fig. S40). To achieve this, we augmented Equation 2 by the regularization terms
Prior “non-CIG”–nonconditionally independent variables (grouped)
This prior groups variables that are not ordinary copies of the same biological variable and, therefore, could potentially affect each other. Hence, we do not make any a priori assumptions about conditional independence among the grouped variables. A typical scenario in which this prior will apply are differentially spliced mRNA isoforms of the same gene. Formally, PriOmics-non-CIG accounts for the group membership only via regularization Equation 5, and thus, members of a group are allowed to be connected by an edge. In contrast to prior CIG, no additional constraint such as setting for within-group pairs is imposed here.
Hyperparameter tuning
The calibration of hyperparameter λ was performed using either the BIC (Schwarz 1978) or the EBIC (Chen and Chen 2008). Both criteria provide a measure of model fit on the training data themselves, making expansive resampling strategies unnecessary. In line with the work of Sedgewick et al. (2016), we evaluated the pseudo-log-likelihood of Equation 1 to reduce computational burden. Throughout this article, we used either BIC or EBIC with the hyperparameter γ = 0.5. The latter results in a moderately more conservative model. For each model, we evaluated a series of 30 different λ values.
PriOmics code implementation
PriOmics was developed and tested in R using version 4.3.1 (R Core Team 2023) and Python 3.12.0. Large network visualizations were conducted with the R package “visNetwork” (https://cran.r-project.org/web/packages/visNetwork/index.html), and small network visualizations and network properties were generated using the “igraph” R package (Csardi et al. 2006).
Competing methods
Methods for the inference of MGMs are still scarce. We evaluated the following competing methods: First, we implemented the PLL-MGM method suggested by Lee and Hastie (2015) that uses a maximum likelihood approach, which forms also the backbone of PriOmics. Hyperparameter tuning was performed in line with PriOmics, by evaluating EBIC across a range of λ values (30 values) (Supplemental Figs. S18–S23). This implementation serves as baseline to assess the performance of the suggested PriOmics group priors. Second, additionally, we used the implementation of the node-wise LASSO regression for MGMs (NW-MGM) approach provided in the R-package “mgm” (Haslbeck and Waldorp 2020). Here, the EBIC (with recommended γ = 0.25) was applied again to maintain comparability, and the standard settings for hyperparameter tuning were used, in which a logarithmic sequence of 100 different λ values is evaluated. The following three inference methods construct networks based on MI, implemented in the R package “minet”: ARACNE (Margolin et al. 2006) applies the concept of data processing inequality (DPI) to filter for indirect associations; CLR (Faith et al. 2007) relies on relevance networks (Butte and Kohane 1999) but uses adaptive MI thresholds to detect interactions in noisy data; MRNET (Meyer et al. 2007) aims to reduce the number of redundant interactions. ARACNE, CLR, and MRNET were implemented using the default settings. The “Spearman” method was employed as entropy estimator to compute the MI for CLR, ARACNE, and MRNET. ARACNE, CLR, and, MRNET have been benchmarked in multiple studies. Meyer et al. (2007) demonstrated MRNET's competitiveness with CLR and ARACNE in large-scale network inference using synthetic microarray data sets. Olsen et al. (2009) further compared their performance, showing CLR (with Pearson's correlation) and MRNET (with Spearman correlation) as top performers in yeast transcriptional network inference. Lastly, to compare PriOmics to conventional peptide–protein aggregation approaches, we utilized the maxLFQ algorithm by Cox et al. (2014) implemented in the R package “iq” (Pham et al. 2020). After this aggregation, we applied the PLL-MGM from step 2. We refer to this procedure as “maxLFQ-PLL-MGM.”
Performance measures
The performance of the algorithms was evaluated by comparing the estimated model parameters to the ground-truth Θ used to simulate the data. There, we analyzed whether an association between two features (i.e., the presence of an edge) could be reconstructed using MCC. MCC was used because of its effective handling of class imbalances inherent in network inference. For the supplemental evaluations, we ranked edges according to their absolute strengths to calculate AUC-ROCs and the AUC-PRs using the R package “precrec” (Saito and Rehmsmeier 2017).
DLBCL data set and preprocessing
Study cohorts
All patients had been enrolled in prospective multicenter DSHNHL clinical trials. Only DLBCL samples from patients who had received rituximab were included (n = 357). These trials included patients with more than 60 years of age—RICOVER-60 (n = 88) (Pfreundschuh et al. 2008), RICOVER-noRTh (n = 66) (Held et al. 2014), DENSER (n = 44) (Murawski et al. 2014), and SMARTER (n = 75) (Pfreundschuh et al. 2014)—and between 18 and 60 years of age—MInT (German patients only, n = 22) (Pfreundschuh et al. 2011), MegaCHOEP phase III (n = 43) (Schmitz et al. 2012), and MegaCHOEP observation (n = 19) (Friedrichs et al. 2019). Patients were treated with six or eight cycles of CHO(E)P-like treatment with rituximab dosed at 375 mg/m2 (for details, see publications). Diagnostic samples were reviewed by expert hematopathologists according to the 2008 WHO classification (Swerdlow et al. 2017). Clinical trials were conducted in accordance with the Helsinki declaration, and the protocol had been approved by the ethics review committee of each participating center.
Proteomic data
Protein intensities were normalized by the total sum of protein intensities of the respective sample. Further, we detected 13 samples that showed a strong batch effect in a principal component analysis. Consequently, we removed these samples from further analyses, resulting in 344 samples, including in total the label-free mass spectrometric intensities of 7720 nonmodified peptides and 666 peptides with CTMs and/or PTMs.
Transcriptomic data
In addition to the proteomic data, two transcriptomic data sets were utilized, including 145 genes measured by NanoString nCounter (Staiger et al. 2020) and 296 genes measured by HTG EdgeSeq (for overview, see Supplemental Table S4), both containing typical genes relevant for COO subtyping and genes characterizing the tumor-microenvironment. These transcriptomic data were available for 330 of the 344 samples.
Clinical/phenotypic data and data aggregation
To complement the omics data, 10 categorical variables (nine binary variables and one multilabel variable) were included (Supplemental Table S5) for the same patients. First, we applied PriOmics to the proteomic data set including the clinical and phenotypic features, referred to as data set 1 (DS1; 344 samples). Second, we applied PriOmics to the joint data set (DS2, 330 samples), consisting of proteomics, transcriptomics, and clinical and phenotypic data. Data sets DS1 and DS2 are summarized in Supplemental Table S4.
Preprocessing
The proteomic data contained a total of 80 missing values (0.0000023% of all measurements), which were imputed with the respective patient sample mean value. To improve data quality, we only included those peptides that showed a local FDR value (Tang et al. 2008) lower than 0.2 in at least 80% of patients (0.4 in at least 60% of patients for the modified peptides). The final data sets included 2033 nonmodified and 198 modified peptides, which could be attributed to 1056 individual proteins. The distribution of the peptide group sizes is shown in Supplemental Figure S41. Both, the proteomic and transcriptomic data were normalized by (1) dividing each value by the corresponding patient mean, (2) performing a log2 transformation, and (3) standardizing the variables.
Code availability
The algorithm is publicly available as user-friendly R package “PriOmics” in the GitHub repository (https://github.com/roko4/PriOmics) or as a Python package “PriOmics-Py” at GitHub (https://github.com/roko4/PriOmics-Py). The scripts for conducting the simulation studies are available at Figshare (https://doi.org/10.6084/m9.figshare.28054094.v1). Scripts are also available as Supplemental Code.
Data access
All raw and processed gene expression data used in this study are available via NCBI Gene Expression Omnibus (GEO; https://www.ncbi.nlm.nih.gov/geo/) under accession numbers GSE253910 (HTG) and GSE280418 (Nanostring nCounter). The mass spectrometry proteomic data are available via the ProteomeXchange Consortium (https://proteomecentral.proteomexchange.org/ui) (Pérez-Riverol et al. 2019) under accession number PXD058736. Clinical data are available via the European Genome-phenome Archive (EGA; https://ega-archive.org/datasets/) under accession number EGAD50000001536.
Competing interest statement
R. Siebert received speaker's honoraria from AstraZeneca and Rhythm Diagnostics. Reagents for HTG RNA measurements were obtained from HTG at reduced fees.
Acknowledgments
We thank all people involved in the study “German High Grade Lymphoma Study Group (DSHNHL),” particularly Lorenz Trümper, the organizers, and all participants for providing tumor samples. Further, we thank Anke Bauer and Sina Hillebrecht for performing HTG expression analyses, as well as Katja Dettmer for uploading the proteomic data. This work was supported by the German Federal Ministry of Education and Research (BMBF) within the framework of the e:Med research and funding concept (grants no. 01ZX1912A and no. 01ZX1912C), and the Wilhelm Sander-Stiftung (grant no. 2018.037.1).
Author contributions: M.A., P.J.O., R. Spang, and R.K. formulated the idea. M.A., R.K., N.S.K., B.O., and S.S. implemented the algorithm. K.L., A.M.S., V.P., G.H., M.Z., N. Schmitz, E.C., R. Siebert, G.O., and P.J.O. generated and provided the biomedical data. R.K., P.J.O., and M.A. designed and performed the in-silico experiments. R.K., P.J.O., and M.A. analyzed the data. R.K., A.M.S., N. Seifert, R. Siebert, H.U.Z., G.O., P.J.O., and M.A. interpreted the results. All authors contributed in evaluating and writing the manuscript.
Notes
[1] Supplementary material [Supplemental material is available for this article.]
[2] Article published online before print. Article, supplemental material, and publication date are at https://www.genome.org/cgi/doi/10.1101/gr.279487.124.
References
- ↵Abe K, Shimamura T. 2023. UNMF: a unified nonnegative matrix factorization for multi-dimensional omics data. Brief Bioinformatics 24: bbad253. 10.1093/bib/bbad253
- ↵Aebersold R, Mann M. 2016. Mass-spectrometric exploration of proteome structure and function. Nature 537: 347–355. 10.1038/nature19949
- ↵Alizadeh AA, Eisen MB, Davis RE, Ma C, Lossos IS, Rosenwald A, Boldrick JC, Sabet H, Tran T, Yu X, 2000. Distinct types of diffuse large B-cell lymphoma identified by gene expression profiling. Nature 403: 503–511. 10.1038/35000501
- ↵Altenbuchinger M, Zacharias HU, Solbrig S, Schäfer A, Büyüközkan M, Schultheiß UT, Kotsis F, Köttgen A, Spang R, Oefner PJ, 2019. A multi-source data integration approach reveals novel associations between metabolites and renal outcomes in the German chronic kidney disease study. Sci Rep 9: 13954. 10.1038/s41598-019-50346-2
- ↵Altenbuchinger M, Weihs A, Quackenbush J, Grabe HJ, Zacharias HU. 2020. Gaussian and mixed graphical models as (multi-) omics data analysis tools. Biochim Biophys Acta 1863: 194418. 10.1016/j.bbagrm.2019.194418
- ↵Archer TC, Ehrenberger T, Mundt F, Gold MP, Krug K, Mah CK, Mahoney EL, Daniel CJ, LeNail A, Ramamoorthy D, 2018. Proteomics, post-translational modifications, and integrative analyses reveal molecular heterogeneity within medulloblastoma subgroups. Cancer Cell 34: 396–410.e8. 10.1016/j.ccell.2018.08.004
- ↵Ardito F, Giuliani M, Perrone D, Troiano G, Lo Muzio L. 2017. The crucial role of protein phosphorylation in cell signaling and its use as targeted therapy (review). Int J Mol Med 40: 271–280. 10.3892/ijmm.2017.3036
- ↵Argelaguet R, Velten B, Arnol D, Dietrich S, Zenz T, Marioni JC, Buettner F, Huber W, Stegle O. 2018. Multi-omics factor analysis—a framework for unsupervised integration of multi-omics data sets. Mol Syst Biol 14: e8124. 10.15252/msb.20178124
- ↵Bader JM, Geyer PE, Müller JB, Strauss MT, Koch M, Leypoldt F, Koertvelyessy P, Bittner D, Schipke CG, Incesoy EI, 2020. Proteome profiling in cerebrospinal fluid reveals novel biomarkers of Alzheimer's disease. Mol Syst Biol 16: e9356. 10.15252/msb.20199356
- ↵Bai B, Wang X, Li Y, Chen PC, Yu K, Dey KK, Yarbro JM, Han X, Lutz BM, Rao S, 2020. Deep multilayer brain proteomics identifies molecular networks in Alzheimer's disease progression. Neuron 105: 975–991.e7. 10.1016/j.neuron.2019.12.015
- ↵Baranov MV, Revelo NH, Dingjan I, Maraspini R, Ter Beest M, Honigmann A, van den Bogaart G. 2016. SWAP70 organizes the actin cytoskeleton and is essential for phagocytosis. Cell Rep 17: 1518–1531. 10.1016/j.celrep.2016.10.021
- ↵Behrends M, Engmann O. 2020. Linker histone H1.5 is an underestimated factor in differentiation and carcinogenesis. Environ Epigenet 6: dvaa013. 10.1093/eep/dvaa013
- ↵Benjamini Y, Hochberg Y. 1995. Controlling the false discovery rate: a practical and powerful approach to multiple testing. J R Statist Soc B Methodol 57: 289–300. 10.1111/j.2517-6161.1995.tb02031.x
- ↵Blenk S, Engelmann J, Weniger M, Schultz J, Dittrich M, Rosenwald A, Müller-Hermelink HK, Müller T, Dandekar T. 2007. Germinal center B cell-like (GCB) and activated B cell-like (ABC) type of diffuse large B cell lymphoma (DLBCL): analysis of molecular predictors, signatures, cell cycle state and patient survival. Cancer Inform 3. 10.1177/117693510700300004
- ↵Boersema PJ, Mohammed S, Heck AJ. 2009. Phosphopeptide fragmentation and analysis by mass spectrometry. J Mass Spectrom 44: 861–878. 10.1002/jms.1599
- ↵Butte AJ, Kohane IS. 1999. Mutual information relevance networks: functional genomic clustering using pairwise entropy measurements. Biocomputing 2000: 418–429. 10.1142/9789814447331_0040
- ↵Çakır T, Hendriks MM, Westerhuis JA, Smilde AK. 2009. Metabolic network discovery through reverse engineering of metabolome data. Metabolomics 5: 318–329. 10.1007/s11306-009-0156-4
- ↵Chapuy B, Stewart C, Dunford AJ, Kim J, Kamburov A, Redd RA, Lawrence MS, Roemer MG, Li AJ, Ziepert M, 2018. Molecular subtypes of diffuse large B cell lymphoma are associated with distinct pathogenic mechanisms and outcomes. Nat Med 24: 679–690. 10.1038/s41591-018-0016-8
- ↵Chen J, Chen Z. 2008. Extended Bayesian information criteria for model selection with large model spaces. Biometrika 95: 759–771. 10.1093/biomet/asn034
- ↵Chen L, Liu S, Tao Y. 2020. Regulating tumor suppressor genes: post-translational modifications. Signal Transduct Target Ther 5: 90. 10.1038/s41392-020-0196-9
- ↵Conibear AC. 2020. Deciphering protein post-translational modifications using chemical biology tools. Nat Rev Chem 4: 674–695. 10.1038/s41570-020-00223-8
- ↵Cox J, Hein MY, Luber CA, Paron I, Nagaraj N, Mann M. 2014. Accurate proteome-wide label-free quantification by delayed normalization and maximal peptide ratio extraction, termed MaxLFQ. Mol Cell Proteomics 13: 2513–2526. 10.1074/mcp.M113.031591
- ↵Csardi G, Nepusz T. 2006. The igraph software package for complex network research. InterJ Complex Syst 1695: 1–9.
- ↵Dang CV. 2012. MYC on the path to cancer. Cell 149: 22–35. 10.1016/j.cell.2012.03.003
- ↵Dekker JD, Park D, Shaffer AL, Kohlhammer H, Deng W, Lee BK, Ippolito GC, Georgiou G, Iyer VR, Staudt LM, 2016. Subtype-specific addiction of the activated B-cell subset of diffuse large B-cell lymphoma to FOXP1. Proc Natl Acad Sci 113: E577–E586. 10.1073/pnas.1524677113
- ↵Ennishi D, Jiang A, Boyle M, Collinge B, Grande BM, Ben-Neriah S, Rushton C, Tang J, Thomas N, Slack GW, 2019. Double-hit gene expression signature defines a distinct subgroup of germinal center B-cell-like diffuse large B-cell lymphoma. J Clin Oncol 37: 190–201. 10.1200/JCO.18.01583
- ↵Faith JJ, Hayete B, Thaden JT, Mogno I, Wierzbowski J, Cottarel G, Kasif S, Collins JJ, Gardner TS. 2007. Large-scale mapping and validation of Escherichia coli transcriptional regulation from a compendium of expression profiles. PLoS Biol 5: e8. 10.1371/journal.pbio.0050008
- ↵Feng H, Ning Y. 2019. High-dimensional mixed graphical model with ordinal data: parameter estimation and statistical inference. In Proceedings of the Twenty-Second International Conference on Artificial Intelligence and Statistics, Naha, Japan (ed. Chaudhuri K, Sugiyama M), pp. 654–663. PMLR, Cambridge, MA.
- ↵Foisner R, Gerace L. 1993. Integral membrane proteins of the nuclear envelope interact with lamins and chromosomes, and binding is modulated by mitotic phosphorylation. Cell 73: 1267–1279. 10.1016/0092-8674(93)90355-T
- ↵Friedman J, Hastie T, Tibshirani R. 2008. Sparse inverse covariance estimation with the graphical lasso. Biostatistics 9: 432–441. 10.1093/biostatistics/kxm045
- ↵Friedrichs B, Nickelsen M, Ziepert M, Altmann B, Haenel M, Viardot A, Schmidt C, Ruebe C, Loeffler M, Pfreundschuh M, 2019. Doubling rituximab in high-risk patients with aggressive B-cell lymphoma-results of the DENSE-R-mega CHOEP trial. Br J Haematol 184: 760–768. 10.1111/bjh.15710
- ↵Gao Y, Wang Y. 2007. A method to determine the ionization efficiency change of peptides caused by phosphorylation. J Am Soc Mass Spectrom 18: 1973–1976. 10.1016/j.jasms.2007.08.010
- ↵Gascoyne DM, Banham AH. 2017. The significance of FOXP1 in diffuse large B-cell lymphoma. Leuk Lymphoma 58: 1037–1051. 10.1080/10428194.2016.1228932
- ↵Hans CP, Weisenburger DD, Greiner TC, Gascoyne RD, Delabie J, Ott G, Muller-Hermelink HK, Campo E, Braziel RM, Jaffe ES, 2004. Confirmation of the molecular classification of diffuse large B-cell lymphoma by immunohistochemistry using a tissue microarray. Blood 103: 275–282. 10.1182/blood-2003-05-1545
- ↵Haslbeck J, Waldorp LJ. 2020. mgm: estimating time-varying mixed graphical models in high-dimensional data. J Stat Softw 93: 1–46. 10.18637/jss.v093.i08
- ↵Hastie T, Tibshirani R, Friedman JH, Friedman JH. 2009. The elements of statistical learning: data mining, inference, and prediction, Vol. 2. Springer, New York.
- ↵Held G, Murawski N, Ziepert M, Fleckenstein J, Pöschel V, Zwick C, Bittenbring J, Hänel M, Wilhelm S, Schubert J, 2014. Role of radiotherapy to bulky disease in elderly patients with aggressive B-cell lymphoma. J Clin Oncol 32: 1112–1118. 10.1200/JCO.2013.51.4505
- ↵Hernández-Lemus E, Ochoa S. 2024. Methods for multi-omic data integration in cancer research. Front Genet 15: 1425456. 10.3389/fgene.2024.1425456
- ↵Hüttenhain R, Choi M, de la Fuente LM, Oehl K, Chang CY, Zimmermann AK, Malander S, Olsson H, Surinova S, Clough T, 2019. A targeted mass spectrometry strategy for developing proteomic biomarkers: a case study of epithelial ovarian cancer. Mol Cell Proteomics 18: 1836–1850. 10.1074/mcp.RA118.001221
- ↵Kang M, Kim HJ, Kim TJ, Byun JS, Lee JH, Lee DH, Kim W, Kim DY. 2020. Multiple functions of Fubp1 in cell cycle progression and cell survival. Cells 9: 1347. 10.3390/cells9061347
- ↵Karve TM, Cheema AK. 2011. Small changes huge impact: the role of protein posttranslational modifications in cellular homeostasis and disease. J Amino Acids 2011: 207691. 10.4061/2011/207691
- ↵Kernfeld E, Keener R, Cahan P, Battle A. 2024. Transcriptome data are insufficient to control false discoveries in regulatory network inference. Cell Syst 15: 709–724.e13. 10.1016/j.cels.2024.07.006
- ↵Lee JD, Hastie TJ. 2015. Learning the structure of mixed graphical models. J Comput Graph Stat 24: 230–253. 10.1080/10618600.2014.900500
- ↵Lee DD, Seung HS. 1999. Learning the parts of objects by non-negative matrix factorization. Nature 401: 788–791. 10.1038/44565
- ↵Lenz G, Wright G, Dave S, Xiao W, Powell J, Zhao H, Xu W, Tan B, Goldschmidt N, Iqbal J, 2008. Stromal gene signatures in large-B-cell lymphomas. N Engl J Med 359: 2313–2323. 10.1056/NEJMoa0802885
- ↵Li B, Dewey CN. 2011. RSEM: accurate transcript quantification from RNA-Seq data with or without a reference genome. BMC Bioinformatics 12: 323. 10.1186/1471-2105-12-323
- ↵Li Q, Meng Y, Hu L, Charwudzi A, Zhu W, Zhai Z. 2021a. Integrative analysis of hub genes and key pathway in two subtypes of diffuse large B-cell lymphoma by bioinformatics and basic experiments. J Clin Lab Anal 35: e23978. 10.1002/jcla.23978
- ↵Li W, Li F, Zhang X, Lin HK, Xu C. 2021b. Insights into the post-translational modification and its emerging role in shaping the tumor microenvironment. Signal Transduct Target Ther 6: 422. 10.1038/s41392-021-00825-8
- ↵Li Y, Xia R, Liu C, Sun L. 2022. A hybrid causal structure learning algorithm for mixed-type data. In Proceedings of the AAAI conference on artificial intelligence, Virtual Conference, Vancouver, Canada, Vol. 36/7, pp. 7435–7443. AAAI Press, Washington, DC.
- ↵Liu Z, Zhan Y, Tu Y, Chen K, Wu C. 2015. PDZ and LIM domain protein 1(PDLIM1)/CLP36 promotes breast cancer cell migration, invasion and metastasis through interaction with α-actinin. Oncogene 34: 1300–1311. 10.1038/onc.2014.64
- ↵Liu Z, Meng J, Li X, Zhu F, Liu T, Wu G, Zhang L. 2018. Identification of hub genes and key pathways associated with two subtypes of diffuse large B-cell lymphoma based on gene expression profiling via integrated bioinformatics. Biomed Res Int 2018: 3574534. 10.1155/2018/3574534
- ↵Loo SK, Hamid SSA, Musa M, Wong KK. 2018. DNMT1 is associated with cell cycle and DNA replication gene sets in diffuse large B-cell lymphoma. Pathol Res Pract 214: 134–143. 10.1016/j.prp.2017.10.005
- ↵Ludwig C, Claassen M, Schmidt A, Aebersold R. 2012. Estimation of absolute protein quantities of unlabeled samples by selected reaction monitoring mass spectrometry. Mol Cell Proteomics 11: M111.013987. 10.1074/mcp.M111.013987
- ↵Ludwig C, Gillet L, Rosenberger G, Amon S, Collins BC, Aebersold R. 2018. Data-independent acquisition-based SWATH-MS for quantitative proteomics: a tutorial. Mol Syst Biol 14: e8126. 10.15252/msb.20178126
- ↵Margolin AA, Nemenman I, Basso K, Wiggins C, Stolovitzky G, Favera RD, Califano A. 2006. ARACNE: an algorithm for the reconstruction of gene regulatory networks in a mammalian cellular context. BMC Bioinformatics 7(Suppl. 1): S7. 10.1186/1471-2105-7-S1-S7
- ↵Masat L, Caldwell J, Armstrong R, Khoshnevisan H, Jessberger R, Herndier B, Wabl M, Ferrick D. 2000. Association of SWAP-70 with the B cell antigen receptor complex. Proc Natl Acad Sci 97: 2180–2184. 10.1073/pnas.040374497
- ↵Meng S, Su Z, Liu Z, Wang N, Wang Z. 2015. Rac1 contributes to cerebral ischemia reperfusion-induced injury in mice by regulation of Notch2. Neuroscience 306: 100–114. 10.1016/j.neuroscience.2015.08.014
- ↵Mensah IK, Norvil AB, AlAbdi L, McGovern S, Petell CJ, He M, Gowher H. 2021. Misregulation of the expression and activity of DNA methyltransferases in cancer. NAR Cancer 3: zcab045. 10.1093/narcan/zcab045
- ↵Meyer PE, Kontos K, Lafitte F, Bontempi G. 2007. Information-theoretic inference of large transcriptional regulatory networks. EURASIP J Bioinform Syst Biol 2007: 79879. 10.1155/2007/79879
- ↵Murawski N, Pfreundschuh M, Zeynalova S, Poeschel V, Hänel M, Held G, Schmitz N, Viardot A, Schmidt C, Hallek M, 2014. Optimization of rituximab for the treatment of DLBCL (I): dose-dense rituximab in the DENSE-R-CHOP-14 trial of the DSHNHL. Ann Oncol 25: 1800–1806. 10.1093/annonc/mdu208
- ↵Narayan S, Bader GD, Reimand J. 2016. Frequent mutations in acetylation and ubiquitination sites suggest novel driver mechanisms of cancer. Genome Med 8: 55. 10.1186/s13073-016-0311-2
- ↵NHLPF Project. 1993. A predictive model for aggressive non-Hodgkin's lymphoma. N Engl J Med 329: 987–994. 10.1056/NEJM199309303291402
- ↵Non-Hodgkin's Lymphoma Classification Project. 1997. A clinical evaluation of the international lymphoma study group classification of non-Hodgkin's lymphoma. Blood 89: 3909–3918.
- ↵O'Donoghue B, Candès E. 2015. Adaptive restart for accelerated gradient schemes. Found Comput Mathe 15: 715–732. 10.1007/s10208-013-9150-3
- ↵Olsen C, Meyer PE, Bontempi G. 2009. On the impact of entropy estimation on transcriptional regulatory network inference based on mutual information. EURASIP J Bioinform Syst Biol 2009: 308959. 10.1155/2009/308959
- ↵Ou MY, Ju XC, Cai YJ, Sun XY, Wang JF, Fu XQ, Sun Q, Luo ZG. 2020. Heterogeneous nuclear ribonucleoprotein A3 controls mitotic progression of neural progenitors via interaction with cohesin. Development 147: dev185132. 10.1242/dev.185132
- ↵Pearce G, Angeli V, Randolph GJ, Junt T, von Andrian U, Schnittler HJ, Jessberger R. 2006. Signaling protein SWAP-70 is required for efficient B cell homing to lymphoid organs. Nat Immunol 7: 827–834. 10.1038/ni1365
- ↵Pérez-Riverol Y, Csordas A, Bai J, Bernal-Llinares M, Hewapathirana S, Kundu DJ, Inuganti A, Griss J, Mayer G, Eisenacher M, 2019. The PRIDE database and related tools and resources in 2019: improving support for quantification data. Nucleic Acids Res 47: D442–D450. 10.1093/nar/gky1106
- ↵Pfreundschuh M, Schubert J, Ziepert M, Schmits R, Mohren M, Lengfelder E, Reiser M, Nickenig C, Clemens M, Peter N, 2008. Six versus eight cycles of bi-weekly CHOP-14 with or without rituximab in elderly patients with aggressive CD20+ B-cell lymphomas: a randomised controlled trial (RICOVER-60). Lancet Oncol 9: 105–116. 10.1016/S1470-2045(08)70002-0
- ↵Pfreundschuh M, Kuhnt E, Trümper L, Österborg A, Trneny M, Shepherd L, Gill DS, Walewski J, Pettengell R, Jaeger U, 2011. CHOP-like chemotherapy with or without rituximab in young patients with good-prognosis diffuse large-B-cell lymphoma: 6-year results of an open-label randomised study of the MabThera international trial (MInT) group. Lancet Oncol 12: 1013–1022. 10.1016/S1470-2045(11)70235-2
- ↵Pfreundschuh M, Poeschel V, Zeynalova S, Hänel M, Held G, Schmitz N, Viardot A, Dreyling MH, Hallek M, Mueller C, 2014. Optimization of rituximab for the treatment of diffuse large B-cell lymphoma (II): extended rituximab exposure time in the SMARTE-R-CHOP-14 trial of the German high-grade non-Hodgkin lymphoma study group. J Clin Oncol 32: 4127–4133. 10.1200/JCO.2013.54.6861
- ↵Pham TV, Henneman AA, Jimenez CR. 2020. Iq: an R package to estimate relative protein abundances from ion quantification in DIA-MS-based proteomics. Bioinformatics 36: 2611–2613. 10.1093/bioinformatics/btz961
- ↵Picard M, Scott-Boyer MP, Bodein A, Périn O, Droit A. 2021. Integration strategies of multi-omics data for machine learning analysis. Comput Struct Biotechnol J 19: 3735–3746. 10.1016/j.csbj.2021.06.030
- ↵R Core Team. 2023. R: a language and environment for statistical computing. R Foundation for Statistical Computing, Vienna. https://www.R-project.org/.
- ↵Reddy A, Zhang J, Davis NS, Moffitt AB, Love CL, Waldrop A, Leppa S, Pasanen A, Meriranta L, Karjalainen-Lindsberg ML, 2017. Genetic and functional drivers of diffuse large B cell lymphoma. Cell 171: 481–494.e15. 10.1016/j.cell.2017.09.027
- ↵Ree R, Varland S, Arnesen T. 2018. Spotlight on protein N-terminal acetylation. Exp Mol Med 50: 1–13. 10.1038/s12276-018-0116-z
- ↵Reinders J, Altenbuchinger M, Limm K, Schwarzfischer P, Scheidt T, Strasser L, Richter J, Szczepanowski M, Huber CG, Klapper W, 2020. Platform independent protein-based cell-of-origin subtyping of diffuse large B-cell lymphoma in formalin-fixed paraffin-embedded tissue. Sci Rep 10: 7876. 10.1038/s41598-020-64212-z
- ↵Rimsza LM, Wright G, Schwartz M, Chan WC, Jaffe ES, Gascoyne RD, Campo E, Rosenwald A, Ott G, Cook JR, 2011. Accurate classification of diffuse large B-cell lymphoma into germinal center and activated B-cell subtypes using a nuclease protection assay on formalin-fixed, paraffin-embedded tissues. Clin Cancer Res 17: 3727–3732. 10.1158/1078-0432.CCR-10-2573
- ↵Ritchie MD, Holzinger ER, Li R, Pendergrass SA, Kim D. 2015. Methods of integrating data to uncover genotype–phenotype interactions. Nat Rev Genet 16: 85–97. 10.1038/nrg3868
- ↵Rosenwald A, Wright G, Chan WC, Connors JM, Campo E, Fisher RI, Gascoyne RD, Muller-Hermelink HK, Smeland EB, Giltnane JM, 2002. The use of molecular profiling to predict survival after chemotherapy for diffuse large-B-cell lymphoma. N Engl J Med 346: 1937–1947. 10.1056/NEJMoa012914
- ↵Saito T, Rehmsmeier M. 2017. Precrec: fast and accurate precision–recall and ROC curve calculations in R. Bioinformatics 33: 145–147. 10.1093/bioinformatics/btw570
- ↵Salie MT, Yang J, Ramírez Medina CR, Zühlke LJ, Chishala C, Ntsekhe M, Gitura B, Ogendo S, Okello E, Lwabi P, 2022. Data-independent acquisition mass spectrometry in severe rheumatic heart disease (RHD) identifies a proteomic signature showing ongoing inflammation and effectively classifying RHD cases. Clin Proteomics 19: 7. 10.1186/s12014-022-09345-1
- ↵Schäfer J, Strimmer K. 2005a. An empirical Bayes approach to inferring large-scale gene association networks. Bioinformatics 21: 754–764. 10.1093/bioinformatics/bti062
- ↵Schäfer J, Strimmer K. 2005b. A shrinkage approach to large-scale covariance matrix estimation and implications for functional genomics. Stat Appl Genet Mol Biol 4: Article32. 10.2202/1544-6115.1175
- ↵Schmitz N, Nickelsen M, Ziepert M, Haenel M, Borchmann P, Schmidt C, Viardot A, Bentz M, Peter N, Ehninger G, 2012. German high-grade lymphoma study group (DSHNHL). Conventional chemotherapy (CHOEP-14) with rituximab or high-dose chemotherapy (MegaCHOEP) with rituximab for young, high-risk patients with aggressive B-cell lymphoma: an open-label, randomised, phase 3 trial (DSHNHL 2002-1). Lancet Oncol 13: 1250–1259. 10.1016/S1470-2045(12)70481-3
- ↵Schmitz R, Wright GW, Huang DW, Johnson CA, Phelan JD, Wang JQ, Roulland S, Kasbekar M, Young RM, Shaffer AL, 2018. Genetics and pathogenesis of diffuse large B-cell lymphoma. N Engl J Med 378: 1396–1407. 10.1056/NEJMoa1801445
- ↵Schwanhäusser B, Busse D, Li N, Dittmar G, Schuchhardt J, Wolf J, Chen W, Selbach M. 2011. Global quantification of mammalian gene expression control. Nature 473: 337–342. 10.1038/nature10098
- ↵Schwarz G. 1978. Estimating the dimension of a model. Annals Statist 6: 461–464. 10.1214/aos/1176344136
- ↵Sedgewick AJ, Shi I, Donovan RM, Benos PV. 2016. Learning mixed graphical models with separate sparsity parameters and stability-based model selection. BMC Bioinformatics 17: 307–318. 10.1186/s12859-016-1039-0
- ↵Sha C, Barrans S, Cucco F, Bentley MA, Care MA, Cummin T, Kennedy H, Thompson JS, Uddin R, Worrillow L, 2019. Molecular high-grade B-cell lymphoma: defining a poor-risk group that requires different approaches to therapy. J Clin Oncol 37: 202–212. 10.1200/JCO.18.01314
- ↵Shaknovich R, Geng H, Johnson NA, Tsikitas L, Cerchietti L, Greally JM, Gascoyne RD, Elemento O, Melnick A. 2010. DNA methylation signatures define molecular subtypes of diffuse large B-cell lymphoma. Blood 116: e81–e89. 10.1182/blood-2010-05-285320
- ↵Shanmugam V, Craig JW, Hilton LK, Nguyen MH, Rushton CK, Fahimdanesh K, Lovitch S, Ferland B, Scott DW, Aster JC. 2021. Notch activation is pervasive in SMZL and uncommon in DLBCL: implications for notch signaling in B-cell tumors. Blood Adv 5: 71–83. 10.1182/bloodadvances.2020002995
- ↵Sharma B, Prabhakaran V, Desai A, Bajpai J, Verma R, Swain P. 2019. Post-translational modifications (PTMs), from a cancer perspective: an overview. Oncogen 2: 12. 10.35702/onc.10012
- ↵Sharp JA, Perea-Resa C, Wang W, Blower MD. 2020. Cell division requires RNA eviction from condensing chromosomes. J Cell Biol 219: e201910148. 10.1083/jcb.201910148
- ↵Shinohara M, Terada Y, Iwamatsu A, Shinohara A, Mochizuki N, Higuchi M, Gotoh Y, Ihara S, Nagata S, Itoh H, 2002. SWAP-70 is a guanine-nucleotide-exchange factor that mediates signalling of membrane ruffling. Nature 416: 759–763. 10.1038/416759a
- ↵Shutta KH, Weighill D, Burkholz R, Guebila MB, DeMeo DL, Zacharias HU, Quackenbush J, Altenbuchinger M. 2023. DRAGON: determining regulatory associations using graphical models on multi-omic networks. Nucleic Acids Res 51: e15. 10.1093/nar/gkac1157
- ↵Silva JC, Gorenstein MV, Li GZ, Vissers JP, Geromanos SJ. 2006. Absolute quantification of proteins by LCMSE: a virtue of parallel MS acquisition. Mol Cell Proteomics 5: 144–156. 10.1074/mcp.M500230-MCP200
- ↵Simon N, Tibshirani R. 2012. Standardization and the group lasso penalty. Stat Sin 22: 983–1001. 10.5705/ss.2011.075
- ↵Simpson LM, Fulcher LJ, Sathe G, Brewer A, Zhao JF, Squair DR, Crooks J, Wightman M, Wood NT, Gourlay R, 2023. An affinity-directed phosphatase, adPhosphatase, system for targeted protein dephosphorylation. Cell Chem Biol 30: 188–202.e6. 10.1016/j.chembiol.2023.01.003
- ↵Staiger AM, Altenbuchinger M, Ziepert M, Kohler C, Horn H, Huttner M, Hüttl KS, Glehr G, Klapper W, Szczepanowski M, 2020. A novel lymphoma-associated macrophage interaction signature (LAMIS) provides robust risk prognostication in diffuse large B-cell lymphoma clinical trial cohorts of the DSHNHL. Leukemia 34: 543–552. 10.1038/s41375-019-0573-y
- ↵Su Y, Nielsen D, Zhu L, Richards K, Suter S, Breen M, Motsinger-Reif A, Osborne J. 2013. Gene selection and cancer type classification of diffuse large-B-cell lymphoma using a bivariate mixture model for two-species data. Hum Genomics 7: 2. 10.1186/1479-7364-7-2
- ↵Swerdlow S, Campo E, Jaffe E, Harris N, Pileri S, Stein H, Thiele J, Arber D, Hasserjian R, Le Beau M, 2017. WHO classification of tumours of haematopoetic and lymphoid tissues. IARC Press, Lyon, France.
- ↵Szczepanowski M, Lange J, Kohler CW, Masque-Soler N, Zimmermann M, Aukema SM, Altenbuchinger M, Rehberg T, Mahn F, Siebert R, 2017. Cell-of-origin classification by gene expression and MYC-rearrangements in diffuse large B-cell lymphoma of children and adolescents. Br J Haematol 179: 116–119. 10.1111/bjh.14812
- ↵Talasz H, Sarg B, Lindner HH. 2009. Site-specifically phosphorylated forms of H1.5 and H1.2 localized at distinct regions of the nucleus are related to different processes during the cell cycle. Chromosoma 118: 693–709. 10.1007/s00412-009-0228-2
- ↵Tang WH, Shilov IV, Seymour SL. 2008. Nonlinear fitting method for determining local false discovery rates from decoy database searches. J Proteome Res 7: 3661–3667. 10.1021/pr070492f
- ↵Tedoldi S, Paterson J, Cordell J, Tan SY, Jones M, Manek S, Dei Tos A, Roberton H, Masir N, Natkunam Y, 2006. Jaw1/LRMP, a germinal centre-associated marker for the immunohistological study of B-cell lymphomas. J Pathol 209: 454–463. 10.1002/path.2002
- ↵UniProt Consortium. 2023. UniProt: the universal protein knowledgebase in 2023. Nucleic Acids Res 51: D523–D531. 10.1093/nar/gkac1052
- ↵Vahabi N, Michailidis G. 2022. Unsupervised multi-omics data integration methods: a comprehensive review. Front Genet 13: 854752. 10.3389/fgene.2022.854752
- ↵Wang D, Zhang Y, Che YQ. 2020. CCND2 mRNA expression is correlated with R-CHOP treatment efficacy and prognosis in patients with ABC-DLBCL. Front Oncol 10: 1180. 10.3389/fonc.2020.01180
- ↵Wright G, Tan B, Rosenwald A, Hurt EH, Wiestner A, Staudt LM. 2003. A gene expression-based method to diagnose clinically distinct subgroups of diffuse large B cell lymphoma. Proc Natl Acad Sci 100: 9991–9996. 10.1073/pnas.1732008100
- ↵Wright GW, Phelan JD, Coulibaly ZA, Roulland S, Young RM, Wang JQ, Schmitz R, Morin RD, Tang J, Jiang A, 2020. A probabilistic classification tool for genetic subtypes of diffuse large B cell lymphoma with therapeutic implications. Cancer Cell 37: 551–568.e14. 10.1016/j.ccell.2020.03.015
- ↵Wu XN, Chu L, Xi L, Pertl-Obermeyer H, Li Z, Sklodowski K, Sanchez-Rodriguez C, Obermeyer G, Schulze WX. 2019. Sucrose-induced receptor kinase 1 is modulated by an interacting kinase with short extracellular domain. Mol Cell Proteomics 18: 1556–1571. 10.1074/mcp.RA119.001336
- ↵Wurster KD, Hummel F, Richter J, Giefing M, Hartmann S, Hansmann ML, Kreher S, Köchert K, Krappmann D, Klapper W, 2017. Inactivation of the putative ubiquitin-E3 ligase PDLIM2 in classical Hodgkin and anaplastic large cell lymphoma. Leukemia 31: 602–613. 10.1038/leu.2016.238
- ↵Xu X. 2019. BTK inhibitors induce ABC-DLBCL cell apoptosis by inhibiting CYLD phosphorylation. Blood 134: 5046. 10.1182/blood-2019-126763
- ↵Xu-Monette ZY, Tu M, Jabbar KJ, Cao X, Tzankov A, Visco C, Cai Q, Montes-Moreno S, An Y, Dybkaer K, 2015. Clinical and biological significance of de novo CD5+ diffuse large B-cell lymphoma in western countries. Oncotarget 6: 5615–5633. 10.18632/oncotarget.3479
- ↵Xu-Monette ZY, Wei L, Fang X, Au Q, Nunns H, Nagy M, Tzankov A, Zhu F, Visco C, Bhagat G, 2022. Genetic subtyping and phenotypic characterization of the immune microenvironment and MYC/BCL2 double expression reveal heterogeneity in diffuse large B-cell lymphoma. Clin Cancer Res 28: 972–983. 10.1158/1078-0432.CCR-21-2949
- ↵Yan WH, Jiang XN, Wang WG, Sun YF, Wo YX, Luo ZZ, Xu QH, Zhou XY, Cao JN, Hong XN, 2020. Cell-of-origin subtyping of diffuse large B-cell lymphoma by using a qPCR-based gene expression assay on formalin-fixed paraffin-embedded tissues. Front Oncol 10: 803. 10.3389/fonc.2020.00803
- ↵Zhou JK, Fan X, Cheng J, Liu W, Peng Y. 2021. PDLIM1: structure, function and implication in cancer. Cell Stress 5: 119–127. 10.15698/cst2021.08.254
- ↵Zitnik M, Li MM, Wells A, Glass K, Morselli Gysi D, Krishnan A, Murali TM, Radivojac P, Roy S, Baudot A, et al. 2024. Current and future directions in network biology. Bioinform Adv 4: vbae099. 10.1093/bioadv/vbae099