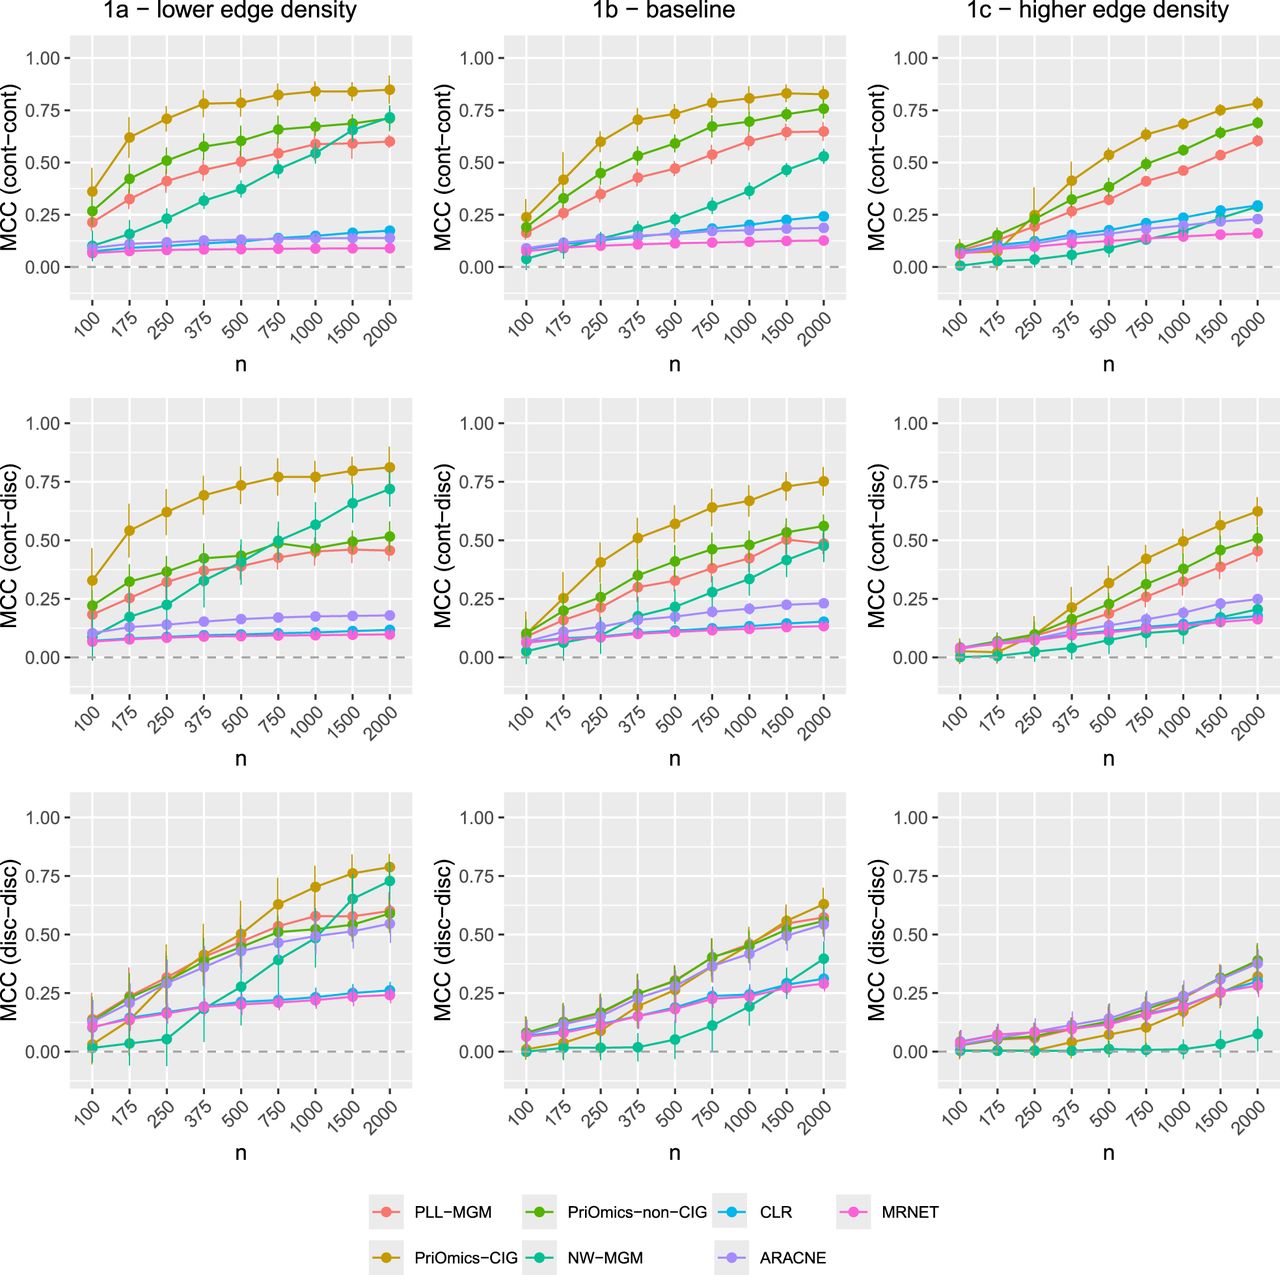
Figure 3.
Performance comparison of a pseudo-log-likelihood MGM implementation (PLL-MGM), the PriOmics implementations with different priors (“CIG” and “non-CIG”), a node-wise LASSO regression MGM implementation (“NW-MGM”), and three MI-based algorithms (“CLR,” “ARACNE,” and “MRNET”) on simulated data. The plots show the average MCC versus sample size n of 30 runs. The top row shows results for the continuous–continuous edges; the middle row, for the continuous–discrete edges; and the bottom row, for the discrete–discrete edges. The columns correspond to the three different simulation studies 1a to 1c with varying edge densities, as summarized in Supplemental Table S1. The error bars correspond to ±1 SDD.