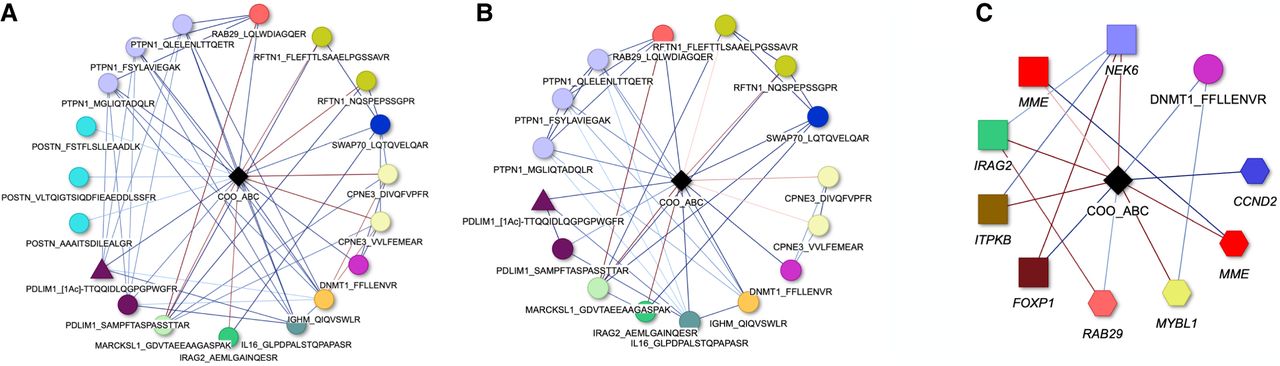
First-order neighborhood networks of “ABC”-labeled DLBCLs compared with “unclassified” DLBCLs. (A,B) Based on PriOmics models calculated on the proteomic data set (DS1) with PriOmics-CIG (A) or PriOmics-non-CIG (B). The model (C) includes additional transcriptomic data (DS2) with PriOmics-CIG for proteomic data and no prior for RNA data. Genes from the first data source (HTG) are depicted as squares, genes from the second data source (Nanostring) as hexagons, nonmodified peptides as circles, peptides with a CTM or PTM as triangles, and discrete variables as diamonds. Adjacent nodes of the same color represent the protein affiliation. Edge colors indicate positive (blue) or negative (red) associations. Edge color intensity indicates the association strength. The node labels refer to the gene or protein name together with the amino acid sequence of the associated peptide, separated by an underscore. CTMs and PTMs are displayed in square brackets ([1Ac] = acetylation). Edge weights are understood relative to the baseline COO = “unclassified.”