
Common cis-regulatory variation modifies the penetrance of pathogenic SHROOM3 variants in craniofacial microsomia
- Hao Zhu1,
- Jiao Zhang2,
- Soumya Rao3,
- Matthew D. Durbin4,
- Ying Li5,
- Ruirui Lang1,
- Jiqiang Liu1,
- Baichuan Xiao1,
- Hailin Shan1,
- Ziqiu Meng1,
- Jinmo Wang1,
- Xiaokai Tang1,
- Zhenni Shi1,
- Liza L. Cox3,
- Shouqin Zhao5,
- Stephanie M. Ware4,6,
- Tiong Y. Tan7,
- Michelle de Silva7,
- Lyndon Gallacher7,
- Ting Liu8,
- Jie Mi9,
- Changqing Zeng10,
- Hou-Feng Zheng11,12,
- Qingguo Zhang2,
- Stylianos E. Antonarakis13,14,15,
- Timothy C. Cox3,16 and
- Yong-Biao Zhang1,17,18
- 1School of Engineering Medicine, Beihang University, Beijing 100191, China;
- 2Plastic Surgery Hospital, Chinese Academy of Medical Sciences, Beijing 100144, China;
- 3Department of Oral & Craniofacial Sciences, University of Missouri-Kansas City, Kansas City, Missouri 64108, USA;
- 4Department of Pediatrics, Herman B. Wells Center for Pediatric Research, Indiana University School of Medicine, Indianapolis, Indiana 46202, USA;
- 5Department of Otolaryngology-Head and Neck Surgery, Beijing Tongren Hospital, Capital Medical University, Beijing 100051, China;
- 6Department of Medical and Molecular Genetics, Indiana University School of Medicine, Indianapolis, Indiana 46202, USA;
- 7Victorian Clinical Genetics Service, Royal Children's Hospital and Department of Pediatrics, University of Melbourne, Victoria 3052, Australia;
- 8Department of Ophthalmology, Daping Hospital, Army Medical University, Chongqing 400000, China;
- 9Center for Non-Communicable Disease Management, Beijing Children's Hospital, Capital Medical University, National Center for Children's Health, Beijing 100045, China;
- 10Beijing Institute of Genomics, Chinese Academy of Sciences, Beijing 100101, China;
- 11Center for Health and Data Science (CHDS), the Second Affiliated Hospital of Soochow University, Suzhou, Jiangsu 215004, China;
- 12Diseases & Population (DaP) Geninfo Laboratory, School of Life Sciences, Westlake University, Hangzhou, Zhejiang 310024, China;
- 13Department of Genetic Medicine and Development, University of Geneva Medical Faculty, Geneva 1211, Switzerland;
- 14Medigenome, Swiss Institute of Genomic Medicine, 1207 Geneva, Switzerland;
- 15iGE3 Institute of Genetics and Genomes in Geneva, Geneva 1211, Switzerland;
- 16Department of Pediatrics, University of Missouri-Kansas City, Kansas City, Missouri 64108, USA;
- 17Key Laboratory of Big Data-Based Precision Medicine and Key Laboratory of Innovation and Transformation of Advanced Medical Devices, Ministry of Industry and Information Technology, Key Laboratory of Biomechanics and Mechanobiology, Ministry of Education, Beijing 100191, China;
- 18National Medical Innovation Platform for Industry-Education Integration in Advanced Medical Devices (Interdiscipline of Medicine and Engineering), Beihang University, Beijing 100083, China
Abstract
Pathogenic coding variants have been identified in thousands of genes, yet the mechanisms underlying the incomplete penetrance in individuals carrying these variants are poorly understood. In this study, in a cohort of 2009 craniofacial microsomia (CFM) patients of Chinese ancestry and 2625 Han Chinese controls, we identified multiple predicted pathogenic coding variants in SHROOM3 in both CFM patients and healthy individuals. We found that the penetrance of CFM correlates with specific haplotype combinations containing likely pathogenic-coding SHROOM3 variants and CFM-associated expression quantitative trait loci (eQTLs) of SHROOM3 expression. Further investigations implicate specific eQTL combinations, such as rs1001322 or rs344131, in combination with other significant CFM-associated eQTLs, which we term combined eQTL phenotype modifiers (CePMods). We additionally show that rs344131, located within a regulatory enhancer region of SHROOM3, demonstrates allele-specific effects on enhancer activity and thus impacts expression levels of the associated SHROOM3 allele harboring any rare coding variant. Our findings also suggest that CePMods may serve as pathogenic determinants, even in the absence of rare deleterious coding variants in SHROOM3. This highlights the critical role of allelic expression in determining the penetrance and severity of craniofacial abnormalities, including microtia and facial asymmetry. Additionally, using quantitative phenotyping, we demonstrate that both microtia and facial asymmetry are present in two separate Shroom3 mouse models, the severity of which is dependent on gene dosage. Our study establishes SHROOM3 as a likely pathogenic gene for CFM and demonstrates eQTLs as determinants of modified penetrance in the manifestation of the disease in individuals carrying likely pathogenic rare coding variants.
Incomplete penetrance represents a complex phenomenon whereby the presence of a pathogenic variant in the genome results in a disease phenotype in some but not all individuals that carry the variant (Vogt 1926; Cooper et al. 2013). This variability is attributed to a multitude of factors, including but not limited to genetic modifiers, environmental conditions, and epigenetic modifications. Variants in regulatory elements that impact gene expression, otherwise known as expression quantitative trait loci (eQTLs), serve as one of the genetic modifiers that influence the penetrance of pathogenic variants (Castel et al. 2018). These common variants, which modify gene expression in specific haplotype combinations with rare pathogenic alleles, “interact” with the latter, thereby modulating their penetrance (Emison et al. 2005; Lim et al. 2024).
The etiology of many diseases often adheres to a genetic model, encompassing diverse combinations of regulatory and pathogenic variants (Emison et al. 2005; Rahit and Tarailo-Graovac 2020). In such diseases, the penetrance of pathogenic variants is influenced not only by the rare genetic alteration itself but also by the presence of a concurrent regulatory variant that dictates allele-specific expression (ASE) levels (Castel et al. 2018). However, to date, the combinatorial patterns of parental alleles, comprising both deleterious and regulatory variants, that give rise to birth defects remain inadequately investigated.
Craniofacial microsomia (CFM) is a condition that encompasses considerable phenotypic variability and low penetrance and is often recognized by notable facial asymmetry involving the external ear, mandible, and maxilla. A previous large genome-wide association study (GWAS) of CFM patients identified numerous risk loci, including SHROOM3, which carries the highest burden of deleterious coding variants among CFM-associated genes (Supplemental Fig. 1; Zhang et al. 2016; Xu et al. 2021). Shroom3 shows high expression in the pharyngeal arches, which develop into various craniofacial structures, including the external ear (Hildebrand and Soriano 1999). In mice, homozygous loss of function of Shroom3 has been amply described as having variably penetrant neural tube defects (exencephaly, spina bifida), facial clefts, and cardiac and kidney anomalies, among other anomalies (Hildebrand and Soriano 1999; McGreevy et al. 2015; Durbin et al. 2020; Lawlor et al. 2023). Although small ears were noted in the original report (Hildebrand and Soriano 1999), this phenotype was not emphasized, and heterozygotes appear grossly normal. Further studies are needed to elucidate how SHROOM3 impacts craniofacial phenotypes, including asymmetry and microtia, and to establish its role in modifying susceptibility to CFM.
In this study, we aim to elucidate the role of variants in SHROOM3 in modifying the penetrance and expressivity of CFM by focusing on combinatorial eQTLs that interact with deleterious coding variants. We also investigate the contribution of SHROOM3 to phenotypic variability in CFM by utilizing quantitative assessments in mouse models.
Results
Putative deleterious rare coding variants in SHROOM3
We conducted whole-genome sequencing on 2009 Chinese CFM patients and enrolled, as controls, 2625 healthy Chinese individuals from the SG10K data set (Wu et al. 2019). Previous association studies had identified several CFM-related risk genes (Zhang et al. 2016; Xu et al. 2021). Initially, we focused our efforts on interrogating the predicted deleterious variants within risk genes directly encompassed by GWAS signals in both cohorts (Supplemental Fig. 1). SHROOM3 was found to harbor the highest number of predicted deleterious coding variants in our cohorts and therefore became the focus of this study.
Within the CFM cohort, 15,481 variants were detected across the SHROOM3 locus (including 100 kb on either side of the gene; Chr 4: 76,335,229–76,883,253, hg38), with 43 rare coding variants identified as putatively deleterious. These variants were carried by 65 patients (Fig. 1; Table 1; Supplemental Table 1). Additionally, we included 206 CFM patients from the Gabriella Miller Kids First Pediatric Research (GMKF) program, 591 individuals (264 affected) available through the FaceBase program, and 12 CFM families who were mostly of Australasian/European descent and found an additional nine putative deleterious rare coding variants (Table 1; Supplemental Table 1). In 2625 healthy Chinese individuals, SHROOM3 contained 32 predicted deleterious coding variants, carried by 85 individuals (Supplemental Table 2). These predicted deleterious coding variants within CFM patients and healthy Chinese provided the opportunity to investigate the incomplete penetrance potentially modified by eQTLs.
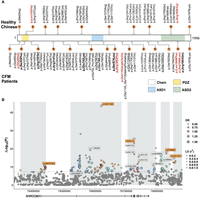
Distribution of putative deleterious variants and common SNP associations in SHROOM3 among CFM patients and healthy Chinese. (A) The schematic delineates the PDZ, ASD1, and ASD2 domains of the SHROOM3 protein, color-coded in yellow, blue, and green, respectively. The upper panel enumerates the deleterious variants identified in healthy Chinese individuals, and the lower panel details those found in CFM patients, with variants from European/Hispanic/Australasian ancestry underlined. The count of deleterious variants within specific regions is indicated by numbered brown circles. Variants emphasized in red denote those predicted as pathogenic by the ESM1b and AlphaMissense algorithm. Likely pathogenic variants determined using combination patterns are marked by bold in CFM patients. (B) Manhattan plot of CFM-associated variants in SHROOM3. This plot showcases variants with a minor allele frequency above 0.05. The size of each dot indicates the odds ratio of the corresponding variant. The plot demarcates five linkage disequilibrium (LD) blocks within SHROOM3 in gray, with the color-coding reflecting r² values, signifying the correlation between the lead SNP and other variants within each LD block. Lead SNPs are marked with purple rhombus, and their rsID is shown with an orange background. eQTL sites are identified with rsIDs with a white background. (OR) Odds ratio.
Likely pathogenic variants in SHROOM3 for CFM patients from Chinese, European, and Hispanic ancestries
A gene burden analysis indicated a significant enrichment of deleterious variants in CFM patients compared with the 2625 healthy Han Chinese (P = 0.008, SKAT burden test). Notably, compared with the 2009 patients, the subset of 65 patients showed a marked preference for the conchal type auricular presentation (51 out of 65, 78%) as per the Nagata classification, in contrast to 28% in the entire cohort (P = 2.88 × 10⁻⁸, Pearson's chi-squared test) (Supplemental Table 3). The OMENS classification further identified O1 (34%; abnormal orbital size) and S0 (48%; no obvious soft tissue or muscle deficiency) as the primary categories (Supplemental Table 3). This provides evidence that SHROOM3 is primarily associated with the development of the upper auricle.
Identifying potential regulatory variants through an association analysis
To investigate regulatory variants that have the potential to modify the effect of deleterious rare coding variants, we undertook an association analysis on variants in the SHROOM3 region with the 2009 Chinese CFM patients and 2625 healthy Han Chinese from the SG10K data set. Association tests revealed a large number of common variants significantly associated with CFM, surpassing a stringent P-value threshold of <5 × 10⁻⁸, using the first 10 eigenvalues as covariates for adjusting population stratification (Fig. 1B; Supplemental Fig. 2; Supplemental Table 4). These results replicated previous observations ascertained from chip-based GWASs (Zhang et al. 2016). A total of 84 of the associated variants are SHROOM3 eQTLs (denoted in GTEx database) (Supplemental Table 4; Supplemental Fig. 3; The GTEx Consortium 2020), and 30 of the associated variants are mapped in regions with promoter/enhancer histone marks (Supplemental Table 5). The most significant variant is rs10017322 with a P-value of 2.34 × 10−44 (after Bonferroni correction), which is an eQTL for SHROOM3.
Fine-mapping eQTL modifiers of predicted pathogenic SHROOM3 variants in CFM patients
An evaluation of linkage disequilibrium (LD) patterns divided the common variants into five distinct haplotype blocks (H1–H5) situated within the SHROOM3 locus (Supplemental Fig. 4). To fine-map candidate pathogenic eQTLs influencing the penetrance of CFM through altered ASE, we utilized conditional association analyses on the lead variant in each LD block (Supplemental Fig. 5A; Uffelmann et al. 2021) and fine-mapping algorithms, such as CAVIAR (Hormozdiari et al. 2017), FINEMAP (Benner et al. 2016), and PAINTOR (Kichaev et al. 2014). These methods aimed to pinpoint credible variants within each independently associated region, designating variants with high posterior probabilities as potential causal factors (Uffelmann et al. 2021). We included the top 10 variants of each algorithm and found that half of them were eQTLs (Supplemental Table 6). Combining the results from these fine-mapping methods, we identified two unlinked eQTLs, rs10017322 and rs344131 (r2 = 0.05), consistently flagged as putatively pathogenic eQTLs across all methods (Fig. 2A).
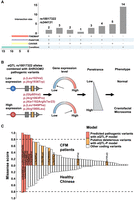
Patterns of haplotype combinations involving putatively pathogenic eQTLs and predicted pathogenic coding variants. (A) UpSet plot showing putatively pathogenic eQTLs fine-mapped using various methods, including conditional analysis, CAVIAR, FINEMAP, and PAINTOR. (B) Haplotype diagram illustrating the association between the putatively pathogenic eQTL rs10017322 and predicted pathogenic variants. The G and A alleles of rs10017322 correspond to high and low expression levels of SHROOM3, respectively, in the GTEx database (Supplemental Fig. 3). The A allele modifies the penetrance of the pathogenic L102V and R1936W alleles in healthy Chinese individuals, whereas other variants combined with the G allele are associated with the CFM phenotype in Chinese and European populations. (C) Missense score of identified coding variants in SHROOM3.
To elucidate the haplotype combinations of the two putatively modifying eQTLs and deleterious variants between the case (65 CFM Chinese patients) and control (85 healthy Han Chinese) samples with monoallelic, likely deleterious, SHROOM3 variants, we performed haplotype phasing. For inferring the haplotypes of variants identified in the SHROOM3 region, we employed SHAPEIT5, a phasing method optimized for accurate processing of rare variants in extensive sequencing data sets (Hofmeister et al. 2023). Acknowledging that not all coding predicted deleterious variants are necessarily pathogenic, we applied stringent criteria for defining pathogenic variants. The stringent criteria are as follows: (1) For loss-of-function (LoF) variants, they must be predicted as high-confidence (HC) by loss-of-function transcript effect estimator (LOFTEE), and (2) for nonsynonymous variants, they must be located within functional domains and either predicted as pathogenic by AlphaMissense or predicted as ambiguous by AlphaMissense with an ESM1b score below −10.
This stringent selection resulted in five predicted pathogenic variants in CFM Chinese patients and two in healthy Chinese (Fig. 1A; Table 1; Supplemental Tables 1, 2). Upon analyzing the haplotype combinations, we observed that in CFM Chinese patients, all five predicted pathogenic mutant alleles were in the same haplotype with the high-expression allele (G allele) of rs10017322, whereas in controls, the mutant alleles of the two predicted pathogenic variants were combined with the low-expression allele (A allele) of rs10017322 (Fig. 2B; Supplemental Fig. 3). To mitigate potential population selection bias owing to the absence of LoF variants in the control samples, we obtained data from various healthy population databases, including the 1000 Genomes Project (Sudmant et al. 2015), the Westlake BioBank for Chinese (WBBC) (Cong et al. 2022), and the Chinese Academy of Sciences Precision Medicine Initiative (CASPMI) (Du et al. 2019). We identified the p.(Thr753ProfsTer88) variant in the Finnish population from the 1000 Genomes Project, the p.(Gln1117GlufsTer73) variant from WBBC, and the p.(Ser1535ProfsTer4) and p.(Glu1872Ter) variants from CASPMI. All these LoF variants are on the same haplotype as the low-expression allele (A allele) of rs10017322. This combination implies a modified penetrance in controls, influenced by the reduced expression level of the pathogenic allele of rare variants (Fig. 2B).
We utilized the missense score (see Methods) to evaluate the functional effects of all identified variants in SHROOM3 and confirmed that all five predicted pathogenic variants exhibited significant effects (Fig. 2C). To capture the relationship between eQTLs and predicted pathogenic variants, we introduced the eQTL-P model. This model defines an eQTL-P as a combination in which the mutant allele of a predicted pathogenic variant is in cis with a high-expression allele of an eQTL (e.g., rs10017322), potentially increasing the penetrance of the pathogenic allele. Using this model, we identified six additional variants following the same pattern, in which the mutant allele is combined in cis with the high-expression allele of rs10017322 (Fig. 1, variants marked in bold; Table 1, marked as eQTL-P; Supplemental Table 1).
However, when conditioning on the carrier status of all 11 presumptively pathogenic variants (the five predicted pathogenic variants plus the six deleterious variants that follow the combination pattern), only minimal alterations were observed in the significant CFM-associated variants (Supplemental Fig. 5B). Furthermore, on deeper examination, conditioning on all rare variants within a 1 kb region of all cis-regulatory (cis-reg) elements and the 11 presumptively pathogenic variants, a considerable number of variants remained significantly associated with CFM (Supplemental Fig. 5C). These results indicate that other variants such as eQTLs identified from fine-mapping analysis, along with rare coding variants, may also play a pivotal role in the complex molecular mechanism of phenotypic penetrance.
eQTL combinations show significant enrichment in CFM patients than in healthy Chinese
We further hypothesize that a distinct combination of risk eQTL alleles could also lead to exceptionally low SHROOM3 expression, potentially causing CFM-related phenotypes (Fig. 3A). To test this hypothesis, we examined all two-point combinations of the two eQTLs with additional eQTLs in both CFM Chinese patients and healthy Han Chinese. Notably, rs10017322 and rs344131 both showed a significant combinatorial effect with other eQTLs in CFM Chinese cases compared with healthy Han Chinese (P-values of 0.0001983 and 0.01367, respectively, Pearson's chi-squared test) (Fig. 3B,C; Supplemental Data). We designated these eQTL combinations as combined eQTL phenotype modifiers (CePMods), emphasizing their role in modulating phenotype penetrance.
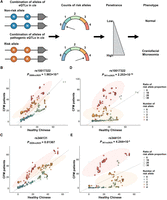
Patterns of haplotype combinations involving putatively pathogenic eQTLs. (A) Conceptual diagram hypothesizing that the combination of risk alleles from SHROOM3 eQTLs correlates with the CFM phenotype. The greater the number of risk alleles carried, the higher the likelihood of being a CFM patient. (B,C) Risk allele combinations involving the putatively pathogenic eQTL rs10017322/rs344131 and other SHROOM3 eQTLs in 2009 Chinese CFM patients and 2625 healthy Chinese individuals. Carriers of four risk alleles show a significant enrichment (P = 0.0001983) in CFM patients. (D,E) Risk allele combinations as in B,C but analyzed in 361 CFM patients who strongly contribute to the SHROOM3 signal compared with 2625 healthy Chinese. Individuals carrying four risk alleles demonstrate a more significant enrichment (P = 2.253 × 10⁻¹⁰) in CFM patients. Ratio of risk allele proportion indicates the proportion of the risk allele compared with CFM patients and healthy Chinese.
To further substantiate these findings, we developed a method to identify individuals significantly contributing to the SHROOM3 association signal (for details, see Methods). Among the 2009 Chinese CFM cases, 361 individuals were identified as major contributors to the SHROOM3 association signal (Supplemental Fig. 5D,E). All carriers of predicted pathogenic coding variants were found among these 361 individuals. Additionally, the risk allele combination of the two eQTLs was significantly enriched in these 361 samples (P = 2.253 × 10⁻¹⁰ for rs10017322 and P = 0.0004244 for rs344131, Pearson's chi-squared test), reinforcing our hypothesis that CePMods contribute to the manifestation of the CFM phenotype (Fig. 3D,E; Supplemental Data). These findings underscore the critical role of putatively pathogenic common eQTL variants and CePMods in the genetic etiology of CFM.
Investigating the effect of putatively pathogenic eQTLs on enhancer activity
Epigenomic profiling reveals potential enhancers within the SHROOM3 region (Fig. 4A; Rada-Iglesias et al. 2012). Promoter capture Hi-C analyses indicate that parts of these enhancers actively interact with the SHROOM3 promoter in human cranial neural crest cells (hCNCCs) (Xu et al. 2024). Notably, rs10017322 maps to an enhancer of SHROOM3 named GH04J076620, and rs344131 resides within a SHROOM3 enhancer named EH38E2305115, suggesting that they might directly influence enhancer activity (Fig. 4A). To investigate the impact of eQTLs located within enhancers on enhancer activity, we selected five eQTL loci associated with CFM: rs10017322, rs344131, rs74918804, rs189707263, and rs344126 (for details, see Methods). We employed luciferase assays to assess their impacts on enhancer activity in HEK293T cells. Our findings reveal that the alternative G allele of rs344131 demonstrates significantly reduced enhancer activity compared with the wild-type A allele in HEK293 cells, as well as G allele of rs189707263 and rs344126 (Fig. 4B). These results suggest that rs344131 acts as a potential pathogenic eQTL in CFM.
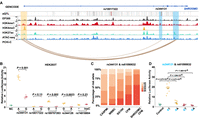
In vitro analysis of eQTL effects on enhancer activity. (A) Epigenetic landscape at SHROOM3 in human neural crest cells (hCNCCs). This panel presents an integrated epigenomic analysis, combining in vitro PCHi-C, ATAC-seq, and ChIP-seq data from hCNCCs (Rada-Iglesias et al. 2012; Xu et al. 2024). It displays the epigenetic markers H3K4me1, H3K4me3, and H3K27ac in hCNCCs. The promoter is highlighted with light orange shading. Enhancers are highlighted with blue shading, with eQTLs within these enhancers marked by black lines (darkness represents the significance level). In the PCHi-C section, differential chromatin interactions connect enhancers to the SHROOM3 promoter, with line colors indicating the strength of interaction. (B) Luciferase assays to assess the effects of eQTLs on SHROOM3 enhancers, including an empty vector as a control. Data from three independent experiments, each comprising three technical replicates, are depicted. (C) Enrichment analysis of risk allele combinations for eQTLs rs344131 and rs61090632 in CFM patients compared with control populations. Significant enrichment is observed in both the entire CFM cohort (P < 0.008884) and the SHROOM3 CFM subset (P < 1.71 × 10⁻²⁴) using chi-square tests. Control populations: (CASPMI) Chinese Academy of Sciences Precision Medicine Initiative, (WBBC) Westlake BioBank for Chinese, and (SG10K) Singapore 10K Genome Project. Patient cohorts: CFM (n = 2009) and SHROOM3 CFM (n = 361). (D) Luciferase assay results demonstrating the combined effect of alleles rs344131 and rs61090632 in HEK-293T cells. P-values are calculated using the Student's t-test.
The significant enrichment of specific eQTL combinations in CFM patients suggests a role for common regulatory variants in CFM etiology. To validate this hypothesis, we focused on an enriched eQTL pair, rs344131 and rs61090632 (Fig. 4C). We cloned enhancer sequences of EH38E2305115 and EH38E2304970, containing different alleles of rs344131 (A/G, G being the risk allele) and rs61090632 (T/A, A being the risk allele), into firefly luciferase reporter plasmids. Luciferase assays revealed that combinations containing risk alleles significantly reduced enhancer activity compared with the wild-type (AT) combination (Fig. 4D). These findings suggest that combinations of deleterious regulatory alleles may impair enhancer function, potentially contributing to CFM pathogenesis.
Craniofacial phenotypes in Shroom3 mouse models
To better appreciate the role of SHROOM3 in craniofacial development and the potential impact of reduced SHROOM3 expression levels as a contributor to CFM, we analyzed facial morphology initially in the Shroom3 gene trap (Shroom3gt) mutant line. We qualitatively and quantitatively assessed Shroom3 heterozygous null (Shroom3+/gt), homozygous null (Shroom3gt/gt), and background-matched wild-type littermate control (Shroom3+/+) embryos following three-dimensional (3D) optical projection tomography (OPT) imaging. As previously reported, all Shroom3gt/gt homozygotes presented with exencephaly and variable penetrant additional features, including spina bifida (40%) and orofacial/oronasal clefts (30%) (Martin et al. 2019). Many homozygotes appeared to exhibit midface and mandibular hypoplasia, evident by a slightly protruding tongue, and small and sometimes protruding external ears (Fig. 5A). Heterozygotes appeared grossly normal.
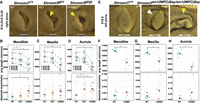
In vivo analysis of Shroom3 zygosity in mice is associated with microtia and facial asymmetry. (A) Lateral view of 3D rendered developing auricles (right side) from E14.25 wild-type (Shroom3+/+), heterozygote (Shroom3gt/+), and homozygote (Shroom3gt/gt) littermates following optical projection tomography. Note the marked microtia in the homozygote and the subtle dorsal auricular deficiency in the heterozygote (both marked by yellow arrows in the respective images) compared with the wild-type littermate. (B–D) Landmark-based quantitative assessment of auricular, mandibular and maxillary length (top) and absolute asymmetry (bottom) in wild-type, Shroom3gt/+, and Shroom3gt/gt embryos between E14.25 and E15.25. In the graphs of the average lengths of the mandible, maxilla, and auricle, dotted lines “connect” the means of the different genotypes from the same litter (stage). Mean ± SD indicated for the average length measurements; the mean (large shape with horizontal line dissecting it) is shown for the absolute asymmetry measurements. Asterisks denote statistical significance (P < 0.05). (E) Lateral view of 3D rendered auricles (left side) from an E18.5 wild type (Shroom3+/+) and two age-matched homozygote (Shroom3em1(IMPC)Bay/em1(IMPC)Bay) embryos derived from microCT scans generated by the International Mouse Phenotyping Center (IMPC; https://www.mousephenotype.org). The first homozygote (central) shows the more typical presentation of a small pinna that is inwardly curved and posteriorly rotated (white arrow). The second homozygote had significantly asymmetric pinna phenotypes - the auricular presentation of the left ear (yellow arrow) was severe, whereas the right pinna was similar in presentation to the first homozygote. (F–H) Landmark-based quantitative assessment of mandibular, maxillary, and auricular length (top) and absolute asymmetry (bottom) in E18.5 wild-type (Shroom3+/+) and Shroom3em1(IMPC)Bay/em1(IMPC)Bay null embryos. The mean (large shape with horizontal line dissecting it) is shown for each. Asterisks denote statistical significance (P < 0.05).
Landmark-based quantitative analysis of facial features was then performed, including maxillary and mandibular lengths, auricular size, and various measures of facial asymmetry. Head width measurements, as a proxy for overall size, showed that the head size of homozygotes was notably smaller than that of controls (P = 0.0258) (Supplemental Fig. 6). Overall, heterozygotes tended to be slightly smaller than littermate controls, although this did not reach statistical significance. Maxillary and mandibular length measurements revealed homozygotes to have markedly shorter mandibles and maxillary tissue (mandibles: P = 0.0124; maxillary tissue: P = 0.0018) (Fig. 5B–D), confirming the gross observations. These measurements remained significant even after normalization to head width. The mandibles and maxillary tissue of younger heterozygous embryos tended to be shorter than that of controls, but only the mandibles reached significance (P = 0.0272) (Fig. 5B–D, top). These findings suggest a subtle overall delay in craniofacial growth in heterozygotes but a larger and consistent impact on maxillary and mandibular growth in homozygotes.
In line with initial gross observations, measurements of auricular size confirmed that all homozygous embryos had marked microtia that often showed significant asymmetry in presentation (length: P = 0.0004; absolute asymmetry: P = 0.0169) (Fig. 5B–D). The differences remained significant even after normalization of head size. A side-by-side comparison of auricular morphology with controls (Fig. 5A) confirmed that homozygotes have cupped and protruding auricles, with reduction of the size of the helix. This presentation somewhat resembles the concha-type microtia, the type predominant in the cohort harboring deleterious variants in SHROOM3. The microtia was sometimes more striking on one side. The average auricular length in heterozygotes tended to be slightly smaller in the younger stage embryos, although the differences were not statistically significant. Again, in a side-by-side comparison with wild-type littermates, the upper aspect of the auricular helix in heterozygotes appeared subtly hypoplastic in some embryos (Fig. 5A, cf. left and middle images), a feature not captured by the length measurements. Even so, heterozygotes showed as much asymmetry in auricular size as homozygotes (absolute asymmetry: P = 0.0146) (Fig. 5B–D), suggesting that auricular size is most sensitive to Shroom3 gene dosage. To determine if this asymmetry extended across the entire face, the left and right side mandibular and maxillary lengths were also measured, and the ratio of the measurements was used to calculate the absolute asymmetry, the degree of asymmetry regardless of the direction of asymmetry, present in each structure. As with ear size, both heterozygotes and homozygotes exhibited considerably more variation in asymmetry of the mandible and the maxilla compared with the littermate controls. However, as a group, the differences only reached significance for the mandibular measurements for homozygotes (P = 0.0078) (Fig. 5B–D). Nevertheless, the trend in asymmetry corresponded with Shroom3 zygosity.
To validate these findings, we also downloaded and assessed the available microcomputed tomography (microCT) data for a Shroom3 knockout (KO) mutant (Shroom3em1(IMPC)Bay/em1(IMPC)Bay) generated by the International Mouse Phenotyping Consortium (IMPC). In total, scan data for six homozygous E18.5 embryos (four male and two female) were available. Data for four male and two female age-matched control embryos were also downloaded. Initial gross examination of the 3D renderings revealed that all mutants presented with exencephaly, and five of the six had striking midline facial clefts, more severe than that seen in the Shroom3gt/gt mutant. Notably, despite the severity of the midline clefts, some homozygotes still had at least one normally formed nostril, and in one embryo, both were normally formed. Each of these embryos, as well as the one homozygote without a midfacial cleft (Supplemental Fig. 7), exhibited apparent facial hypoplasia involving both the snout and mandible. The pinnae, however, were all slightly dysmorphic, posteriorly rotated, and small, with one homozygote showing severe concha-type microtia on one side (Fig 5E, yellow arrow). Most homozygotes also presented with variable, and often asymmetric, overt ocular phenotypes, including exophthalmia. Similar to the Shroom3gt/gt embryos, all E18.5 Shroom3em1(IMPC)Bay/em1(IMPC)Bay homozygotes were slightly smaller than controls.
We then performed a quantitative assessment using the same landmarks employed on the younger Shroom3gt/gt embryos. To adjust for the size difference between mutants and controls at this age, we normalized all facial measurements to hindlimb foot length. Following normalization, Shroom3em1(IMPC)Bay/em1(IMPC)Bay embryos were confirmed to have hypoplastic maxillae and mandibles (each ∼12% shorter than wild-type controls), with the pinnae ∼18% shorter in length (see Fig 5F–H, top). The pinna helix was also slightly dysmorphic in all mutants, showing a “curled inward” appearance (Fig 5E, white arrow) unlike controls, which had a flattened appearance. Measures of asymmetry (absolute asymmetry) for the auricle, mandible, and maxillae of controls and homozygotes showed similar trends to the findings in the Shroom3gt/gt mutant, with mutants showing notably increased asymmetry for all three measures (Fig 5F–H, bottom).
Our data therefore show that reduced levels of Shroom3 (via allele loss) affects the development of maxillary, mandibular, and auricular structures with 100% penetrance in homozygotes and is associated with increased asymmetry of facial structures in both heterozygotes and homozygotes. The findings in the mouse models support the notion that changes in the total level of expression of Shroom3 influence CFM susceptibility and therefore likely also penetrance when combined with the impact of a pathogenic coding variant.
Discussion
To date, millions of disease-associated pathogenic/likely pathogenic (P/LP) variants have been identified or predicted, such as the more than 0.31 million P/LP variants deposited in the ClinVar database (Landrum et al. 2020). However, the penetrance of P/LP variants is highly variable, particularly for autosomal dominant phenotypes (Schmidt et al. 2024). Population-based studies of 157 diseases have shown that P/LP variants were associated with a mean penetrance of only 6.9% (Forrest et al. 2022), posing challenges for genetic counseling and diagnosis (Szeri et al. 2022; Tingaud-Sequeira et al. 2022). Multiple factors affect the penetrance of P/LP variants, including genetic variants such as eQTLs regulating the expression of the trans-alleles, cis regulatory variation (cis eQTLs), genetic modifiers unlinked with the causative gene, polygenic risk, imprinting, epigenetic regulation, and environmental factors (Gaudet et al. 2010; Castel et al. 2018; Hsu et al. 2021; Kingdom and Wright 2022; Mao et al. 2023). The mechanisms underlying modified penetrance have been partially elucidated and include the following: (1) variation in allelic expression resulting from allelic imbalance, duplication compensation, random monoallelic expression, or tissue-specific or biased mRNA isoform usage (Borel et al. 2015; Lek et al. 2016; Dick et al. 2016; Cummings et al. 2020; Servetti et al. 2021; Einson et al. 2023; Lobanova and Zhenilo 2024) and (2) altered gene expression mediated by genetic or epigenetic modifiers, such as cis-acting regulatory elements, trans-acting transcription factors, or epigenetic modifications (Castel et al. 2018; Delaneau et al. 2019; Lee et al. 2020; Tolmacheva et al. 2020). Despite the progress in understanding the factors that influence the penetrance of P/LP variants, the specific reasons why these variants cause disease in some individuals but not others remain largely elusive. This issue highlights the need to (1) develop more refined P/LP variant classification systems that include allelic gene expression driving penetrance (Forrest et al. 2022; Shekari et al. 2023; Schmidt et al. 2024), and (2) elucidate the mechanisms underlying the incomplete penetrance of P/LP variants (Castel et al. 2018).
In CFM patients and healthy Chinese individuals, we identified 13 predicted pathogenic variants whose penetrance was modified by eQTLs. Castel et al. (2018) proposed a “modified penetrance” model to explain how cis-regulatory variants (eQTLs) modified the penetrance of coding variants through regulating the allelic expression level. Compatible with this model, we found that the haplotype configuration of predicted pathogenic variants and eQTLs of SHROOM3 was different between CFM patients and healthy Chinese. We also found an aggregation of risk alleles of SHROOM3 eQTLs in phenotype-positive individuals, suggesting that the penetrance of the eQTLs may be further modified by additional eQTLs in CFM patients. We termed these combinatorial effects of eQTLs as combined eQTL phenotype modifiers (CePMods), which reflects their capacity to alter phenotype penetrance through complex haplotype interactions. Such findings may have significant impact in genetic counseling. Besides SHROOM3, pathogenic variants in other recently identified CFM risk genes, including FOXI3, SF3B2, and ROBO1/2, also show incomplete or variable penetrance (Supplemental Table 7), and thus, further work is needed to determine if P/LP variants in these loci are similarly modified by single eQTLs or CePMods (Timberlake et al. 2021; Quiat et al. 2022; Mao et al. 2023).
Variants in enhancers, similar to the enhancer that contains rs344131, are promising candidates as genetic modifiers. One such example is a common noncoding variant within a conserved enhancer-like sequence of the RET gene that modifies Hirschsprung disease risk (Emison et al. 2005). Variants have also been described that optimize the binding affinity of transcription factors to enhancers, resulting in greater penetrance and more severe polydactyly phenotypes (Lim et al. 2024). However, Barton et al. (2022) found incomplete penetrance of cystic fibrosis carrier phenotypes that cannot be explained by the “modified penetrance” model and thus requires more research to identify the functional determinants of these mechanisms. Our study also found that the “modified penetrance” model does not fully explain the SHROOM3 association signal (Fig. 2A; Supplemental Fig. 5B) and proposed a haplotype eQTL combination model that needs further investigation in human diseases and model organisms.
SHROOM3, in addition to having previously been associated in GWAS with CFM, has also been implicated as a genetic risk factor in neural tube defects, cleft lip and palate, and chronic kidney disease (Lemay et al. 2015; Zhang et al. 2016; Chen et al. 2018; Prokop et al. 2018; Deshwar et al. 2020; Perez et al. 2023). It is tempting to speculate that different SHROOM3 eQTLs influence, at least in part, the genetic risk of these different conditions, that is, based on the embryonic tissue(s) in which the enhancers that harbor the eQTLs are active. In support of this notion that expression levels contribute to risk, we have investigated two separate Shroom3 mutant mouse models and report here significant facial and auricular presentations in addition to the previously described anomalies in homozygotes. Our quantitative analyses show that Shroom3 zygosity in mice is correlated with the severity in craniofacial dysmorphology that includes reduced auricular size and decreased mandibular and maxillary length. Notably, increased facial and auricular asymmetry was found in heterozygous and homozygous of both Shroom3 models. Although only homozygotes showed overt microtia, presenting as concha-type microtia (i.e., small cupped ears with reduced helices), these observations are consistent with the notion that the level of Shroom3 activity/expression is a critical factor in the presentation of microtia and, more broadly, the facial asymmetry characteristic of CFM. In toto, our study identifies SHROOM3 as a likely pathogenic gene for CFM and highlights the model of modified penetrance in individuals carrying likely pathogenic rare coding variants. However, large family-based studies are required to validate the proposed inheritance pattern, and mouse models incorporating both eQTL and P/LP variants are needed to further substantiate our hypothesis.
In summary, we demonstrate that the combination of likely pathogenic variants with eQTLs can modify the penetrance of pathogenic variants. Notably, CePMods may exert damaging effects even in the absence of rare pathogenic variants when likely pathogenic eQTLs are combined. This underscores their role as key contributors to phenotypic variability and a potential mechanism for the persistence of deleterious effects.
Methods
Study cohorts
Patients with CFM were recruited from various sources. All procedures adhered to the Helsinki Declaration principles and followed approved protocols. Informed consent for biological investigations was obtained from all participants or their legal guardians.
The cohort of 2009 Chinese CFM patients was assembled from several institutions, including Peking Union Medical College Hospital, Chinese Academy of Medical Sciences Plastic Surgery Hospital, and Beijing Tongren Hospital at Capital Medical University. CFM patients were classified employing both the Nagata and OMENS systems by seasoned clinicians. Selection of participants did not involve gender or age screening; however, individuals with non-CFM-related anomalies were excluded. The project received ethical endorsements from multiple committees, including the ethics committees of Beihang University (BM20210057), Beijing Tongren Hospital, Capital Medical University (KY058), and the Plastic Surgery Hospital of the Peking Union Medical College (201707). The control group, comprising 2625 healthy Han Chinese individuals, was sourced from the SG10K pilot data set of Singapore (application no. SG10KP00003).
Analysis of whole-genome sequencing from the NIH GMKF CFM and microtia patient cohorts (phs002130.v1.p1.c1 and phs002172.v1.p1.c1, respectively), was conducted by coauthors S.R. and T.C.C. under approved access (project ID 31609). The CFM cohort contains mostly trios of varied ethnicity, with 69 affected individuals. The microtia cohort consists of 180 affected individuals from a combination of trios, duos, and singletons, all of Hispanic ancestry. The patients and unaffected relatives were collected from Equador, Colombia, and the United States, as previously described (Quiat et al. 2022).
High-throughput sequencing and variant calling
For the 2009 Chinese CFM patients, paired-end (2 × 150 bp) whole-genome sequencing was carried out on them by using the platform of T7 sequencer of BGI. Across all sequenced samples, the average depth was around 10×. The sequencing reads underwent analysis utilizing tools including Burrows–Wheeler aligner (v0.7.17; Li and Durbin 2009), SAMtools (v1.12; Danecek et al. 2021), Picard (v2.27.0; https://broadinstitute.github.io/picard/), the Genome Analysis Toolkit (v4.1.4.1; Auwera et al. 2013), and CNVkit (0.9.11; Talevich et al. 2016). Sequenced reads were aligned to the hg38 reference human genome. For the Australasian cohort, whole-genome sequencing and initial variant calling were performed by the Children's Mercy Genomic Medicine Center as part of the Genomic Answers for Kids (GA4K) program, with subsequent analyses and filtering performed by the Cox laboratory. For the GMKF CFM and microtia cohorts, VCF files of whole-genome sequencing were directly obtained and all SHROOM3 locus variants extracted for analysis by the Cox laboratory under prior project approval.
Association study
The case group comprised 2009 Chinese individuals, whereas the control group consisted of 2625 healthy Han Chinese from the pilot data of SG10K project, with Han Chinese ancestry confirmed through PCA analysis. Quality-control parameters were set as follows: sample call rate >98%, SNP call rate >95%, a Hardy–Weinberg equilibrium threshold of 0.001 (determined using Fisher's exact test) in the control cohort, and a minor allele frequency (MAF) > 0.001 in either the case or control cohort; 4187 variants were finally utilized for subsequent analysis of association study using PLINK (Purcell et al. 2007). Single-variant association tests were conducted. The threshold for genome-wide significance was established at a P-value < 6 × 10⁻⁸. Variants with MAF > 0.1 were retained for LD analysis.
SKAT burden test
We performed a SNP-set kernel association test using the SKAT package v2.2.5 (Wu et al. 2011) to analyze deleterious variants in the SHROOM3 gene in 2009 Chinese CFM patients and 2625 healthy Han Chinese samples from the SG10K data set.
Fine mapping
For fine-mapping causal variants, we employed FINEMAP v1.4.2, CAVIAR v2.2, PAINTOR v3.0, and PLINK's conditional analysis function, utilizing default parameters for the first three methods. The conditional analysis in PLINK followed a modified approach from our previous work (Zhang et al. 2016). Specifically, after establishing a final list of associated variants, we iteratively used the lead SNP in each block as a covariate for conditional analysis on the remaining variants within that block. This iterative process continued until no additional independent associated variants were detected in each block. Notably, we did not consider the presence of independent associated variants in other blocks during each block's conditional analysis. This approach accounts for the low LD among variants across different blocks and their potential interactions, which could influence the outcomes of the association tests.
LD block analysis
To delineate LD blocks, we incorporated variants with a MAF greater than 0.1 that showed significant association. We computed the pairwise r2 values among these variants and visualized the LD blocks using an R package (R Core Team 2024).
Annotating common variants
We annotated all significantly associated variants using HaploReg V4.2 (Ward and Kellis 2012), employing default parameters with the exception of LD calculation, which was adjusted according to the respective populations. Additionally, we utilized HaploReg to annotate deleterious-associated variants to identify those potentially affecting SHROOM3 expression. Variants situated in enhancer or promoter regions, as indicated by histone or DNase marks in stem cells, and those annotated as eQTLs were classified as expression-affecting variants.
For SHROOM3, we compiled all eQTLs across various cell types and tissues as cataloged in the GTEx database. In instances in which an eQTL exhibited both positive and negative normalized effect sizes (NESs) across different cell types and tissues, we selected the extreme value from the predominant trend to represent its NES. In all other cases, we simply chose the largest NES value.
Identification of likely pathogenic rare variants
A total of 4187 variants underwent annotation using ANNOVAR (Wang et al. 2010) in the 2009 Chinese CFM. We subjected these variants, along with those found in the 2625 healthy Chinese samples, to the following filtering process: (1) to retain LoF variants, we exclusively focused on missense, stop-gain, stop-loss, splicing, and frameshift variants; (2) to predict deleterious variants, employing three predictive criteria—PolyPhen-2, SIFT, CADD scores (>15)—we retained variants predicted to be deleterious; and (3) to filer variants based on MAF in the public databases, for high-frequency variants with a MAF > 0.005 in any subpopulations in ExAC, gnomAD, or the 1000 Genomes Project, we retained those with a minimum of two deleterious predictions, alongside adherence to stringent conservation benchmarks (GERP score > 2, phyloP100way_vertebrate > 1.6, and phastCons100way_vertebrate score > 0.5). Regarding rare variants with MAF < 0.005 in all subpopulations of ExAC, gnomAD, SG10K, and the 1000 Genomes Project, retention was dependent on being predicted as deleterious by at least one prediction algorithm. Those rare variants that passed all the above three criteria were considered as deleterious variants.
To ascertain potentially pathogenic variants, we utilized two advanced artificial intelligence methods: ESM1b (Brandes et al. 2023) and AlphaMissense (Cheng et al. 2023). ESM1b, a sophisticated protein language model, assesses the potential harm of variants by evaluating the implications of missense variants on a genome-wide scale. AlphaMissense further refines this prediction by integrating structural analysis and evolutionary conservation to determine functional impact and disease association. For this investigation, variants located within recognized functional domains of SHROOM3, identified as pathogenic by AlphaMissense, or deemed ambiguous by AlphaMissense and with an ESM1b score below −10 were classified as likely pathogenic variants.
We utilized LOFTEE to identify HC LoF variants. We consider LoFs to result in a truncated nonfunctional protein unless they trigger nonsense-mediated mRNA decay (NMD). To determine whether LoFs escape NMD, we employed NMDetective with a cutoff of 0.52 and applied the rules proposed by Lindeboom et al. (2019) and Karczewski et al. (2020).
The Missense score was calculated using a modified approach based on the methodology outlined by Jurgens et al. (2022). Missense variants were annotated using the variant effect predictor (VEP; v112.0). These tools were classified into two categories. First, the qualitative prediction algorithm category included AlphaMissense (Cheng et al. 2023), ESM1b (Brandes et al. 2023), SIFT (Vaser et al. 2016), PolyPhen-2 HDIV (Adzhubei et al. 2010), PolyPhen-2 HVAR (Adzhubei et al. 2010), LRT (Chun and Fay 2009), MutationTaster (Schwarz et al. 2014), FATHMM (Rogers et al. 2018), PROVEAN (Choi and Chan 2015), MetaSVM (Kim et al. 2017), MetaLR (Chen et al. 2023), MCAP (Jagadeesh et al. 2016), fathmm-MKL (Shihab et al. 2015), MutationAssessor (Reva et al. 2011), and ALoFT (Balasubramanian et al. 2017). Second, the quantitative prediction algorithm group consisted of tools such as CADD (Rentzsch et al. 2019), VEST3 (Carter et al. 2013), DANN (Quang et al. 2015), GERP (Huber et al. 2020), phyloP100way (Pollard et al. 2010), phyloP20way (Pollard et al. 2010), phastCons100way (Siepel et al. 2005), phastCons20way (Siepel et al. 2005), and SiPhy (Garber et al. 2009). For qualitative algorithms, variants classified as deleterious (“D”) by a given tool were assigned one point. For quantitative algorithms, variants with scores exceeding the 90th percentile of all predicted variants in the data set were also awarded one point per algorithm. The proportion of the deleterious score was then calculated as the ratio of the total accumulated scores to the maximum possible scores across all algorithms, further adjusted by incorporating functional domain information and ensuring that variants located in critical functional domains were given appropriate weight during the scoring process. Additionally, HC LoF variants annotated by LOFTEE were directly assigned a deleterious score of one, bypassing the scoring criteria used for missense variants.
Haplotype prediction and combination analysis
We first used SHAPEIT5 (v5.1.0; Hofmeister et al. 2023) to construct the haplotype of 4187 variants identified in SHROOM3. Common variants with a MAF greater than 0.005 were phased using the phase_common tool, whereas for rare variants (those
with MAF less than 0.005), we utilized the phase_rare tool to phase these variants onto a scaffold of common variants (Hofmeister et al. 2023). Subsequently, we extracted predicted pathogenic coding variants and eQTL sites from the phased haplotype data and combined
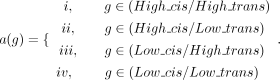
them to analyze the expression levels of each eQTL allele on the SHROOM3 gene in conjunction with the alternative alleles of predicted pathogenic variants, where a(g) represents the genotype combination of four types of pathogenic variants with different eQTL loci:
High-contribution CFM samples to SHROOM3 signal
To elucidate the contributors to the SHROOM3 association signal, we implemented a three-step methodology. First, we generated a reference list of CFM-associated variants
that included those variants with an initial P-value less than 5 × 10⁻⁸ (chi-square test in PLINK) in the association test. Subsequently, we analyzed the directional contribution of each case to
the variant significance in the reference list. This step involved assessing the change in significance level for all variants
in the reference list when each patient was individually excluded. We tracked the change in the significance level of all
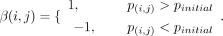
variants for each patient removal. To quantify each patient's contribution, we employed an indicator function β(i,j), where β equals one for a positive contribution and −1 for no contribution. In this function, “i” represents CFM patient samples, “j” denotes the variants in the reference list, and p(i, j) indicates the P-value of variant “j” after excluding patient “i”, with β(i,j) defined as
 The final step involved identifying contributors to the SHROOM3 signal. We calculated the β(i) for each patient and selected the top 5% of samples as potential contributors. The contribution score for each sample at
the SHROOM3 loci, denoted as ε, was calculated as the sum of β(i) across all patients (N), where N is the total number of CFM patients:
The final step involved identifying contributors to the SHROOM3 signal. We calculated the β(i) for each patient and selected the top 5% of samples as potential contributors. The contribution score for each sample at
the SHROOM3 loci, denoted as ε, was calculated as the sum of β(i) across all patients (N), where N is the total number of CFM patients:
 We repeated these three steps for three cycles until the SHROOM3 association signal was no longer detectable. Samples consistently identified in this process were classified as major contributors
to the association signal.
We repeated these three steps for three cycles until the SHROOM3 association signal was no longer detectable. Samples consistently identified in this process were classified as major contributors
to the association signal.
Luciferase assay
We identified 84 associated variants as SHROOM3 eQTLs, as annotated in the GTEx database. Additionally, 30 eQTLs were mapped to regions marked by promoter or enhancer histone modifications. Based on promoter capture Hi-C analyses, 10 of these variants are associated with SHROOM3 promoter activity in hCNCCs. Among these 10 eQTLs, five exhibit strong LD with rs10017322 or rs344131 and were excluded from further luciferase experiments. Finally, we selected rs10017322, rs344131, rs74918804, rs189707263, and rs344126 for luciferase reporter assays.
The HEK-293T cell line (1101HUM-PUMC000091) was obtained from the Cell Resource Center, Peking Union Medical College, and maintained in DMEM (Gibco) supplemented with 10% FBS (Gibco) in a humidified incubator at 37°C with 5% CO2. The sequence of the SHROOM3 enhancer was cloned into a luciferase vector (Genechem GV238), and alternative alleles of rs10017322, rs344131, and rs61090632 were generated using the Q5 site-directed mutagenesis kit (New England BioLabs E0554). For luciferase assays, HEK-293T cells were transfected with SHROOM3 enhancer luciferase vectors and pRL-TK vectors using the Lipofectamine 3000 transfection reagent (Thermo Fisher L3000008). After 24 h, cells were harvested and lysed, and fluorescence intensity was measured using the dual-luciferase assay kit (TransGen FR201) following the manufacturer's instructions on CLARIOstar microplate reader (BMG Labtech).
Epigenome data
The hCNCC PCHi-C data utilized in this study are from Xu et al. (2024). hCNCC ChIP-seq data sets are available at the NCBI Gene Expression Omnibus (GEO; https://www.ncbi.nlm.nih.gov/geo/) under the following accession numbers: EP300 (GSM714804), H3K27ac (GSM714807), H3K4me1 (GSM714808), and H3K4me3 (GSM714809) (Rada-Iglesias et al. 2012). All Epigenome data were visualized using the WashU Epigenome Browser (https://epigenomegateway.wustl.edu/browser/).
Mouse model
Two Shroom3 mouse models were assessed. Shroom3 gene trap (Shroom3+/gt and Shroom3gt/gt) mice were obtained from the Jackson Laboratories, and Shroom3 KO (Shroom3em1(IMPC)Bay/em1(IMPC)Bay) data sets were available through the IMPC website (https://www.mousephenotype.org). The Shroom3gt/gt mice were initially identified and described by Hildebrand and Soriano (1999) with homozygotes fully penetrant for exencephaly, with secondary palatal clefting, spina bifida, cardiac anomalies, kidney and thyroid defects, as well as with ocular abnormalities all showing variable degrees of penetrance (Chung et al. 2010; Plageman et al. 2010, 2011; Lang et al. 2014; Durbin et al. 2020). Heterozygotes have not been reported as exhibiting an overt phenotype. IMPC summary data for the Shroom3em1(IMPC)Bay/em1(IMPC)Bay mice indicate highly penetrant exencephaly, midfacial clefting, and variable spina bifida and tail kinking, among other features (https://www.mousephenotype.org/data).
OPT and quantitative assessment of embryonic craniofacial tissue
Shroom3+/gt, Shroom3gt/gt, and Shroom3+/+ littermate controls were collected at approximately embryonic day 14.5 (E14.5) and fixed overnight in 4% paraformaldehyde. Embryos were then rinsed briefly in phosphate buffered saline and embedded in 1.1% low-melting-point agarose in Milli-Q water. Embedded embryos were dehydrated in 100% methanol for 3 days, changing the methanol each day, and then cleared using 1:2, benzyl alcohol:benzyl benzoate (BABB) for 3 days with daily changes of BABB. Samples were then imaged in fresh BABB using a Bioptonics 3001M OPT (Bruker/Skyscan). Imaging was performed at standard 512 × 512 resolution under UV light (425/40 nm excitation; 475 nm emission) with zooming to an image pixel size of ∼25 microns, 0.9° rotation step, and 360° rotation. Raw imaging data were then reconstructed into multiplanar slices (.bmp) with Nrecon V1.7.4.2, using Gaussian smoothing (smoothing set at one), and then imported into Drishti V3.0 volume exploration software (Limaye 2012; https://github.com/nci/Drishti) for qualitative and quantitative assessment of virtual 3D renderings of each scanned sample. Consistent scan, reconstruction, and rendering settings were used for each specimen.
Nine 3D landmark coordinates were collected from each embryo (see Supplemental Fig. 7). These landmarks enabled proxy measurements of the following: left and right-side maxillary length (distal nasal tip to postorbital genal whisker follicle), pinna height (rostral to caudal aspect of auricle), head width (left to right side caudal aspect of auricle), and mandibular length (distal tip of mandible to caudal aspect of auricle). Visual assessment of the different harvested litters suggested subtle differences in embryonic age between litters: E14.25 to E15.25. Therefore, for all measurements except assessments of asymmetry, the litter stage was considered. To assess asymmetry across the embryonic face, the following ratios were calculated: mandibular asymmetry (left vs. right mandibular length), maxillary asymmetry (left vs. right maxillary length) and, head width to auricular length ratio (left and right sides). There was no statistical bias in the sidedness of any asymmetry, and so, data were reported as absolute asymmetry: Abs(1 − left/right). All measurements were graphed using SuperPlotsOfData and were statistically analyzed using a Welch's t-test within this program (Goedhart 2021). Differences were considered significant for comparisons yielding P < 0.05.
Quantitative assessment of microCT data
High-resolution microCT scan data (NRRD file format) of iodine contrast-stained E18.5 Shroom3 KO and control embryos were downloaded from the IMPC website. The data were then imported into Drishti V3.0 as described above for qualitative and quantitative assessment. The same landmark-based analysis was then performed as described for the Shroom3gt/gt analyses, with the exception that size normalization between the control and mutant embryos was performed using left hindlimb foot length measurements, which were also made on the rendered scans.
Data access
All raw and processed sequencing data generated in this study have been submitted to the National Genomics Data Center (GSA; https://ngdc.cncb.ac.cn/gsa-human/) under accession numbers HRA005132, HRA004333, HRA003925, and HRA003924. Raw, reconstructed, and rendered OPT scan data for all mouse embryo analyses are available in figshare (https://doi.org/10.6084/m9.figshare.28440413.v1), and microCT data sets are available through the IMPC website with IDs 157760 (wild type) and 612303 (homozygous) (https://www.mousephenotype.org/embryoviewer/?mgi=MGI%3A1351655). The source data for this paper are available as Supplemental Source Data.
Competing interest statement
S.E.A. is a cofounder and CEO of Medigenome and serves on the scientific advisory board of the “Imaging” institute in Paris. The remaining authors declare no competing interests.
Acknowledgments
We thank the patients and their families for their participation in the study. The study was partially supported by the National Natural Science Foundation of China (32470644 and 82171844 to Y.-B.Z.), the Beijing Natural Science Foundation Program and Scientific Research Key Program of Beijing Municipal Commission of Education (KZ202010025039), the Child Care foundation and a European Research Council grant 249968 to S.E.A., and both a Stowers Family Endowment and BioNexusKC Patton Trust Research Grant to T.C.C. The RDNow program acknowledges financial support from the Royal Children's Hospital Foundation, the Murdoch Children's Research Institute, and the Harbig Foundation. The research conducted at the Murdoch Children's Research Institute was supported by the Victorian Government's Operational Infrastructure Support Program.
Author contributions: Y.-B.Z., T.C.C., and S.E.A. designed and supervised the study. J.Z., Q.Z., S.Z., T.Y.T., J.M., C.Z., H.Z., and P.C. recruited case samples. H.Z., R.L., Z.S., J.L., S.R., and T.C.C. planned and conducted laboratory experiments. M.D.D. and S.M.W. generated the Shroom3 and control embryos. L.L.C and T.C.C performed the qualitative and quantitative assessment of the Shroom3 and control embryos. H.Z., B.X., H.S., Z.M., T.L., X.T., and J.W. analyzed data. H.Z., S.E.A., Y.-B.Z., and T.C.C. drafted and revised the manuscript. All authors have reviewed and contributed to the manuscript.
Footnotes
-
[Supplemental material is available for this article.]
-
Article published online before print. Article, supplemental material, and publication date are at https://www.genome.org/cgi/doi/10.1101/gr.280047.124.
- Received October 7, 2024.
- Accepted March 10, 2025.
This article is distributed exclusively by Cold Spring Harbor Laboratory Press for the first six months after the full-issue publication date (see https://genome.cshlp.org/site/misc/terms.xhtml). After six months, it is available under a Creative Commons License (Attribution-NonCommercial 4.0 International), as described at http://creativecommons.org/licenses/by-nc/4.0/.


