
Abstract
A fundamental goal of genetics is to identify which and how genetic variants are associated with a trait, often using the regression results from genome-wide association (GWA) studies. Important methodological challenges account for inflation in GWA effect estimates as well as in investigating more than one trait simultaneously. We leverage machine learning approaches for these two challenges, developing a computationally efficient method called ML-MAGES. First, we shrink the inflation in GWA effect sizes caused by nonindependence among variants using neural networks. We then cluster variant associations among multiple traits via variational inference. We compare the performance of shrinkage via neural networks to regularized regression and fine-mapping, two approaches used for addressing inflated effects but dealing with variants in focal regions of different sizes. Our neural network shrinkage outperforms both methods in approximating the true effect sizes in simulated data. Our infinite mixture clustering approach offers a flexible, data-driven way to distinguish different types of associations—trait-specific, shared across traits, or nonprioritized—among multiple traits based on their regularized effects. Clustering applied to our neural network shrinkage results also produces consistently higher precision and recall for distinguishing gene-level associations in simulations. We demonstrate the application of ML-MAGES on association analyses of two quantitative traits and two binary traits in the UK Biobank. Our identified associated genes from single-trait enrichment tests overlap with those having known relevant biological processes to the traits. Besides trait-specific associations, ML-MAGES identifies several variants with shared multitrait associations, suggesting putative shared genetic architecture.
Genome-wide association (GWA) studies analyze genome-wide genotype data from a large group of unrelated individuals to identify genetic mutations, usually single-nucleotide polymorphisms (SNPs), that are associated with some trait such as height, molecular biomarkers, or diseases. With advancements in sequencing technologies and the emergence of biobank data sets that sample hundreds of thousands of individuals, GWA studies have proven powerful in detecting potential causal variants for various traits and diseases. More than 45,000 GWA studies investigating more than 5000 human phenotypes have been published since 2005 (Buniello et al. 2018; Sollis et al. 2022).
The fundamental idea behind GWA studies is based on fitting a linear regression in which each SNP genotype is treated as an independent variable, and the trait value of interest is the dependent variable. The regression coefficients are “effect sizes” of variants. GWA studies generally focus on a single trait. To increase statistical power, SNP-level signals are often aggregated to assess gene-level association (Conneely and Boehnke 2007; Lehne et al. 2011; Svishcheva et al. 2019).
A key challenge in analyzing GWA results is controlling the inflation of effect sizes, which complicates the identification of truly associated variants. Most GWA models assume genetic variants to be independent, but there are consistent nonrandom associations among genotypes in a sample, known as linkage disequilibriums (LDs). Closer mutations exhibit higher LD (i.e., correlation), which is also influenced by recombination rates and population history. GWA signals from nonassociated variants can obscure or even surpass those of truly associated ones owing to LD, especially in regions with dense variants. Additionally, many complex traits are highly polygenic (influenced by thousands of variants), further complicating the localization of truly associated ones (Bulik-Sullivan et al. 2015; Pasaniuc and Price 2016; Boyle et al. 2017; Visscher et al. 2021).
Exploring multiple traits simultaneously is another challenge in analyzing GWA results. Joint analysis of multiple traits provides insights into their shared biological pathways by revealing interactions between genetic variants and the traits of interest. Current multitrait approaches typically either combine univariate GWA results to improve statistical power (Cotsapas et al. 2011; Solovieff et al. 2013; Bolormaa et al. 2014) or estimate trait-specific effects to disentangle single trait signals from the joint analysis (Turley et al. 2018; Urbut et al. 2018). Distinguishing between trait-specific and pleiotropic variants, in which a single variant influences multiple traits (Stearns 2010; Wagner and Zhang 2011), is important for generating targeted hypotheses for precision medicine and drug discovery (Solovieff et al. 2013).
We present machine learning for multivariate association analyses with genes and effect size shrinkage (ML-MAGES), a new scalable method that uses neural networks (NNs) and variational inference to analyze multitrait GWA effects. It performs effect size shrinkage via supervised learning with NNs, controlling for the inflation of effect sizes caused by LD. Subsequently, our method identifies multitrait association patterns by clustering variants based on these controlled effects across multiple traits via an infinite mixture model. The resulting clusters suggest distinct types of associations like those that are shared versus those that are trait specific. As a final step, the shrunken effect sizes are aggregated to provide gene-level summaries of association.
In polygenic modeling, methods like regularized regression and Bayesian methods with Gaussian mixture priors are commonly used to induce sparsity, assigning nonzero effects to associated variants while shrinking effects for the rest (Supplemental Methods S1.3; Wu et al. 2009; Cho et al. 2010; Logsdon et al. 2010; Guan and Stephens 2011; Zhou et al. 2013; Thompson et al. 2015; Stephens 2016; Zhu and Stephens 2017; Urbut et al. 2018; Zhang et al. 2018; Zhao et al. 2019; Holland et al. 2020).
In genetic research, fine-mapping is a closely related task to effect size shrinkage. It pinpoints a set of putative causal variants within a small trait-associated region and assigns posterior probabilities of causality to variants (Supplemental Methods S1.3; Hormozdiari et al. 2014; Spain and Barrett 2015; Benner et al. 2016; Pasaniuc and Price 2016; Schaid et al. 2018; Yang et al. 2023; Ghosal et al. 2024). Although some fine-mapping methods, like FINEMAP (Benner et al. 2016) and SuSiE (with extension SuSiE-RSS) (Wang et al. 2020; Zou et al. 2022), generate posterior effect sizes, their primary goal is to prioritize likely causal variants.
To distinguish true from spurious single-trait associations, Cheng et al. (2020) developed gene-ε. It first shrinks SNP effect sizes using elastic net regularization (Zou and Hastie 2005) and then clusters them with a K-mixture model. The resulting component variances are used to test for gene-level associations.
Results
Workflow of ML-MAGES
Inspired by the single-trait gene-ε framework, we propose ML-MAGES to advance multivariate GWA analyses. Our method introduces two key innovations: (1) using deep learning for efficient effect size shrinkage to control for inflation and (2) using variational inference for flexible clustering of multitrait associations.
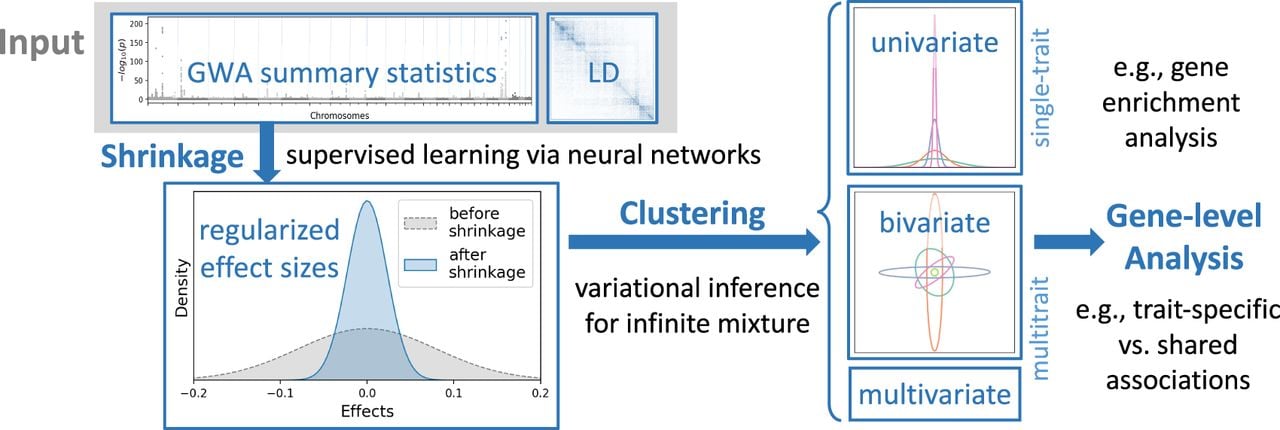
The three main steps of ML-MAGES workflow (for details, see Methods) (Fig. 1) are effect size shrinkage using GWA summary statistics and LD, association clustering of regularized effects based on their multitrait association patterns, and gene-level analysis via aggregation of effects and variant clusters.
Workflow of ML-MAGES for assessing the associations of variants with multiple traits.
Effect size shrinkage
LD introduces inflation into observed GWA effect sizes () compared with the true effects (β). The goal of effect size shrinkage is to obtain regularized effects () to approximate β by accounting for inflation. To account for inflation in effects, a shrinkage method is usually approached via regularization in regression or Bayesian priors. For instance, gene-ε (Cheng et al. 2020) used elastic net (Enet) (Zou and Hastie 2005), a popular regularized regression method, to shrink the effects (see Supplemental Methods S1.3). Also as noted earlier, fine-mapping methods are closely related to this task, although they prioritize identifying likely causal variants, namely, variants with nonzero effects, over providing accurate estimations of their effect sizes (if provided).
We approach effect size shrinkage by framing it as a supervised learning problem, training a feed-forward NN to predict β. The input data to NNs consist of observed effects and standard errors se ∈ ℝm for GWA results on m variants, as well as LD between pairs of variant stored in an m × m matrix R. For a specific variant, its feature input to the models is constructed from its summary statistics and the summary data of the top T variants in highest LD to it (see Methods; Supplemental Methods S1.2). True effects β are the targeted output (Supplemental Fig. S1). Because we need ground-truth effects for training supervised learning models, which are most often not available from genetic studies, we simulate synthetic association data for training (see Supplemental Methods S1.4).
Association clustering
ML-MAGES clusters the nonzero variants based on distributions of their regularized effects () that are assumed to be zero-centered, in which clusters represent different types of associations to the trait(s). In the work of Cheng et al. (2020), gene-ε works with the effects of a single trait by fitting a zero-mean K-mixture model to classify variants as associated, nonassociated with spurious signals, or nonassociated with zero effects. ML-MAGES generalizes the single-trait, K-mixture clustering from gene-ε to a more flexible multivariate infinite-mixture model for association clustering, which likewise distinguishing between variants prioritized and nonprioritized for analyzing association patterns downstream. This allows our method to simultaneously analyze multiple traits and accommodate an arbitrary number of variant effect clusters (see Methods; Supplemental Methods S1.8). Overcoming the limitations of K-mixture models, our infinite mixture model (Supplemental Fig. S2) automatically captures diverse multitrait association patterns by inferring the number of clusters directly from the data.
Gene-level analysis
Combining results from SNPs in each gene enables examination of association patterns at the gene level. Gene-level signals can be compared with existing biological knowledge and offer insights into the genetic pathways underlying the traits. For a single trait, we adopt the enrichment test used by gene-ε (Imhof 1961; Davies 1980; Liu et al. 2009; Cheng et al. 2020). In the multitrait context, although no single test statistic is available, we characterize gene-level signals by analyzing the distribution of variant effects in each cluster, both visually and quantitatively (see Methods; Supplemental Methods S1.10).
Performance comparison on simulated data
We benchmarked our NN shrinkage method against elastic net (Enet) (Zou and Hastie 2005), and the two fine-mapping methods, FINEMAP (Benner et al. 2016) and SuSiE-RSS (Wang et al. 2020; Zou et al. 2022), using simulated data. For multitrait analyses, we also included MTAG (Turley et al. 2018) as a comparison, using its trait-specific effects for downstream analyses even though it serves a different objective and does not account for LD. Because these methods are computationally intensive, analyses were partitioned into tasks on approximately independent LD blocks from a chromosome (Supplemental Methods S1.5; Berisa and Pickrell 2015).
We implemented and compared six NN model configurations: the combinations of three different feature sets (using T = 5, 10, and 15 variants in highest LD to the focal variant in Eq. 2) and two architectures (with two and three hidden layers). We also benchmarked against an NN model with no hidden layers (LINEAR) to demonstrate the advantage of capturing nonlinearity. For robustness, we employed ensemble learning, averaging the outputs of 10 models of the same architecture trained on random data subsets. All results presented hereafter are from the ensemble-averaged outputs. We trained and validated our models using data simulated from UK Biobank genotypes on Chromosomes 18–22 and evaluated performance on a held-out test set from Chromosome 15 (for simulation details, see Supplemental Methods S1.4). Throughout simulation analyses, we use the term “causal variants” to refer to those with a nonzero true effect. However, note that in practice, establishing the causality of a variant is a complex process; therefore, when analyzing real date, we describe variants as being “associated” with a trait rather than causal.
In simulation analyses, our effect size shrinkage models demonstrate substantial improvements in efficiency (Supplemental Table S5) while achieving comparable or superior accuracy in effect size estimation (Fig. 2; Supplemental Figs. S3, S4, Supplemental Tables S1, S2). As all six NN configurations performed similarly, we focus on the results for two representative models: the two-layer and three-layer networks using T = 15 variants for feature construction (ML-MAGES 2L and 3L). Full results are provided in the Supplemental Materials (Supplemental Tables S1–S4).
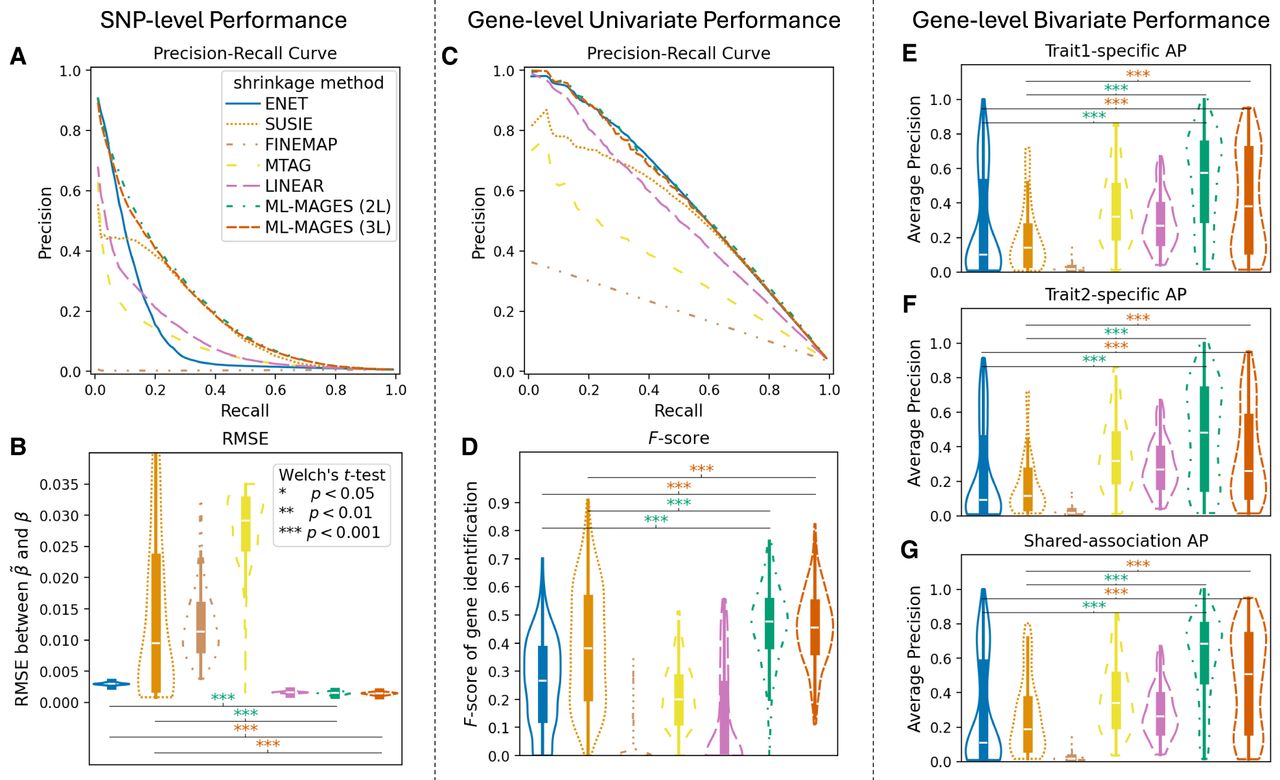
Our methods ML-MAGES 2L and 3L outperform other methods in effect size shrinkage in simulation analysis. (Left) SNP-level performance: comparing the regularized effects and the true effects of each simulation. (Center) Gene-level univariate performance: comparing univariate enrichment test with the simulated ground truth. (Right) Gene-level bivariate performance: comparing aggregated effect at the gene level based on bivariate association clustering output with the simulated ground truth. Legends shown in A apply to all panels; violin plots are ordered from left to right as Enet, SuSiE, FINEMAP, MTAG, LINEAR, ML-MAGES 2L, and 3L. Violin plots are labeled with the significance level of Welch's t-test for difference between our methods and Enet and SuSiE, as shown in the legends of B. (A) Precision-recall curve (PRC) averaged across all 200 simulations (by interpolation), in which the positives are the true nonzero effects and the precision-recall pairs are obtained by thresholding . (B) RMSE between β and . (C) PRC averaged across all 200 simulations (by interpolation), in which the true positives are the truly associated genes and the precision-recall pairs are obtained by thresholding negative log of P-values from enrichment tests. (D) F-score of identifying associated genes, where genes with an FDR-adjusted P < 0.05 from the enrichment test is identified as associated. (E,F) Trait-specific average precision (AP) for identifying genes with trait-specific association to simulated traits 1 and 2, when ranking genes by the sum of absolute effects of variants in trait-specific clusters and comparing against genes being truly trait-specific. (G) AP for identifying genes associated to both traits, when ranking genes by the sum of absolute effects of variants in clusters of shared association and comparing against genes being truly associated to both traits.
Estimating true SNP-level effects
We first evaluated each method's effect size shrinkage performance at the SNP level using two metrics: estimation accuracy via the root mean squared error (RMSE) between the regularized () and true (β) effects, and the ability to rank truly associated variants over nonassociated ones via precision-recall curves (PRCs), in which a curve closer to the upper-right indicates better performance. The results are shown in Figure 2, A and B.
Our ML-MAGES models identify truly associated variants with PRC comparable to SuSiE and better than the others. The sharp decrease in precision at small recall is an expected consequence of the highly imbalanced data (<1.5% of variants were simulated with a nonzero true effect). Furthermore, our models outperformed all other methods in the accuracy of effect size estimation. As a fine-mapping method, SuSiE performs well at prioritizing causal variants from a small region, which is our simulation scenario, but is not designed to accurately estimate their effects. The other fine-mapping method, FINEMAP, performed worse than SuSiE even at identifying causal variants. MTAG also performed poorly, which is unsurprising as it is not designed for effect size shrinkage. In particular, the undesired performance of the LINEAR model underscores the benefit of capturing nonlinear relationships in effect size shrinkage.
A key advantage of our NN-based shrinkage is its computational efficiency and scalability. On a test set with about 15,000 variants split into 17 LD blocks (based on Chromosome 15), our method (∼3 sec) was >30× faster than Enet (∼88 sec) and 70× faster than SuSiE (∼210 sec). A similar speed advantage was observed on smaller test regions with 1000 variants (ML-MAGES: ∼1 sec; Enet: ∼5 sec; SuSiE: ∼2 sec) (for a full list of times and variance, see Supplemental Table S5). This advantage becomes more significant when analyzing larger and denser chromosomal segments in practice, as our method's runtime scales linearly with data size. Even considering the one-time training cost, which takes a few seconds per epoch for fewer than a hundred epochs on our simulation data (Supplemental Table S6), our NN models remain most efficient overall.
Prioritizing associated genes via single-trait enrichment
We then conducted single-trait gene enrichment tests by aggregating SNP-level effects and assessed the power for identifying associated genes at a significance level of P = 0.05 (Imhof 1961; Davies 1980; Liu et al. 2009), corrected for an false-discovery rate (FDR) at 0.05 (Benjamini and Hochberg 1995). We calculated F-score and used the negative log P-values from our enrichment tests to generate PRCs (Fig. 2C,D). Our NN models show the best overall performance. Both SuSiE and Enet achieve comparable PRC performance. The potentially overestimated SNP effects produced by SuSiE are still sufficient to identify the correct causal genes upon aggregation, and Enet likely captures partial signal within causal genes without pinpointing the exact causal variants. Both methods, however, show a less favorable F-score, which is also reflected in their underlying precision and recall values (Supplemental Table S3).
Characterizing multitrait associations of genes
We evaluated the performance of multitrait gene-level analysis using simulated bivariate data. By examining the variance-covariance matrix from Gaussian mixture clustering, we classified variant clusters as trait specific, shared, or nonprioritized (i.e., having near-zero effects after shrinkage). For each gene, we then summed the absolute effects of its variants within the trait-specific and shared clusters. These sums were ranked against the simulated ground truth. To quantify how well each method distinguished between association types, we used average precision (AP), which approximates the area under the PRC (Fig. 2E–G). A higher AP indicates better performance. MTAG gave a moderate performance in identifying trait-specific genes and a poor performance in identifying shared associations. The observed performances were expected given that MTAG’s joint analysis was designed to provide trait-specific effects (not controlled for inflation) and that this evaluation focused on the relative rank of effect sums rather than the exact effect sizes. Overall, ML-MAGES performs the best in distinguishing genes with different multitrait associations.
We extended our analysis to a more complex three-trait simulation. In this scenario, we simulated genes with various effect patterns: trait-specific associations, shared associations between two traits, and shared associations across all three. Across SNP-level, univariate gene-level, and multivariate gene-level analyses, our method's performance remained consistent with the results from the two-trait scenario. The results are included in Supplemental Figure S3.
Model robustness to training data variation
We performed additional analyses to assess the robustness of our models’ performance under differences between training and evaluation data.
To evaluate how the models perform when the assumed genetic architecture in simulation is misspecified, we generated different genetic architectures by varying parameters in our simulation of effect sizes. Specifically, we varied parameters s and w in Equation 10. These exponents control the influence of a variant's allele frequency (governed by s) and LD score (governed by w) on the variance of its simulated effect size (see Methods; Supplemental Methods S1.4). For example, when w = −1, nontrivial relationships arise between effect size and a variant's LD score, which aligns with the weighting scheme in LDAK models (Speed et al. 2012, 2017). When s = 0, effect sizes are independent of allele frequencies. To assess robustness, we trained our NN models on effects simulated under one parameter setting (s = −0.25, w = 0), the one we used throughout our analyses, and evaluated them on both this setting and three alternatives: s = 0, w = 0; s = 0, w = −1; and s = −0.25, w = −1. The results are shown in Supplemental Figure S5. The models performed consistently across these simulation settings, indicating its robustness to genetic architecture variation in simulations. This stability suggests that the model is effective even when genetic architecture assumptions do not perfectly match the underlying truth.
We also performed a cross-chromosome validation to evaluate the models’ sensitivity to differences between chromosomes used for simulating the training data. We separately generated a training set composed of 100 simulations for each setting based on Chromosomes 13, 14, 16, and 17 and a validation set composed of 100 simulations each based on Chromosome 15. We trained and validated a new set of models on these data and then applied them to the previous validation data based on Chromosome 20. The effect size shrinkage performance, as measured by both the PRC of ranking truly association variants correctly and the RMSE between regularized and true effects, was only slightly worse than that of the original models (Supplemental Fig. S6), suggesting that our model is not sensitive to the specific chromosomes used for generating training data.
Application to real data
Application to quantitative traits: HDL and LDL cholesterol
To get a comprehensive understanding of how different shrinkage methods affect gene-level analysis, we analyzed GWA effects obtained via PLINK2 (Chang et al. 2015) of two quantitative traits from the UK Biobank (Sudlow et al. 2015): high-density lipoprotein cholesterol (HDL) and low-density lipoprotein cholesterol (LDL). The data included 489,953 variants from 334,851 European ancestry individuals (see Supplemental Methods S1.1). We show the results for Enet, SuSiE, and ML-MAGES in Figure 3 (panels C and D are based on ML-MAGES (2L) only). The methods LINEAR and FINEMAP were excluded owing to their poor performance in our simulation analyses. Additionally, we examine MTAG’s output for comprehensiveness and performed association clustering on its output effects from the joint analysis of two traits (Supplemental Fig. S7). The results neither shows shrinkage nor distinguishes trait-specific versus shared associations, which was expected as these tasks are not the target of MTAG, so we also excluded it from all downstream analyses.
ML-MAGES identifies known genes with shared and trait-specific associations for high-density lipoprotein cholesterol (HDL) and low-density lipoprotein cholesterol (LDL) in the UK Biobank. We analyzed GWA of two traits: HDL and LDL. Panels C and D include results from four methods (Enet, SuSiE, and ML-MAGES 2L and 3L). For the other panels, only ML-MAGES 2L results are shown. (A,B) The univariate clustering on GWA effects of HDL and LDL. Clusters are represented by the inferred Gaussian , labeled with their inferred mixing weights πk. (C,D) The −log10(P) value from gene enrichment tests of HDL and LDL for a list of genes found significant by the test for either of the two traits. Darker color indicates higher statistical significance, and nonsignificant genes with adjusted P ≥ 0.05 are left blank. Associated genes that have related biological processes terms in the GO database (Ashburner et al. 2000) have colored labels. Unlike the other three methods, SuSiE shrinkage fails to identify some most relevant genes. (E) Variants plotted by their regularized effects on HDL and LDL, with color and style denoting their cluster assignment from association clustering. Clusters are ordered in descending Tr(Σk). The proportion of variants with nonzero effects in each cluster is labeled in the legend. Clusters beyond those listed are categorized as nonprioritized associations and grouped into the “rest.” (F) Inferred mixtures from bivariate clustering, shown as covariance (Σk) ellipses from Gaussian mixtures, with inferred mixing weights πk labeled in the legend. (G) The fraction of variants assigned to each of the genes listed in panels C and D that belong to each type of association clusters. (H) Normalized sum of squared effects or sum of effect products of variants in each gene, calculated as , where g denotes the set of variants assigned to a gene with variants indexed by i, and p1 and p2 index the two traits. Three sums are considered: two trait-specific sums of squared effects and the sum of effect products for shared associations. (I) −log10(P) of single-trait enrichment test for each of the two traits, corresponding to the color-coded values in third rows of panels C and D.
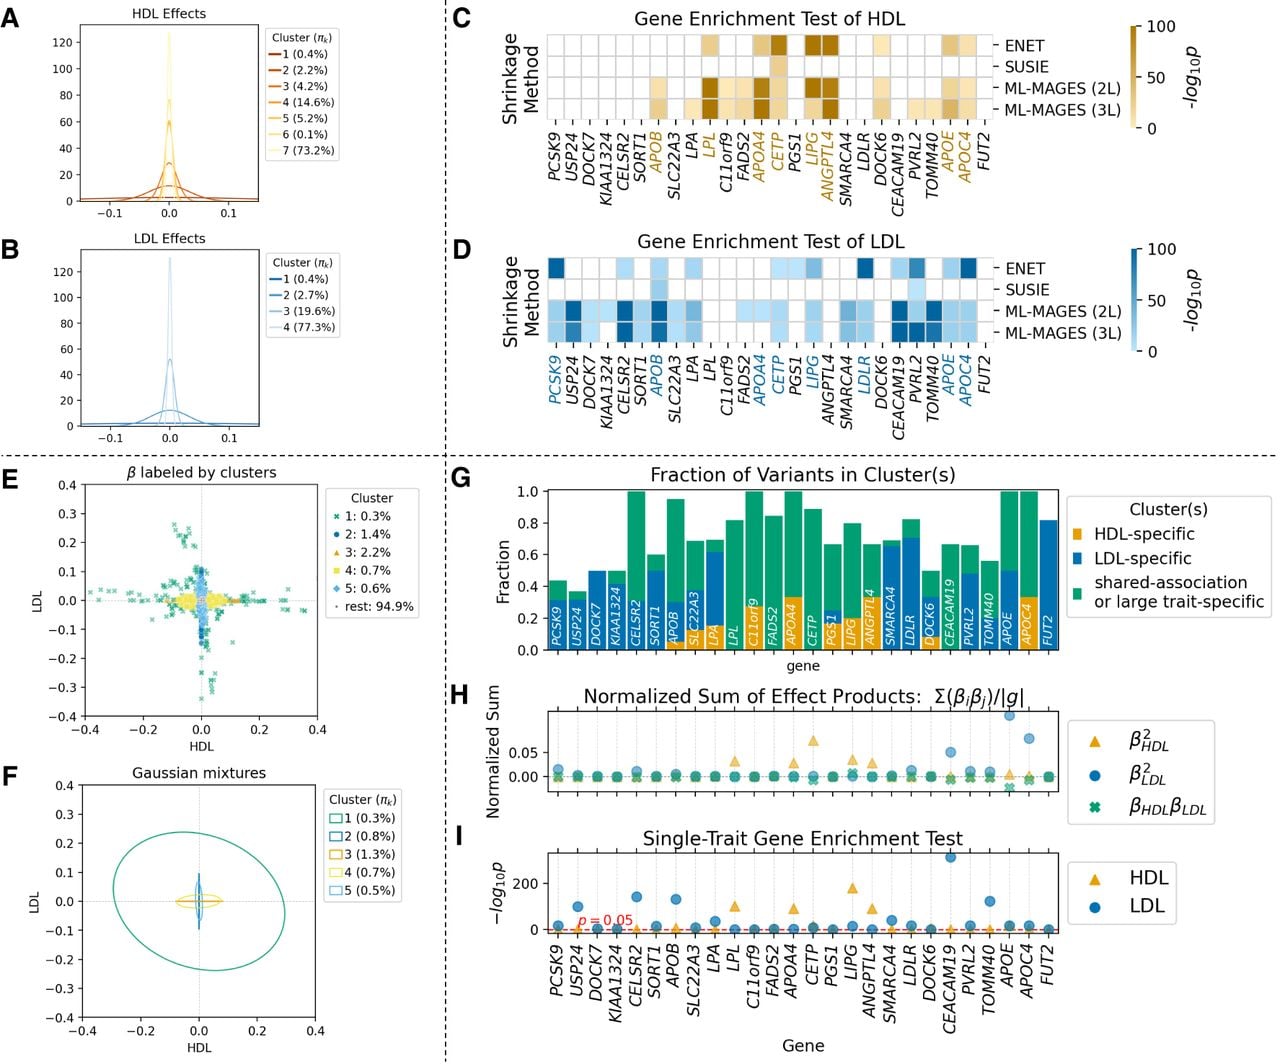
We performed gene enrichment test on each of the two traits separately using their regularized effects and association clustering output. We referred to the GO knowledge base (Ashburner et al. 2000; Aleksander et al. 2023) for information on genes related to biological processes of HDL and LDL and used this established information (Chen et al. 2013) to validate our results (Fig. 3C,D). Enet and the two NN methods ranked a very similar set of genes, most of which are known to be involved in relevant biological processes. In contrast, SuSiE did not capture some top genes, and this poor performance is consistent with simulation results (Fig. 2). We hypothesize that Enet was comparable to NN methods in enrichment tests because it retains at least some variants with nonzero effects in strongly associated genes, which likely explains its strong performance in Cheng et al. (2020).
From multitrait analysis, we were able to identify genes with different association patterns (Fig. 3E–I). The inferred Gaussians (Fig. 3F) clearly distinguish between variants with trait-specific associations (e.g., clusters 2–5) and those with shared associations (e.g., cluster 1, showing weak negative correlation between traits). Gaussian mixture components with small Tr(Σk) (i.e., clusters labeled “rest”) are nonprioritized, similar to the spurious association identified by the univariate gene-ε method. We categorized prioritized clusters into three types (Supplemental Methods S1.10): specific to HDL, specific to LDL, and a third category for shared or strong trait-specific effects.
The fraction of a gene's variants in each category and their normalized sum of effect products (Fig. 3G,H) suggest its association type. For example, the PCSK9 and LDLR genes showed predominantly LDL-specific associations. However, some clusters can be ambiguous. For example, cluster 1 in Figure 3F contains both large trait-specific effects and shared effects, which complicates the interpretation of genes like LPL, which is known to be LDL specific but nevertheless dominated by this cluster. In such cases, a careful examination of the shape of the cluster's covariance ellipse (Σk) can help refine the cluster categorization and warn against this ambiguity. Despite occasional ambiguity when a single cluster contains mixed association types, our association clustering method captures significantly richer information than standard single-trait gene-level tests.
The univariate enrichment test only uses a SNP-level null threshold value obtained from the clustering results and primarily identifies genes with large trait-specific fractions (Fig. 3I), potentially overlooking weakly associated genes and failing to fully utilize all SNP-level information. Instead, our multitrait analysis is able to bring more information from the SNP-level effects to the gene level (Fig. 3G,H) and capture signals for shared associations, helping locate genes potentially of interest for the study of their trait-specific versus pleiotropic contributions. As the number of traits and the complexity of their association patterns grow, although direct visualization becomes infeasible, our method would become particularly advantages at automatically inferring these patterns and highlighting them in gene-level summaries.
Application to binary traits
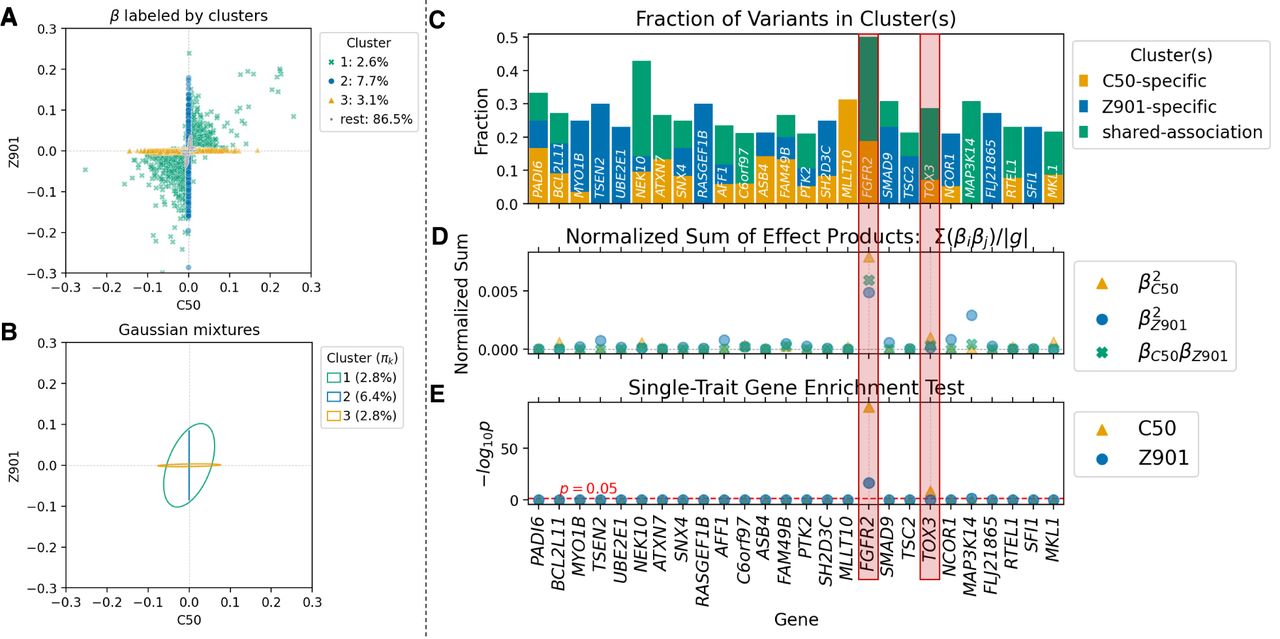
To test the generalizability of ML-MAGES, we applied it to the GWA results of two binary traits in the UK Biobank data: malignant neoplasm of breast (C50) and acquired absence of breast (Z90.1), both ICD10-coded diseases. We used the log odds ratios as variant effects. As with the quantitative traits, association clustering successfully categorizes trait-specific and shared-association clusters; in this case, the shared-association cluster exhibited a slight positive correlation (Fig. 4A,B). ML-MAGES identifies two significant genes that have shared associations with both diseases, FGFR2 and TOX3, suggesting a likely similarity in their biological underpinnings. These two genes show the largest normalized sum of effect products and exhibit very similar patterns in the fraction of variants belonging to each cluster (Fig. 4C,D). This finding aligns with the work of Cortes et al. (2020), who also associated these genes with nearly identical nodes in the ICD-10 ontology. The specific variants they pinpointed (rs2981575 and rs4784227) both fall within the shared-association cluster identified by our method.
ML-MAGES’s association clustering and gene-level signals highlight genes with shared associations across two binary traits in the UK Biobank. Two traits are malignant neoplasm of breast (C50) and acquired absence of breast (Z90.1). The two genes highlighted in the figure, FGFR2 and TOX3, are those identified by Cortes et al. (2020) as showing similar biological pathways. The figure style follows that of Figure 3, E–I. (A) The bivariate clustering results based on regularized effects of two traits. (B) Inferred mixtures from bivariate clustering, shown as covariance ellipses with inferred mixing weights πk. (C) Fraction of variants in each gene that belong to each type of clusters. The genes listed have at least 10 variants and >20% of variants from one of the prioritized clusters. (D) Normalized sum of effect products of variants in each gene. (E) Single-trait enrichment test −log10(P) for each trait.
Discussion
GWA studies have been powerful tools for understanding the genetic architecture of complex human traits (Visscher et al. 2017; Uffelmann et al. 2021). We introduced ML-MAGES, a computationally efficient and effective machine learning framework for multitrait association analysis, to address two open challenges: the inflation in GWA effects caused by LD, and the detection of shared associations missed by single-trait analyses. Our NN-based shrinkage achieves higher accuracy in approximating the true SNP-level effect sizes compared with the regularized regression (Cheng et al. 2020) and fine-mapping (Zou et al. 2022) methods (Fig. 2A,B) and is more computationally efficient (Supplemental Table S5), which in turn improves the categorization of gene-level signals in the simulated data (Fig. 2C–G). By generalizing gene-ε’s univariate clustering (Cheng et al. 2020) to a multivariate scenario and using an infinite mixture model solved by variational inference, our method enables the exploration of complex multitrait association patterns. Our method aggregates SNP-level effects and association clustering results at the gene level, providing intuitive summaries that reveal various association patterns (e.g., the geometry of the Gaussian ellipses and the proportion of variants in each cluster) (Fig. 3D–G), which offers both quantitative and visual interpretations of the underlying multitrait signals.
A major drawback of using supervised learning for shrinkage is its reliance on simulated data for model training. Generating simulations requires access to individual-level genotypes, and synthetic GWA effects need to be similarly distributed as real ones. These impose limitations on the generalizability of the models across different contexts; for instance, a model trained on European-based data will likely perform less effectively in other populations, as is commonly observed in genetic studies (Popejoy and Fullerton 2016; Sirugo et al. 2019; Martin et al. 2020). Additional simulation analyses show that supervised learning-based shrinkage outperforms Enet even when the training and evaluation simulations are generated using different real data or under different simulations settings, given that the effect size distributions match (Supplemental Figs. S4–S6). We included the option to transform data to both symmetric or asymmetric Laplacian distribution to partially accommodate the case when effects may not be centered around zero. Still, performance of the models can be compromised if the simulated training distribution does not match the target trait's distribution. In practice, the distribution of GWA effects may vary substantially across traits. Although our data transformation reflects a distribution common among some popular UK Biobank quantitative traits, for traits with markedly different effect distributions, we recommend retransforming the simulation data to match the actual empirical distribution and retraining the models, which requires only a couple minutes. Nevertheless, adaptively generating realistic synthetic data remains challenging in genetic studies, and further advancement in simulation strategies would benefit our method as well.
Another limitation of our method is the difficulty in interpreting results of multivariate clustering. As observed from our demonstrative example, a locally optimal cluster sometimes groups variants with different types of effects together, for example, some being putatively pleiotropic and some having large trait-specific effects (Fig. 3E, cluster 1). The inferred Gaussian instead suggests weak negative correlation between traits (Fig. 3F), which can complicate the interpretation of genes like LPL that are dominated by this cluster. We need to be careful when designating the association type of the clusters; although examining the shape of the covariance ellipse (Σk) can refine cluster categorization and help detect these patterns, such visualization is not always feasible. Visualizing clusters becomes particularly challenging when analyzing more than two or three traits. Methods to intuitively summarize and present the clustering results, especially for high-dimensional data, would be beneficial. Formulating multivariate null hypotheses to develop corresponding multitrait association “enrichment tests” can also help, as well as other analyses of the association clustering results. For example, calculating a cluster-specific, polygenic-score-like measure for each individual and comparing it to the trait values would help quantify the genetic liability contributed by different association patterns, as would estimating the partitioned heritability contributed by SNPs in each cluster.
Analyzing multiple traits simultaneously offer notable advantages over single-trait approaches by uncovering potential pleiotropic effects, which can inform therapeutic hypotheses regarding multiple diseases or medical conditions. Identifying various types of genetic associations among traits provides a comprehensive understanding of genetic factors influencing them, whether or not the traits have similar characteristics. Our multivariate approach, ML-MAGES, performs comparably to univariate ones for studying trait-specific signals yet reveals additional patterns when correlations between traits exist. Beyond analyzing different traits, the framework can also be used to study group-specific versus shared associations across groups (e.g., different sexes or disease onsets). With its improved efficiency and expanded functionality enabled by machine learning techniques, our method is a complementary advance to single-trait GWA analyses.
Methods
Effect size shrinkage as a supervised learning task
The goal of effect size shrinkage is to obtain regularized effects by accounting for inflation caused by correlations. The number of truly causal variants, that is, those with βj ≠ 0, is usually limited, even for highly polygenic traits. Shrinkage methods encourage sparsity in by introducing for nonassociated SNPs. This is similar to variable selection in high-dimensional data, making regularized regression a popular choice for this task. For example, gene-ε (Cheng et al. 2020) uses Enet (Zou and Hastie 2005). However, because regularized regression has input space, the algorithm can quickly become computationally infeasible as the number of variants (m) increases. Moreover, the method assumes linear relationships between true and inflated genetic effects, which may not hold true in practice. To overcome the inefficiency of regularized regression and its limitation in handling nonlinearities, we approach effect size shrinkage via a supervised learning task using feed-forward NNs.
Model objective
Our supervised learning formulation uses summary statistics and LD to construct feature input, denoted as Ω. True effects β are the targeted output. The model is trained by minimizing the mean squared error (MSE) between β and the regularized, predicted effects (). The model objective is
Feature design
We hypothesized that the inflated effect size of a focal variant is primarily driven by other variants most strongly correlated with it. Therefore, we constructed the input features for a given variant using summary statistics from the top T variants in highest LD to it. Features for variant j are constructed as
NN architecture and training
We proposed two NN architectures, differing in their model complexity: one contains two hidden layers, and the other one contains three. We also varied the input feature size through varying T. Additionally, we considered a network consisting of only the output layer as a “linear” model to investigate the importance of capturing nonlinear relationships in shrinkage. Detailed architectures and training settings are in Supplemental Methods S1.6 and Supplemental Figure S1.
We generated synthetic data for model training and evaluation. Specifically, we sampled true nonzero effects from a normal distribution under a flexible variance model that incorporates allele frequency and LD. The simulation parameters includes a factor s controlling the influence of allele frequency on the variance through heterozygosity, a factor w controlling the dependence of variance on LD score of the variants, the proportion of SNPs designated as causal, and the narrow-sense heritability of a synthetic trait (see Supplemental Methods S1.4). We then simulated synthetic trait values using an additive model (Cantor et al. 2010; Uffelmann et al. 2021), as in Cheng et al. (2020), from which we obtained GWA effects and transformed them to match the empirical effect size distributions observed in real data.
Association clustering based on effect size distributions
In work by Cheng et al. (2020), the K-mixture model was tested with a range of K values and the optimal K reported sometimes equals the largest one, suggesting that a higher K possibly fits the data better. ML-MAGES uses an infinite-mixture of multivariate Gaussians to cluster the nonzero variants after effect size shrinkage, automatically inferring the number of clusters and overcoming this limitation. This is particularly helpful for multitrait analysis as the complexity of association patterns grows quickly with the number of traits.
We restricted clustering to variants that have nonzero effects for any of the p traits. Let be the effects of m variants on p traits. The clustering input is γ ∈ ℝJ×p, where
Let zik ∈ {0, 1} be the latent indicator variable with zik = 1 if variant i belongs to cluster k and 0 if not. Let be a multivariate normal with mean μ and covariance A−1 or, equivalently, with precision A. Cat(π) denotes a categorical distribution parameterized by π.
The zero-mean infinite-mixture model is
Each inferred cluster is a zero-mean Gaussian with covariance . The clusters are first ordered by decreasing πk values. An optimal number of clusters, K* (K* ≤ K), is determined by truncating K at a reasonably large value such that . The remaining K* clusters are then ordered decreasingly by Tr(Σk). When p = 1, this is equivalent to the ordering used by gene- ε: .
Gene-level analysis
Effect size shrinkage and association clustering results of variants in each gene were combined for gene-level signals. When number of traits p = 1, we adopted the single-trait enrichment test used by Cheng et al. (2020; see Supplemental Methods S1.9). For higher p, the covariance ellipse (Σk) of a Gaussian mixture component provides a geometric interpretation of the association pattern. For example, if the major axis of a cluster falls close to a Cartesian axis and is much longer than all other axes, the cluster is “trait specific,” with variants strongly associated to one trait but not the other. If Tr(Σk) is large and the angle of the major axis to any of the Cartesian axes is large, the cluster likely contains shared associations. If Tr(Σk) is small, the cluster has nonprioritized associations. We computed fractions of variants in each gene from different types of clusters (see Supplemental Methods S1.10). Genes with large shared-association fractions are putatively pleiotropic. We also calculated the normalized sum of products of SNP effects across traits in each gene as
Software availability
The source code is available at GitHub (https://github.com/ramachandran-lab/ML-MAGES) and as Supplemental Code. The repository includes example data and scripts with instructions to run the program, to visualize the results, and to reproduce summary-level and simulation data. All summary-level and simulation data generated in this study are available at Zenodo (https://doi.org/10.5281/zenodo.17215974).
Competing interest statement
The authors declare no competing interests.
Acknowledgments
This study was funded by the U.S. National Institutes of Health (NIH R35 GM139628) and the Data Science Institute at Brown University. Access to UK Biobank data is under UK Biobank application 22419. We also acknowledge Samuel Pattillo Smith and Wei Cheng for helpful discussions. This research was conducted using computational resources at the Center for Computation and Visualization, Brown University.
Author contributions: Conceptualization was by X.L., S.R., and L.C. Methodology was by X.L., S.R., and L.C. Software was by X.L. Validation was by X.L. Resources were by S.R. Data curation was by X.L. Writing of the original draft was by X.L., S.R., and L.C. Reviewing and editing were by X.L., S.R., and L.C. Visualization was by X.L. Supervision was by S.R. and L.C. Funding acquisition was by S.R.
Notes
[1] Supplementary material [Supplemental material is available for this article.]
[2] Article published online before print. Article, supplemental material, and publication date are at https://www.genome.org/cgi/doi/10.1101/gr.280440.125.
[3] Freely available online through the Genome Research Open Access option.
References
- ↵Aleksander SA, Balhoff J, Carbon S, Cherry JM, Drabkin HJ, Ebert D, Feuermann M, Gaudet P, Harris NL, Hill DP, 2023. The Gene Ontology knowledgebase in 2023. Genetics 224: iyad031. 10.1093/genetics/iyad031
- ↵Ashburner M, Ball CA, Blake JA, Botstein D, Butler H, Cherry JM, Davis AP, Dolinski K, Dwight SS, Eppig JT, 2000. Gene Ontology: tool for the unification of biology. The Gene Ontology Consortium. Nat Genet 25: 25–29. 10.1038/75556
- ↵Benjamini Y, Hochberg Y. 1995. Controlling the false discovery rate: a practical and powerful approach to multiple testing. J R Stat Soc Series B Stat Methodol 57: 289–300. 10.1111/j.2517-6161.1995.tb02031.x
- ↵Benner C, Spencer CC, Havulinna AS, Salomaa V, Ripatti S, Pirinen M. 2016. FINEMAP: efficient variable selection using summary data from genome-wide association studies. Bioinformatics 32: 1493–1501. 10.1093/bioinformatics/btw018
- ↵Berisa T, Pickrell JK. 2015. Approximately independent linkage disequilibrium blocks in human populations. Bioinformatics 32: 283–285. 10.1093/bioinformatics/btv546
- ↵Blei DM, Jordan MI. 2006. Variational inference for Dirichlet process mixtures. Bayesian Analysis 1: 121–143. 10.1214/06-BA104
- ↵Bolormaa S, Pryce JE, Reverter A, Zhang Y, Barendse W, Kemper K, Tier B, Savin K, Hayes BJ, Goddard ME. 2014. A multi-trait, meta-analysis for detecting pleiotropic polymorphisms for stature, fatness and reproduction in beef cattle. PLoS Genet 10: e1004198. 10.1371/journal.pgen.1004198
- ↵Boyle EA, Li YI, Pritchard JK. 2017. An expanded view of complex traits: from polygenic to omnigenic. Cell 169: 1177–1186. 10.1016/j.cell.2017.05.038
- ↵Bulik-Sullivan BK, Loh PR, Finucane HK, Ripke S, Yang J, Patterson N, Daly MJ, Price AL, Neale BM. 2015. LD score regression distinguishes confounding from polygenicity in genome-wide association studies. Nat Genet 47: 291–295. 10.1038/ng.3211
- ↵Buniello A, MacArthur JAL, Cerezo M, Harris LW, Hayhurst J, Malangone C, McMahon A, Morales J, Mountjoy E, Sollis E, 2018. The NHGRI-EBI GWAS catalog of published genome-wide association studies, targeted arrays and summary statistics 2019. Nucleic Acids Res 47: D1005–D1012. 10.1093/nar/gky1120
- ↵Cantor RM, Lange K, Sinsheimer JS. 2010. Prioritizing GWAS results: a review of statistical methods and recommendations for their application. Am J Hum Gene 86: 6–22. 10.1016/j.ajhg.2009.11.017
- ↵Chang CC, Chow CC, Tellier LC, Vattikuti S, Purcell SM, Lee JJ. 2015. Second-generation PLINK: rising to the challenge of larger and richer datasets. GigaScience 4: s13742-015. 10.1186/s13742-015-0047-8
- ↵Chen EY, Tan CM, Kou Y, Duan Q, Wang Z, Meirelles GV, Clark NR, Ma'ayan A. 2013. Enrichr: interactive and collaborative HTML5 gene list enrichment analysis tool. BMC Bioinformatics 14: 128. 10.1186/1471-2105-14-128
- ↵Cheng W, Ramachandran S, Crawford L. 2020. Estimation of non-null SNP effect size distributions enables the detection of enriched genes underlying complex traits. PLoS Genet 16: e1008855. 10.1371/journal.pgen.1008855
- ↵Cho S, Kim K, Kim YJ, Lee J, Cho YS, Lee J, Han B, Kim H, Ott J, Park T. 2010. Joint identification of multiple genetic variants via elastic-net variable selection in a genome-wide association analysis. Ann Hum Genet 74: 416–428. 10.1111/j.1469-1809.2010.00597.x
- ↵Conneely KN, Boehnke M. 2007. So many correlated tests, so little time! Rapid adjustment of P values for multiple correlated tests. Am J Hum Genet 81: 1158–1168. 10.1086/522036
- ↵Cortes A, Albers PK, Dendrou CA, Fugger L, McVean G. 2020. Identifying cross-disease components of genetic risk across hospital data in the UK biobank. Nat Genet 52: 126–134. 10.1038/s41588-019-0550-4
- ↵Cotsapas C, Voight BF, Rossin E, Lage K, Neale BM, Wallace C, Abecasis GR, Barrett JC, Behrens T, Cho J, 2011. Pervasive sharing of genetic effects in autoimmune disease. PLoS Genet 7: e1002254. 10.1371/journal.pgen.1002254
- ↵Davies RB. 1980. Algorithm as 155: the distribution of a linear combination of χ2 random variables. Appl Stat 29: 323. 10.2307/2346911
- ↵Ghosal S, Schatz MC, Venkataraman A. 2024. Beatrice: Bayesian fine-mapping from summary data using deep variational inference. Bioinformatics 40: btae590. 10.1093/bioinformatics/btae590
- ↵Guan Y, Stephens M. 2011. Bayesian variable selection regression for genome-wide association studies and other large-scale problems. Ann Appl Stat 5: 1780–1815. 10.1214/11-AOAS455
- ↵Holland D, Frei O, Desikan R, Fan CC, Shadrin AA, Smeland OB, Sundar VS, Thompson P, Andreassen OA, Dale AM. 2020. Beyond SNP heritability: polygenicity and discoverability of phenotypes estimated with a univariate Gaussian mixture model. PLoS Genet 16: e1008612. 10.1371/journal.pgen.1008612
- ↵Hormozdiari F, Kostem E, Kang EY, Pasaniuc B, Eskin E. 2014. Identifying causal variants at loci with multiple signals of association. Genetics 198: 497–508. 10.1534/genetics.114.167908
- ↵Imhof JP. 1961. Computing the distribution of quadratic forms in normal variables. Biometrika 48: 419–426. 10.1093/biomet/48.3-4.419
- ↵Jordan MI, Ghahramani Z, Jaakkola TS, Saul LK. 1999. An introduction to variational methods for graphical models. Mach Learn 37: 183–233. 10.1023/A:1007665907178
- ↵Lehne B, Lewis CM, Schlitt T. 2011. From SNPs to genes: disease association at the gene level. PLoS One 6: e20133. 10.1371/journal.pone.0020133
- ↵Liu H, Tang Y, Zhang HH. 2009. A new chi-square approximation to the distribution of non-negative definite quadratic forms in non-central normal variables. Comput Stat Data Anal 53: 853–856. 10.1016/j.csda.2008.11.025
- ↵Logsdon BA, Hoffman GE, Mezey JG. 2010. A variational Bayes algorithm for fast and accurate multiple locus genome-wide association analysis. BMC Bioinformatics 11: 58. 10.1186/1471-2105-11-58
- ↵Martin AR, Gignoux CR, Walters RK, Wojcik GL, Neale BM, Gravel S, Daly MJ, Bustamante CD, Kenny EE. 2020. Human demographic history impacts genetic risk prediction across diverse populations. AmJ Hum Genet 107: 788–789. 10.1016/j.ajhg.2020.08.020
- ↵Nickl P. 2020. “Bayesian inference for regression models using nonparametric infinite mixtures.” Master's thesis, Technical University of Darmstadt, Darmstadt, Germany.
- ↵Pasaniuc B, Price AL. 2016. Dissecting the genetics of complex traits using summary association statistics. Nat Rev Genet 18: 117–127. 10.1038/nrg.2016.142
- ↵Popejoy AB, Fullerton SM. 2016. Genomics is failing on diversity. Nature 538: 161–164. 10.1038/538161a
- ↵Schaid DJ, Chen W, Larson NB. 2018. From genome-wide associations to candidate causal variants by statistical fine-mapping. Nature Reviews Genetics 19: 491–504. 10.1038/s41576-018-0016-z
- ↵Sethuraman J. 1994. A constructive definition of Dirichlet priors. Stat Sin 4: 639–650. https://www.jstor.org/stable/24305538
- ↵Sirugo G, Williams SM, Tishkoff SA. 2019. The missing diversity in human genetic studies. Cell 177: 26–31. 10.1016/j.cell.2019.02.048
- ↵Sollis E, Mosaku A, Abid A, Buniello A, Cerezo M, Gil L, Groza T, Güneş O, Hall P, Hayhurst J, 2022. The NHGRI-EBI GWAS catalog: knowledgebase and deposition resource. Nucleic Acids Res 51: D977–D985. 10.1093/nar/gkac1010
- ↵Solovieff N, Cotsapas C, Lee PH, Purcell SM, Smoller JW. 2013. Pleiotropy in complex traits: challenges and strategies. Nat Rev Genet 14: 483–495. 10.1038/nrg3461
- ↵Spain SL, Barrett JC. 2015. Strategies for fine-mapping complex traits. Hum Mol Genet 24: R111–R119. 10.1093/hmg/ddv260
- ↵Speed D, Hemani G, Johnson MR, Balding DJ. 2012. Improved heritability estimation from genome-wide SNPs. Am J Hum Genet 91: 1011–1021. 10.1016/j.ajhg.2012.10.010
- ↵Speed D, Cai N, UCLEB Consortium, Johnson MR, Nejentsev S, Balding DJ. 2017. Reevaluation of SNP heritability in complex human traits. Nat Genet 49: 986–992. 10.1038/ng.3865
- ↵Stearns FW. 2010. One hundred years of pleiotropy: a retrospective. Genetics 186: 767–773. 10.1534/genetics.110.122549
- ↵Stephens M. 2016. False discovery rates: a new deal. Biostatistics 18: 275–294. 10.1093/biostatistics/kxw041
- ↵Sudlow C, Gallacher J, Allen N, Beral V, Burton P, Danesh J, Downey P, Elliott P, Green J, Landray M, 2015. UK biobank: an open access resource for identifying the causes of a wide range of complex diseases of middle and old age. PLoS Med 12: e1001779. 10.1371/journal.pmed.1001779
- ↵Svishcheva GR, Belonogova NM, Zorkoltseva IV, Kirichenko AV, Axenovich TI. 2019. Gene-based association tests using GWAS summary statistics. Bioinformatics 35: 3701–3708. 10.1093/bioinformatics/btz172
- ↵Thompson WK, Wang Y, Schork AJ, Witoelar A, Zuber V, Xu S, Werge T, Holland D, Andreassen OA, Dale AM. 2015. An empirical Bayes mixture model for effect size distributions in genome-wide association studies. PLoS Genet 11: e1005717. 10.1371/journal.pgen.1005717
- ↵Turley P, Walters RK, Maghzian O, Okbay A, Lee JJ, Fontana MA, Nguyen-Viet TA, Wedow R, Zacher M, Furlotte NA, 2018. Multi-trait analysis of genome-wide association summary statistics using MTAG. Nat Genet 50: 229–237. 10.1038/s41588-017-0009-4
- ↵Uffelmann E, Huang QQ, Munung NS, de Vries J, Okada Y, Martin AR, Martin HC, Lappalainen T, Posthuma D. 2021. Genome-wide association studies. Nat Rev Methods Primers 1: 59. 10.1038/s43586-021-00056-9
- ↵Urbut SM, Wang G, Carbonetto P, Stephens M. 2018. Flexible statistical methods for estimating and testing effects in genomic studies with multiple conditions. Nat Genet 51: 187–195. 10.1038/s41588-018-0268-8
- ↵Visscher PM, Wray NR, Zhang Q, Sklar P, McCarthy MI, Brown MA, Yang J. 2017. 10 years of GWAS discovery: biology, function, and translation. Am J Hum Genet 101: 5–22. 10.1016/j.ajhg.2017.06.005
- ↵Visscher PM, Yengo L, Cox NJ, Wray NR. 2021. Discovery and implications of polygenicity of common diseases. Science 373: 1468–1473. 10.1126/science.abi8206
- ↵Wagner GP, Zhang J. 2011. The pleiotropic structure of the genotype–phenotype map: the evolvability of complex organisms. Nat Rev Genet 12: 204–213. 10.1038/nrg2949
- ↵Wainwright MJ, Jordan MI. 2008. Graphical models, exponential families, and variational inference. Found Trends Mach Learn 1: 1–305. 10.1561/2200000001
- ↵Wang G, Sarkar A, Carbonetto P, Stephens M. 2020. A simple new approach to variable selection in regression, with application to genetic fine mapping. J R Stat Soc Series B Stat Methodol 82: 1273–1300. 10.1111/rssb.12388
- ↵Wu TT, Chen YF, Hastie T, Sobel E, Lange K. 2009. Genome-wide association analysis by Lasso penalized logistic regression. Bioinformatics 25: 714–721. 10.1093/bioinformatics/btp041
- ↵Yang Z, Wang C, Liu L, Khan A, Lee A, Vardarajan B, Mayeux R, Kiryluk K, Ionita-Laza I. 2023. CARMA is a new Bayesian model for fine-mapping in genome-wide association meta-analyses. Nat Genet 55: 1057–1065. 10.1038/s41588-023-01392-0
- ↵Zhang Y, Qi G, Park JH, Chatterjee N. 2018. Estimation of complex effect-size distributions using summary-level statistics from genome-wide association studies across 32 complex traits. Nat Genet 50: 1318–1326. 10.1038/s41588-018-0193-x
- ↵Zhao Y, Zhu H, Lu Z, Knickmeyer RC, Zou F. 2019. Structured genome-wide association studies with Bayesian hierarchical variable selection. Genetics 212: 397–415. 10.1534/genetics.119.301906
- ↵Zhou X, Carbonetto P, Stephens M. 2013. Polygenic modeling with Bayesian sparse linear mixed models. PLoS Genet 9: e1003264. 10.1371/journal.pgen.1003264
- ↵Zhu X, Stephens M. 2017. Bayesian large-scale multiple regression with summary statistics from genome-wide association studies. Ann Appl Stat 11: 1561–1592. 10.1214/17-aoas1046
- ↵Zou H, Hastie T. 2005. Regularization and variable selection via the elastic net. J R Stat Soc Ser B: Stat Methodol 67: 301–320. 10.1111/j.1467-9868.2005.00503.x
- ↵Zou Y, Carbonetto P, Wang G, Stephens M. 2022. Fine-mapping from summary data with the “sum of single effects” model. PLoS Genet 18: e1010299. 10.1371/journal.pgen.1010299