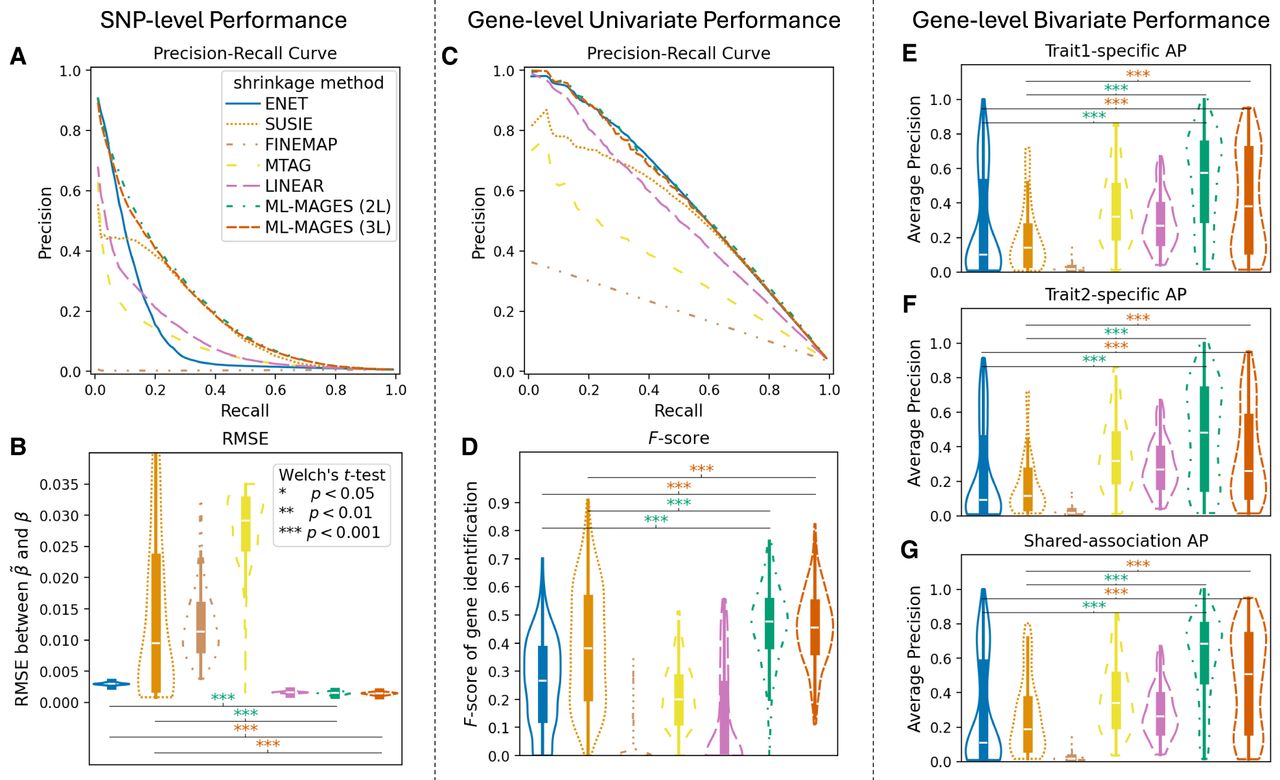
Our methods ML-MAGES 2L and 3L outperform other methods in effect size shrinkage in simulation analysis. (Left) SNP-level performance: comparing the regularized effects and the true effects of each simulation. (Center) Gene-level univariate performance: comparing univariate enrichment test with the simulated ground truth. (Right) Gene-level bivariate performance: comparing aggregated effect at the gene level based on bivariate association clustering output with the simulated ground truth. Legends shown in A apply to all panels; violin plots are ordered from left to right as Enet, SuSiE, FINEMAP, MTAG, LINEAR, ML-MAGES 2L, and 3L. Violin plots are labeled with the significance level of Welch's t-test for difference between our methods and Enet and SuSiE, as shown in the legends of B. (A) Precision-recall curve (PRC) averaged across all 200 simulations (by interpolation), in which the positives are the true nonzero effects and the precision-recall pairs are obtained by thresholding . (B) RMSE between β and . (C) PRC averaged across all 200 simulations (by interpolation), in which the true positives are the truly associated genes and the precision-recall pairs are obtained by thresholding negative log of P-values from enrichment tests. (D) F-score of identifying associated genes, where genes with an FDR-adjusted P < 0.05 from the enrichment test is identified as associated. (E,F) Trait-specific average precision (AP) for identifying genes with trait-specific association to simulated traits 1 and 2, when ranking genes by the sum of absolute effects of variants in trait-specific clusters and comparing against genes being truly trait-specific. (G) AP for identifying genes associated to both traits, when ranking genes by the sum of absolute effects of variants in clusters of shared association and comparing against genes being truly associated to both traits.