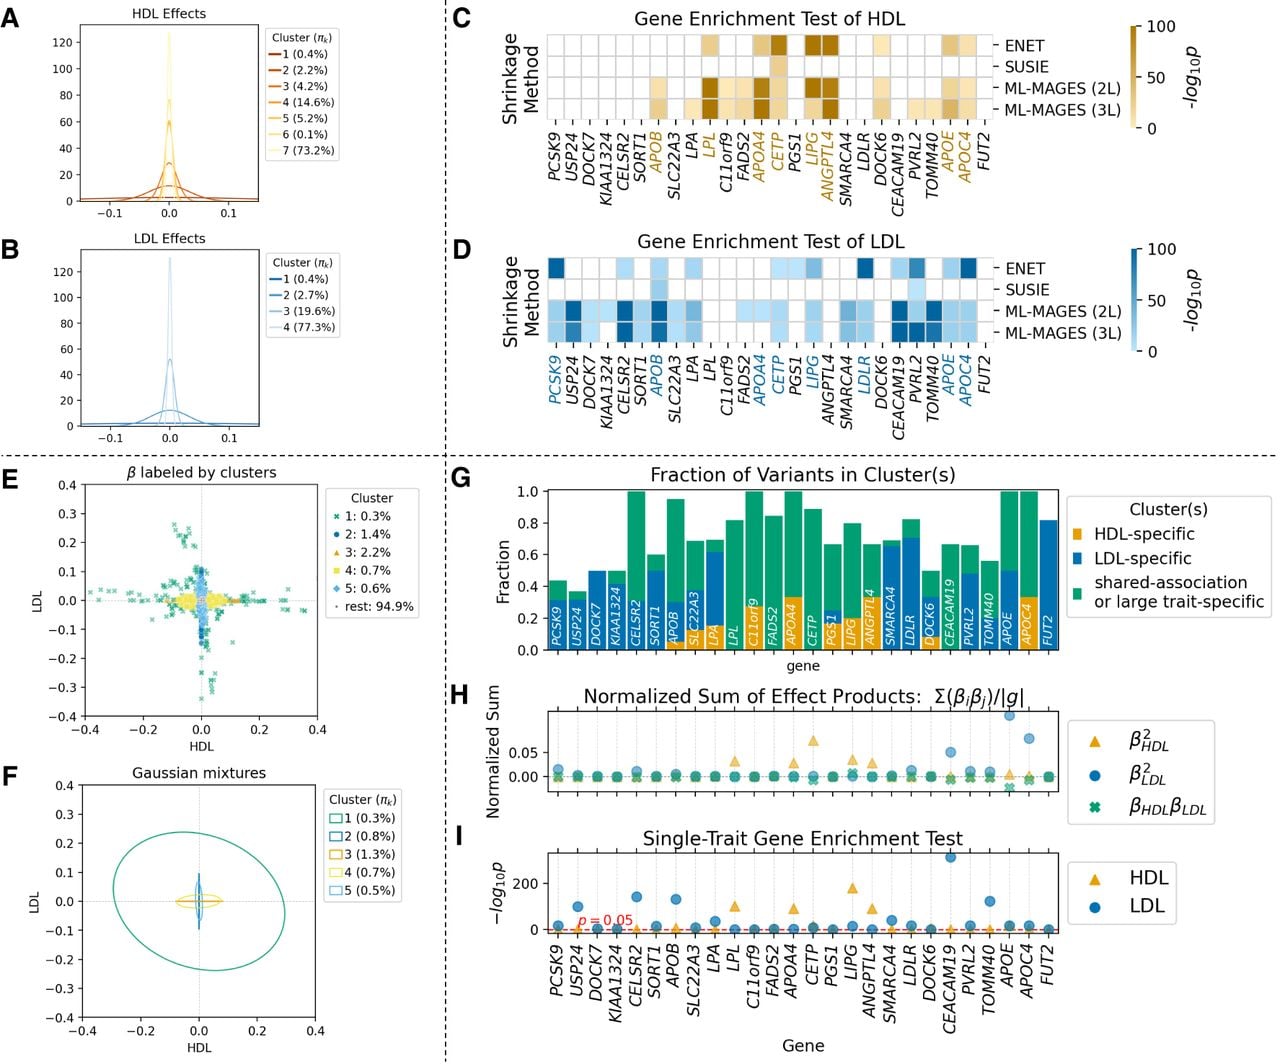
ML-MAGES identifies known genes with shared and trait-specific associations for high-density lipoprotein cholesterol (HDL) and low-density lipoprotein cholesterol (LDL) in the UK Biobank. We analyzed GWA of two traits: HDL and LDL. Panels C and D include results from four methods (Enet, SuSiE, and ML-MAGES 2L and 3L). For the other panels, only ML-MAGES 2L results are shown. (A,B) The univariate clustering on GWA effects of HDL and LDL. Clusters are represented by the inferred Gaussian , labeled with their inferred mixing weights πk. (C,D) The −log10(P) value from gene enrichment tests of HDL and LDL for a list of genes found significant by the test for either of the two traits. Darker color indicates higher statistical significance, and nonsignificant genes with adjusted P ≥ 0.05 are left blank. Associated genes that have related biological processes terms in the GO database (Ashburner et al. 2000) have colored labels. Unlike the other three methods, SuSiE shrinkage fails to identify some most relevant genes. (E) Variants plotted by their regularized effects on HDL and LDL, with color and style denoting their cluster assignment from association clustering. Clusters are ordered in descending Tr(Σk). The proportion of variants with nonzero effects in each cluster is labeled in the legend. Clusters beyond those listed are categorized as nonprioritized associations and grouped into the “rest.” (F) Inferred mixtures from bivariate clustering, shown as covariance (Σk) ellipses from Gaussian mixtures, with inferred mixing weights πk labeled in the legend. (G) The fraction of variants assigned to each of the genes listed in panels C and D that belong to each type of association clusters. (H) Normalized sum of squared effects or sum of effect products of variants in each gene, calculated as , where g denotes the set of variants assigned to a gene with variants indexed by i, and p1 and p2 index the two traits. Three sums are considered: two trait-specific sums of squared effects and the sum of effect products for shared associations. (I) −log10(P) of single-trait enrichment test for each of the two traits, corresponding to the color-coded values in third rows of panels C and D.