
A scalable adaptive quadratic kernel method for interpretable epistasis analysis in complex traits
- 1Department of Computer Science, University of California, Los Angeles, Los Angeles, California 90095, USA;
- 2Semel Institute for Neuroscience and Human Behavior, University of California, Los Angeles, Los Angeles, California 90024, USA;
- 3Department of Human Genetics, David Geffen School of Medicine, University of California, Los Angeles, Los Angeles, California 90095, USA;
- 4Department of Computational Medicine, David Geffen School of Medicine, University of California, Los Angeles, Los Angeles, California 90095, USA
-
↵5 These authors contributed equally to this work.
Abstract
Our knowledge of the contribution of genetic interactions (epistasis) to variation in human complex traits remains limited, partly due to the lack of efficient, powerful, and interpretable algorithms to detect interactions. Recently proposed approaches for set-based association tests show promise in improving the power to detect epistasis by examining the aggregated effects of multiple variants. Nevertheless, these methods either do not scale to large Biobank data sets or lack interpretability. We propose QuadKAST, a scalable algorithm focused on testing pairwise interaction effects (quadratic effects) within small to medium-sized sets of genetic variants (window size ≤100) on a trait and provide quantified interpretation of these effects. Comprehensive simulations show that QuadKAST is well-calibrated. Additionally, QuadKAST is highly sensitive in detecting loci with epistatic signals and accurate in its estimation of quadratic effects. We applied QuadKAST to 52 quantitative phenotypes measured in ≈300,000 unrelated white British individuals in the UK Biobank to test for quadratic effects within each of 9515 protein-coding genes. We detect 32 trait-gene pairs across 17 traits and 29 genes that demonstrate statistically significant signals of quadratic effects (accounting for the number of genes and traits tested). Across these trait-gene pairs, the proportion of trait variance explained by quadratic effects is comparable to additive effects, with five pairs having a ratio >1. Our method enables the detailed investigation of epistasis on a large scale, offering new insights into its role and importance.
Genome-wide association studies (GWAS) have revolutionized the field of human genetics by providing valuable insights into the genetic basis of complex traits and diseases (The Wellcome Trust Case Control Consortium 2007; Weedon et al. 2008; Lambert et al. 2013; Schizophrenia Working Group of the Psychiatric Genomics Consortium 2014; Visscher et al. 2017; Abdellaoui et al. 2023). The primary goal of GWAS is to identify statistically significant associations between specific genetic variants and traits. These associations typically test for a linear additive relationship between genetic variant and trait due to their simplicity and interpretability. Recent studies, however, indicate that interaction effects between genes or genetic variants that go beyond mere additivity can play an overlooked role in shaping complex traits (Sheppard et al. 2021; Fu et al. 2023; Stamp et al. 2023; Tang et al. 2023; Mackay and Anholt 2024; Smith et al. 2024). Such interactions have been proposed as key factors in both human complex trait variation and disease susceptibility (Thornton-Wells et al. 2006). Epistasis also potentially accounts for some of the “missing heritability” not explained by additive genetic factors alone (Eichler et al. 2010; Singhal et al. 2023). Having an efficient way of identifying and understanding epistasis could greatly advance our understanding of underlying biological pathways (Bagheri-Chaichian et al. 2003; Phenix et al. 2011) and can potentially increase the generalizability of polygenic scores within (Mostafavi et al. 2020) and across different ancestral populations (Martin et al. 2017, 2019). Despite its likely importance, efficient methods for detecting, quantifying, and interpreting epistatic interactions remain largely underdeveloped. As a result, our knowledge of the role of epistasis remains limited (Carlborg and Haley 2004).
Despite its hypothesized importance, characterizing the role of epistasis in complex traits presents several challenges. The task of examining all potential interactive relationships among single nucleotide polymorphisms (SNPs) and genes necessitates navigating a large feature space that expands exponentially with the increasing order of interactions. A number of methods have been developed to search (Wan et al. 2010; Hemani et al. 2011; Prabhu and Pe'er 2012) for pairs of genetic variants that show evidence for epistatic effects from a large combinatorial space. However, such approaches have low statistical power due to the stringent thresholds needed to account for the number of tests performed. As a result, successful detection of epistasis requires examining a large number of individuals to obtain adequate power.
An alternative approach to identify trait-relevant genetic variants focuses on grouping variants into “sets” and jointly estimating the effects of all variants within each set (Neale et al. 2011; Wu et al. 2011; Lee et al. 2012; Lippert et al. 2014). By reducing the number of statistical tests performed and hence the multiple testing burden, these methods can obtain increased power over approaches that aim to identify individual variants. Existing set-based tests have shown their efficacy for detecting associations between complex traits and sets of rare as well as common variants (Lunetta et al. 2015; Cirulli et al. 2020; Li et al. 2020). However, these approaches, although largely scalable, focus primarily on testing the additive effect of variants within a set. None of the existing set-based testing approaches (Wu et al. 2011; Lippert et al. 2014) can test epistatic effects in large-scale biobanks.
One approach to test for nonlinear effects of a set of genetic variants relies on the “kernel trick” that enables implicit computation of the inner product of potentially high-dimensional nonlinear transformations of the input genotypes. However, the computational burden involved in operating on the kernel matrix makes these approaches infeasible for large-scale data. Although a recent work, FastKAST, has ameliorated the computational challenge by employing kernel approximations (Rahimi and Recht 2007; Fu et al. 2023), FastKAST is limited in the types of nonlinear relationships that can be modeled (e.g., those that can be represented by radial basis function kernels). Thus, FastKAST cannot be applied to quadratic and polynomial kernels and hence lacks the interpretability associated with testing for pairwise interactions among SNPs. Overall, we lack efficient yet interpretable methods to identify and quantify the epistasis effects within sets of genetic variants.
We propose a novel algorithm, Quadratic Kernel-based ASsociation Test (QuadKAST), to address the major limitations of existing set-based association test approaches. Unlike existing approaches, QuadKAST aims to test for the effect of pairwise genetic interactions (quadratic effects), which complements the existing epistasis analysis and offers several advantages. First, a test of quadratic effects offers an interpretable (and the simplest) model of epistasis. Second, beyond tests of epistasis, QuadKAST quantifies the proportion of phenotypic variance explained by quadratic effects (quadratic variance component). Finally, QuadKAST leverages the estimated statistics from previous steps and computes posterior estimates of the effect sizes associated with pairs of interactions within a set allowing us to interpret the epistatic signal. Overall, QuadKAST aims to test, quantify, and interpret the set-based epistasis effect in an integrated and scalable manner. We perform comprehensive simulations to evaluate the calibration, power, and scalability of QuadKAST. We then applied QuadKAST to 52 quantitative phenotypes measured in ≈300, 000 unrelated white British individuals in the UK Biobank (UKB) to test for quadratic effects within each of 9515 protein-coding genes.
Methods
Set-based association testing of linear additive genetic effects
Consider a N × M matrix representing the standardized genotypes of N individuals at M SNPs:  where gn, n ∈ {1, …, N} is the vector of genotypes at M SNPs for a specific individual n. Let y ∈ ℝN represent the phenotypes across N individuals and X represents an N × K matrix of covariates.
In the context of set-based association testing, the matrix G is typically constructed by aggregating variants within a genomic region while matrix X incorporates factors such as sex, age, and genetic principal components (PCs) to account for population structure. The objective
of set-based association testing is to ascertain whether the variants within the defined set exhibit, in aggregate, association
with the trait y where the association is typically assumed to be linear and additive. Formally, we assume that each of the M SNPs within the set independently and additively contributes to the trait with effect sizes drawn from a normal distribution
resulting in the following model.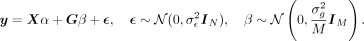 (1)
Here
(1)
Here  denotes the residual or noise variance whereas
  represents the proportion of phenotypic variance explained by additive genetic effects at the SNPs considered. α denotes the fixed effects associated with the covariates. The objective of set-based association testing is formulated as
a test of the hypothesis
represents the proportion of phenotypic variance explained by additive genetic effects at the SNPs considered. α denotes the fixed effects associated with the covariates. The objective of set-based association testing is formulated as
a test of the hypothesis  (Lippert et al. 2011; Wu et al. 2011).
Quadratic association test
Beyond a linear additive relationship, the genetic variants within a set may modulate the trait through their interactions
with each other. We can expand upon the model in Equation 1 to include nonlinear associations between G and y through the use of a feature map ϕ: ℝM → ℝD. This map transforms the vector of genotypes at M SNPs into a D-dimensional vector. Although the feature map ϕ could represent an arbitrary nonlinear function, considerations of interpretability lead us to restrict ϕ to functions that capture pairwise interactions across the M SNPs (quadratic feature maps). We can define two such quadratic feature maps depending on whether we allow for self-interactions
at a SNP: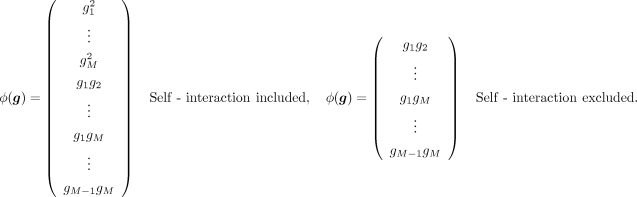 We now model the aggregate effect of pairwise genetic interactions on the phenotype, termed quadratic effects, as:
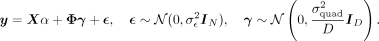 (2)
Here
(2)
Here 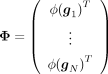 whereas γ ∈ ℝD is a random vector of effects associated with each pairwise interaction.
  represents the variance attributed to all pairwise effects or quadratic effects across the set of SNPs (quadratic variance component). Integrating out the random effects γ, the distribution of y follows
 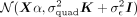 . Here K is a N × N kernel matrix where Ki,j = ϕ(gi)Tϕ(gj)/D so that
  . To ensure that this model is sensitive to nonadditive genetic effects, we include additive genetic effects (represented
by the matrix G) within X (effectively regressing out their contribution to the phenotype).
. To ensure that this model is sensitive to nonadditive genetic effects, we include additive genetic effects (represented
by the matrix G) within X (effectively regressing out their contribution to the phenotype).
In this model, we aim to answer two primary questions. First, we would like to test whether the phenotypic value is associated
with the aggregate pairwise interaction effects across SNPs within the set of interest (described by Φ); that is, we aim to
test the hypothesis  . Second, if
  is nonzero, we would like to estimate the quadratic variance component parameter
  . Importantly, we would like to develop procedures for hypothesis testing and variance component estimation that can be applied
to large-scale biobanks where the number of individuals N is large (of the order of hundreds of thousands).
. Importantly, we would like to develop procedures for hypothesis testing and variance component estimation that can be applied
to large-scale biobanks where the number of individuals N is large (of the order of hundreds of thousands).
Hypothesis test
The hypothesis of interest is whether the variance explained by the pairwise interaction effects of the target set of variants,
conditioning on the additive effects at these variants and other covariates, is zero. This hypothesis implies that the parameter
 . Previous work has shown that including the genetic variants in the window surrounding the target set as fixed-effect covariates
ensures that the additive effects are residualized from the phenotype (Fu et al. 2023). We, therefore, adopt this strategy in our work. To test the hypothesis that
. Previous work has shown that including the genetic variants in the window surrounding the target set as fixed-effect covariates
ensures that the additive effects are residualized from the phenotype (Fu et al. 2023). We, therefore, adopt this strategy in our work. To test the hypothesis that  , we define the score test statistic:
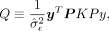 where
where  ,
,  , and P = (I − X(XTX)−1XT) are the projection matrix with X as the covariates matrix. See Supplemental Note S1.1 for derivation of the score test statistic. Under the null hypothesis, previous work (Fu et al. 2023) has shown that the distribution of the score test statistic is
 where λi is the ith eigenvalue of PKP, S is the rank of PKP, and
  is the independent χ2 1-df random variables. However, the construction of K and the eigen-decomposition of PKP scales as
  and
and  which does not scale to data sets with a large number of individuals (N).
To overcome this bottleneck, we first compute the singular value decomposition (SVD) of PΦ so that the eigenvalue λi can be computed from the corresponding singular values. The singular values of PΦ can be computed in  time (for D < N) leading to an efficient algorithm for large numbers of individuals provided the number of SNPs in the set is not too large
(because
time (for D < N) leading to an efficient algorithm for large numbers of individuals provided the number of SNPs in the set is not too large
(because  ).
).
Variance component estimation
No covariates
Let us first consider the setting where there are no covariates included in the model. The distribution of the phenotype can
be written as: The variance components
  can be estimated by maximizing the log-likelihood:
 It can be shown that the likelihood can be maximized by maximizing the profile log-likelihood function obtained by maximizing
or profiling out
It can be shown that the likelihood can be maximized by maximizing the profile log-likelihood function obtained by maximizing
or profiling out  from the log-likelihood and writing it in terms of
  (Supplemental Note S1.2):
 (3)
However, naively evaluating and optimizing the profile log-likelihood function involves an iterative algorithm with
(3)
However, naively evaluating and optimizing the profile log-likelihood function involves an iterative algorithm with  time complexity in each iteration rendering this approach impractical when the number of individuals increases.
Given the eigen-decomposition of K = Udiag(ρ1, …, ρN)UT where U ∈ ℝN×N is the matrix of eigenvectors and (ρ1, …, ρN) are the eigenvalues of K, Equation 3 can be rewritten as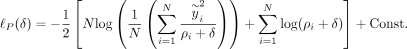 (4)
Here
(4)
Here  is the ith entry of
  . With this transformed representation, the profile log-likelihood function can be optimized with
  time complexity in each iteration once the eigen-decomposition of K and the transformed phenotype
  have been computed.
In our application, the matrix  for Φ ∈ ℝN×D where
 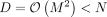 . As a result, the rank (R) of K is lower than its dimensionality. This allows us to further rewrite the profile log-likelihood as:
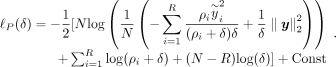 (5)
Evaluating
(5)
Evaluating  in this setting requires computing
  and ρi, i ≤ R which can be obtained by a one-time computation of the R nonzero eigenvalues and corresponding eigenvectors of K. The computation of these eigenvalues and eigenvectors can be obtained in
  time from the SVD of Φ. Subsequently, the evaluation of
  requires
  time (see Supplemental Note S1.2). We used the built-in SciPy (Virtanen et al. 2020) package “Nelder–Mead” algorithm (Gao and Han 2012) for the optimization.
Including covariates
When covariates are incorporated into the model, the phenotypic distribution can be expressed as In this setting, the profile-restricted log-likelihood function can be computed efficiently when K is low-rank (Supplemental Note S1.3):
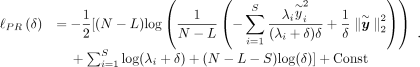 (6)
Here
(6)
Here  is the ith entry of the transformed phenotype:
  where B is the matrix of eigenvectors of PKP with S nonzero eigenvalues λ1, λ2, …, λS. To compute
  , we need to compute eigenvectors (columns of B) corresponding to the nonzero eigenvalues of PKP which is equivalent to the corresponding left singular vectors of PΦ. Finally, ρi, i ∈ {1, …, S} are the nonzero eigenvalues of PKP which are also obtained from the corresponding singular values of PΦ. Both these quantities can be obtained in
  time, where K is the column number of X. Thus, the profile-restricted log-likelihood as represented in Supplemental Proof S1.3.1, Equation 18 can be optimized with a
  one-time computation followed by
  time to evaluate this function subsequently.
Standard error estimation
Having obtained estimates of the variance components ( and
and  ), we can compute the corresponding standard error using the observed Fisher information matrix evaluated at the maximum likelihood
estimates (MLE) or the maximum restricted likelihood (REML) estimates.
), we can compute the corresponding standard error using the observed Fisher information matrix evaluated at the maximum likelihood
estimates (MLE) or the maximum restricted likelihood (REML) estimates.
Results
Data sets
We obtained a set of N = 291,273 unrelated white British individuals measured at M = 459,792 common SNPs genotyped on the UKB Axiom array (by extracting individuals that are greater than third-degree relatives and excluding individuals with putative sex chromosome aneuploidy). Unless otherwise specified, all simulations and real data analyses were conducted using this data set. We analyzed sets consisting of protein-coding genes restricted to genes with the number of array SNPs ≥3 and ≤50 resulting in 9515 sets. We selected 52 quantitative traits that have been analyzed in prior studies of nonlinear genetic effects (Pazokitoroudi et al. 2021; Fu et al. 2023; see Supplemental Table S1). All traits were transformed using inverse rank-normalization. We included sex, age, and the top 20 genetic PCs as covariates in all our analyses. We used PCs computed in the UKB from a superset of 488, 295 individuals. Extra covariates were added for diastolic/systolic blood pressure (adjusted for cholesterol-lowering medication, blood pressure medication, insulin, hormone replacement therapy, and oral contraceptives) and waist-to-hip ratio (adjusted for BMI).
Calibration of QuadKAST
We assessed the type-I error rate of QuadKAST in simulations. We simulated phenotypes based on UKB array SNPs and a subset of unrelated white British individuals (N = 50 K individuals, M = 459,792 SNPs). We performed simulations under four genetic architectures with additive but no interaction effects: infinitesimal model (ratio of causal variants = 1) and noninfinitesimal models (ratio of causal variants = 0.001) each having a different range of minor allele frequency (MAF) for the causal variants: [0.01, 0.05] (RARE), [0.05, 0.5] (COMMON), [0, 0.5] (ALL). In all settings, we fixed the additive heritability at 0.5. We applied QuadKAST on sets of SNPs typed on the UKB array where each set is one of 9515 protein-coding genes.
We observed that QuadKAST is well-calibrated across all the simulation settings (Fig. 1A). QuadKAST provides a flexible choice of the quadratic kernel that is used to test for interactions. The default quadratic kernel function encodes all pairwise interactions within a set (allowing for the inclusion or exclusion of self-interactions). We additionally confirmed the calibration of QuadKAST when the quadratic kernel function employed includes or excludes self-interactions (Supplemental Fig. S2). Finally, using a large number of tests on one exemplar genetic architecture (ALL, Causal ratio = 0.001), we confirmed the calibration of QuadKAST for low P-value thresholds that are relevant for genome-wide testing (α = 1 × 10⁻⁶) (Supplemental Tables S2, S3).
Overview of QuadKAST. (A) Calibration analysis. We applied QuadKAST to SNPs within 9515 protein-coding genes for four genetic architectures that consist entirely of linear
additive effects (N = 50 K individuals, UKB array data). (B) Power analysis. We simulated traits with varying quadratic variance component on a randomly selected subset of 5 K individuals from unrelated
white British individuals in UKB. We applied QuadKAST to 1000 randomly selected protein-coding genes and defined power as
the ratio of P-values reported by QuadKAST that pass the significance threshold α. In these experiments,  is equal to the quadratic heritability
  . (C) Accuracy. Similar to B, we applied QuadKAST to estimate the quadratic variance component at each gene. (D) Runtime. We evaluated the runtimes of the quadratic kernel option in SKAT (SKAT_QUAD) and QuadKAST by fixing the number of SNPs M = 100 and varying the number of individuals (average runtime across 10 replicates).
Power analysis of QuadKAST
Our next set of experiments sought to evaluate the power of QuadKAST. Specifically, our generative model is
In these settings, the self-interactions contribute to the phenotypic variance. We varied  and for each parameter setting, we randomly selected 1000 sets from the set of 9515 protein-coding genes and a random set
of 5K unrelated, white British individuals. We applied QuadKAST to test
and for each parameter setting, we randomly selected 1000 sets from the set of 9515 protein-coding genes and a random set
of 5K unrelated, white British individuals. We applied QuadKAST to test  in each of these sets with power computed as the fraction of sets for which the P-value reported by QuadKAST passed the significance threshold α. QuadKAST achieves adequate power (≥0.8) at a significance
threshold
in each of these sets with power computed as the fraction of sets for which the P-value reported by QuadKAST passed the significance threshold α. QuadKAST achieves adequate power (≥0.8) at a significance
threshold  (corresponding to a Bonferroni threshold applied to test the set of 9515 protein-coding genes) when the quadratic heritability
 (Fig. 1B). We also assessed the power of QuadKAST with and without the inclusion of self-interactions to find that QuadKAST is powerful
in both scenarios (Supplementary Fig. S6).
(Fig. 1B). We also assessed the power of QuadKAST with and without the inclusion of self-interactions to find that QuadKAST is powerful
in both scenarios (Supplementary Fig. S6).
Accuracy of QuadKAST variance component estimation
Beyond statistical power, we aimed to test the accuracy of the variance component estimates obtained by QuadKAST using the same simulation setup as in power analysis. QuadKAST can accurately estimate the quadratic variance component (Fig. 1C; Supplemental Fig. S4) with and without the inclusion of self-interactions (Supplemental Fig. S5).
Computational efficiency of QuadKAST
Finally, we compared the runtime of QuadKAST and the quadratic kernel option (SKAT_QUAD) in the popular SKAT software (v.2.2.5; https://CRAN.R-project.org/package=SKAT). We selected a set size of 100 SNPs considering both computational efficiency and empirical observations. Specifically, ∼94% of genes contain ≤50 SNPs genotyped on the UKB array, whereas ∼98% contain ≤100 SNPs. In imputed data, ∼58% of genes contain ≤50 SNPs, and ∼75% contain ≤100 SNPs (Supplemental Fig. S1).
We then varied the number of individuals and profiled the runtime and memory usage of QuadKAST and SKAT_QUAD (with a predefined limit of 4 h for the runtime). While the average runtime of QuadKAST on a single set is <5 min for UK Biobank size data (∼300K), SKAT_QUAD reaches the time limit when N ≥ 100K (Fig. 1D). Running SKAT_QUAD on UK Biobank size data would require more than 10 h, not to mention the memory consumption of constructing the kernel matrix (Supplemental Fig. S7A,B; Supplemental Table S4). Based on these experiments, it is evident that running SKAT_QUAD on UK Biobank scale data would be infeasible due to computational and memory limitations, while QuadKAST is about 100× faster. We also tested the scalability of QuadKAST by varying the number of SNPs while keeping the number of individuals fixed at N = 50K (Supplemental Fig. S7C; Supplemental Table S5). QuadKAST is efficient when the number of SNPs M ≤ 200, which makes it feasible for array SNPs (Supplemental Fig. S1A). For larger sets of SNPs that might be encountered in the analysis of imputed genotypes (Supplemental Fig. S1B) or whole-exome sequencing data, we recommend partitioning the set into smaller chunks before applying QuadKAST.
Application of QuadKAST to UK Biobank phenotypes
After confirming the calibration and power of QuadKAST, we applied it to 52 quantitative traits in UKB measured across N = 291,273 unrelated white British individuals and to SNPs on the UKB array grouped into sets defined by 9515 genes (see Data sets section for more details on the data preparation). Before testing for interaction across variants within each gene, we first regressed out the additive effect of SNPs around the target gene (this includes SNPs within the target gene and in the region surrounding the target gene which is two times larger than the length of the target gene) together with covariates that include 20 genotype PCs, age, and sex. To account for SNPs in high linkage disequilibrium (LD), we transformed the matrix of additive genotypes using an SVD before running linear regression. We included the self-interaction of each variant when testing the quadratic effect (unless mentioned otherwise).
With this strategy, we identified 32 trait-gene pairs to be statistically significant  across 17 quantitative traits after accounting for the total genes and traits tested (Table 1). All of these trait-gene pairs are significant (or near significant) for additive genetic effects (Monocyte count-ADA2 with P = 6.6 × 10⁻⁵ being the only trait-gene pair that does not pass the threshold for significance). Several of the associated loci such as
those within LPA (Zeng et al. 2022) and SLC2A9 (Wei et al. 2014) have been implicated to harbor local epistatic effects in previous studies.
across 17 quantitative traits after accounting for the total genes and traits tested (Table 1). All of these trait-gene pairs are significant (or near significant) for additive genetic effects (Monocyte count-ADA2 with P = 6.6 × 10⁻⁵ being the only trait-gene pair that does not pass the threshold for significance). Several of the associated loci such as
those within LPA (Zeng et al. 2022) and SLC2A9 (Wei et al. 2014) have been implicated to harbor local epistatic effects in previous studies.
Significant epistatic trait-gene pairs
We estimated the quadratic variance component across all 32 significant trait-gene pairs to observe that the median ratio
of quadratic to additive variance components  is 0.15 (Supplemental Table S6). The influence of the epistatic effect is greater than the additive effect for five trait-gene pairs. For instance, the
variance component ratio attributed to the quadratic effect is more than 20 times higher than that of the additive effect
for the PRG3 gene on Eosinophil count. We note that quadratic effects within the LPA gene explain a substantial proportion of variation in lipoprotein(a) (
is 0.15 (Supplemental Table S6). The influence of the epistatic effect is greater than the additive effect for five trait-gene pairs. For instance, the
variance component ratio attributed to the quadratic effect is more than 20 times higher than that of the additive effect
for the PRG3 gene on Eosinophil count. We note that quadratic effects within the LPA gene explain a substantial proportion of variation in lipoprotein(a) ( ). Together with additive effects, quadratic effects at the LPA gene explain about 72% of trait variation, which is notable in light of the LPA locus having been shown to explain about 90% of trait variance (Boerwinkle et al. 1992) (our analysis does not account for isoform size which is known to explain 40%–70% of lipoprotein(a) variance [Coassin and Kronenberg 2022]). These results suggest that genetic predictors that include pairwise interaction effects at these genes can increase prediction
accuracy for the corresponding traits relative to genetic predictors that are based on additive effects.
). Together with additive effects, quadratic effects at the LPA gene explain about 72% of trait variation, which is notable in light of the LPA locus having been shown to explain about 90% of trait variance (Boerwinkle et al. 1992) (our analysis does not account for isoform size which is known to explain 40%–70% of lipoprotein(a) variance [Coassin and Kronenberg 2022]). These results suggest that genetic predictors that include pairwise interaction effects at these genes can increase prediction
accuracy for the corresponding traits relative to genetic predictors that are based on additive effects.
In the subsequent sections, we explored the robustness of our results. Specifically, we assessed the stability of our results to population stratification and possibility that causal variants may not be typed in the array data. Further, we investigate the contribution of individual interactions to the overall signal of epistasis.
Robustness to population structure and imperfectly tagged causal SNPs
Population stratification can increase the false positive rate in GWAS and is commonly accounted for by including PCs computed from genotype data as covariates in the analysis (Price et al. 2006, 2010). A concern is that this approach might not adequately correct for the confounding effects of population stratification on tests of epistasis effects. To explore the effect of population stratification, we reran our analyses on trait-gene pairs previously discovered as significant with the number of PCs included as covariates increased to 40 (from 20). We observe a high correlation in the −log10 P-values and in the variance component estimates when using 40 versus 20 PCs (Fig. 2A) (Spearman's correlation ρ ≈ 1), indicating that our findings are robust to population stratification.
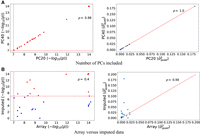
Robustness analysis. We report the Spearman's correlation (ρ) between estimators of  obtained by QuadKAST under different scenarios. (A) We report the correlation of the negative log10 P-values and the estimates of
  for all the significant epistatic trait-gene pairs when we include the top 20 PCs (default choice) versus the top 40 PCs
into the set of covariates. (B) We report the correlation of the P-values and the variance component estimates between the array data set and the imputed data set where the imputed data set
contains 4,824,392 SNPs whereas the array data set contains 459,792 SNPs. For ease of visualization,
for all the significant epistatic trait-gene pairs when we include the top 20 PCs (default choice) versus the top 40 PCs
into the set of covariates. (B) We report the correlation of the P-values and the variance component estimates between the array data set and the imputed data set where the imputed data set
contains 4,824,392 SNPs whereas the array data set contains 459,792 SNPs. For ease of visualization,  estimates of more than 0.2 have been excluded from the display.
False positive epistatic signals can occur due to imperfect tagging of causal SNPs in the genotyping array (Dudbridge and Fletcher 2014; Hemani et al. 2014; Wood et al. 2014; de Los Campos et al. 2019). To evaluate the robustness of our results in this setting, we simulated a linear additive phenotype using imputed genotype
data, which contains a total of 4,824,392 SNPs (of which 1% SNPs were causal), with the exact same samples as the array data
set. We then applied QuadKAST to genotypes on the array data set with SNPs grouped into 9515 protein-coding genes. This experiment
simulates a scenario where some of the causal SNPs are missing from the analysis. Figure 3 shows that QuadKAST remains calibrated in this setting (irrespective of whether we include self-interactions or not). We
performed additional simulations to test the robustness of QuadKAST. We considered settings (a) with heteroskedastic environmental
noise, where the noise level of each individual is determined by a Bernoulli distributed (Bernoulli(0.5)) indicator variable.
This results in half of the individuals having a noise variance of  , while the other half have a noise variance of
  . The full model is detailed in Dahl et al. (2020) and (b) the presence of large effect causal variants most of which are missing from the analyzed set of SNPs (Supplemental Fig. S3). In both settings, we showed QuadKAST has a well-controlled false positive rate. Beyond robustness analyses on simulated
data, we used QuadKAST to reanalyze the significant trait-gene pairs using imputed genotypes. We observed that 17/32 trait-gene
pairs were also statistically significant on imputed genotypes (Fig. 2B) with concordant P-value and variance component estimates (Spearman's correlation between the −log10 P-values on the two SNP sets = 0.4, whereas the Spearman's correlation of the estimated variance components was 0.59). A detailed
comparison of the estimated variance component across different robustness tests can be found in Supplemental Table S7.
. The full model is detailed in Dahl et al. (2020) and (b) the presence of large effect causal variants most of which are missing from the analyzed set of SNPs (Supplemental Fig. S3). In both settings, we showed QuadKAST has a well-controlled false positive rate. Beyond robustness analyses on simulated
data, we used QuadKAST to reanalyze the significant trait-gene pairs using imputed genotypes. We observed that 17/32 trait-gene
pairs were also statistically significant on imputed genotypes (Fig. 2B) with concordant P-value and variance component estimates (Spearman's correlation between the −log10 P-values on the two SNP sets = 0.4, whereas the Spearman's correlation of the estimated variance components was 0.59). A detailed
comparison of the estimated variance component across different robustness tests can be found in Supplemental Table S7.
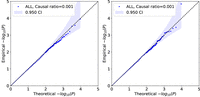
Calibration of QuadKAST when causal variants are imperfectly tagged. We simulated an additive phenotype using imputed genotypes over N = 50 K individuals, 4,824,392 SNPs (of which we randomly selected 1% of the SNPs to be causal). We then tested QuadKAST on the SNPs genotyped on the UKB array with sets defined by protein-coding genes. We applied QuadKAST with (left) and without (right) self-interactions.
Characterizing the importance of individual interactions
To dissect the contributions of individual pairwise interactions, we compute the posterior probability of the interaction
effects (given the MLE or REML estimates of the variance components). The posterior probability of the vector of interaction
effects, γ, is described by a multivariate normal distribution. This allows us to derive the posterior mean and variance for each interaction
which can then be used to assess the importance of a pair of SNPs in explaining the set-level signal (see Supplemental Note S1.4). Given the posterior mean μt and standard deviation σt of an interaction t, we assign an importance score for this interaction as 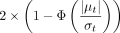 where Φ is the cumulative density function (CDF) of the standard normal distribution (we caution that these importance scores
are not P-values but merely summaries of the posterior distribution of effects).
where Φ is the cumulative density function (CDF) of the standard normal distribution (we caution that these importance scores
are not P-values but merely summaries of the posterior distribution of effects).
We computed these measures of importance for each interaction at each of the 17 significant trait-gene pairs which passed
the significance threshold  on both array and imputed data sets. Importantly, several trait-gene pairs (Alanine Aminotransferase—PNPLA3, Aspartate Aminotransferase—PNPLA3, and Mean sphered cell volume—SPTA1) that show significant quadratic effect at the set level do not demonstrate interactions with strong importance scores (significance
threshold was defined as
on both array and imputed data sets. Importantly, several trait-gene pairs (Alanine Aminotransferase—PNPLA3, Aspartate Aminotransferase—PNPLA3, and Mean sphered cell volume—SPTA1) that show significant quadratic effect at the set level do not demonstrate interactions with strong importance scores (significance
threshold was defined as  where D is the number of interactions considered in one set) (Supplemental Fig. S8). This highlights the power of set-based epistatic testing using a method such as QuadKAST. On the other hand, genes that
show significant quadratic effects while harboring a small number of SNPs typically demonstrated stronger evidence for the
presence of individual pairwise interactive effects (Mean sphered cell volume—OR10Z1 and Urate—DNAJC16). In the case of the lipoprotein(a)–LPA association, we see multiple strong interaction effects although these results require further careful analysis given the
large impact of copy number variation at this locus on the phenotype and the complex interaction of these copy number variants
with other genetic variants at this locus (Coassin and Kronenberg 2022).
where D is the number of interactions considered in one set) (Supplemental Fig. S8). This highlights the power of set-based epistatic testing using a method such as QuadKAST. On the other hand, genes that
show significant quadratic effects while harboring a small number of SNPs typically demonstrated stronger evidence for the
presence of individual pairwise interactive effects (Mean sphered cell volume—OR10Z1 and Urate—DNAJC16). In the case of the lipoprotein(a)–LPA association, we see multiple strong interaction effects although these results require further careful analysis given the
large impact of copy number variation at this locus on the phenotype and the complex interaction of these copy number variants
with other genetic variants at this locus (Coassin and Kronenberg 2022).
Discussion
We have described QuadKAST, a computationally efficient algorithm that is capable of testing for the association of quadratic effects across SNPs in a set with a trait while also quantifying the variance explained by these effects and the relative importance of pairs of SNPs that contribute to the signal of epistasis. Importantly, QuadKAST can be efficiently applied to biobank-scale data sets with large numbers of individuals (hundreds of thousands of individuals) provided the number of SNPs within a set is modest (hundreds).
We performed comprehensive simulations to show that QuadKAST offers calibrated set-based tests of pairwise epistatic effects
and estimates the variance components associated with these effects while scaling to hundreds of thousands of individuals.
We applied QuadKAST to test for epistatic effects in protein-coding genes for 52 quantitative traits measured in the UKB to
identify 32 trait-genes pairs (17 unique traits and 29 unique genes) demonstrating significant epistatic signals ( accounting for the number of genes and traits tested). Across these trait-gene pairs, we observe that the proportion of trait
variance explained by quadratic effects is comparable to additive effects (median value for the ratio of
accounting for the number of genes and traits tested). Across these trait-gene pairs, we observe that the proportion of trait
variance explained by quadratic effects is comparable to additive effects (median value for the ratio of  ) with five trait-gene pairs showing a larger variance explained by quadratic effects compared to additive effects. Further,
we characterize the contribution of interactions among pairs of SNPs to the gene-level epistatic signal, revealing the potential
heterogeneous epistasis pattern across different traits.
) with five trait-gene pairs showing a larger variance explained by quadratic effects compared to additive effects. Further,
we characterize the contribution of interactions among pairs of SNPs to the gene-level epistatic signal, revealing the potential
heterogeneous epistasis pattern across different traits.
Recent studies (Hou et al. 2023; Hu et al. 2023) have documented that causal effects of complex traits tend to be similar across segments of continental and fine-scale ancestry within a population. Whereas these studies suggest that context-specific genetic effects make a limited contribution to trait variation genome-wide (where context can refer to environments leading to gene–environment interactions or other genetic variants leading to gene–gene interactions), our results point to the existence of individual loci where context-specific effects are important. Our finding that the trait variance explained by quadratic effects is comparable to that explained by additive effects suggests that the accuracy of genetic predictors of complex traits can be improved by including interaction terms at these genes.
Our current work has several limitations. First, the calibration and power of hypothesis tests and the accuracy of the variance component estimates obtained by QuadKAST may deteriorate due to inaccuracies in model assumptions. In this study, we assessed sources of inaccuracy due to inadequate correction for population stratification and imperfect correlations with unobserved causal variants. To assess the impact of population stratification, we increased the number of genotype PCs that are included as covariates and showed that all of our signals remain significant. To assess the impact of missing causal variants, we confirmed that QuadKAST remains calibrated in simulations that model missing causal variants and that of the 32 trait-gene pairs that were discovered from array SNPs, 17 remain significant when we analyzed imputed SNPs. Our simulations involving heteroskedastic noise and settings with missing large effect causal variants suggest that the overall false positive rate of QuadKAST remains well-controlled across these settings. We defer a more detailed exploration of the impact of modeling assumptions to future work. Second, although QuadKAST enables a deeper understanding of epistasis in local genomic regions such as protein-coding genes investigated in this work, it is important to recognize that interactions within a genomic region represent only a small fraction of the potential forms of epistasis. Third, our set-based strategy requires sets to be defined a priori. Alternative approaches to aggregate variants into sets and searching over sets could be combined with the efficient testing within QuadKAST to discover epistasis across the genome. Fourth, the assignment of weights to pairwise interactions as a means of prioritizing specific SNPs or pairs of SNPs can enhance the statistical power and merits further exploration. Fifth, our strategy for identifying trait-gene pairs that have quadratic effects is conservative. Beyond the stringent P-value threshold that we employed, we also chose to regress out the additive effect in the region surrounding the target gene to ensure that the additive signal does not lead to apparent signals of epistasis. Such a strategy can, however, lead to a reduced power to identify epistatic effects. Exploring effective ways to jointly estimate additive and epistatic effects could lead to increased power. For the purpose of trait prediction, it can be beneficial to choose the P-value threshold in an adaptive manner as is done in the context of current polygenic score (PGS) methods (Khera et al. 2018; Marees et al. 2018; Choi et al. 2020). Finally, it is possible to test for other types of epistasis using QuadKAST including the use of haplotype data although more careful interpretation might be needed to understand the results. We leave these directions for future work.
Software availability
QuadKAST main script can be found at GitHub (https://github.com/sriramlab/FastKAST/tree/QuadKAST) with the required package installation script, exemplar simulation files, script for running QuadKAST, and results with tutorial analysis. The calibration test simulator used in the experiments can be found at GitHub (https://github.com/alipazokit/simulator). Script and instructions for replicating the simulation and real data analysis pipeline can be found at GitHub (https://github.com/FBoyang/QuadKAST-replication). This folder contains replication script, statistics, and figures for all the major analysis presented in this paper. The QuadKAST main script, calibration test simulator, and script for replicating the simulation and real data analysis pipeline can also be found as Supplemental Code.
Competing interest statement
The authors declare no competing interests.
Acknowledgments
This research was conducted using the UK Biobank Resource under application 33127. We thank the participants of UK Biobank for making this work possible. B.F. and S.S. were supported in part by National Institutes of Health (NIH) GM125055 and National Science Foundation grant CAREER-1943497, and S.S. was supported by NIH G006399.
Author contributions: S.S. conceived and supervised the project. B.F., P.A., A.A., and S.S. developed the methods. B.F. and S.S. wrote the manuscript. B.F., P.A., and A.A. wrote the software code and performed the analyses. J.M. guided the experimental design. All authors read, reviewed, and approved the final manuscript.
Footnotes
-
[Supplemental material is available for this article.]
-
Article published online before print. Article, supplemental material, and publication date are at https://www.genome.org/cgi/doi/10.1101/gr.279140.124.
-
Freely available online through the Genome Research Open Access option.
- Received February 15, 2024.
- Accepted August 13, 2024.
This article, published in Genome Research, is available under a Creative Commons License (Attribution-NonCommercial 4.0 International), as described at http://creativecommons.org/licenses/by-nc/4.0/.


