
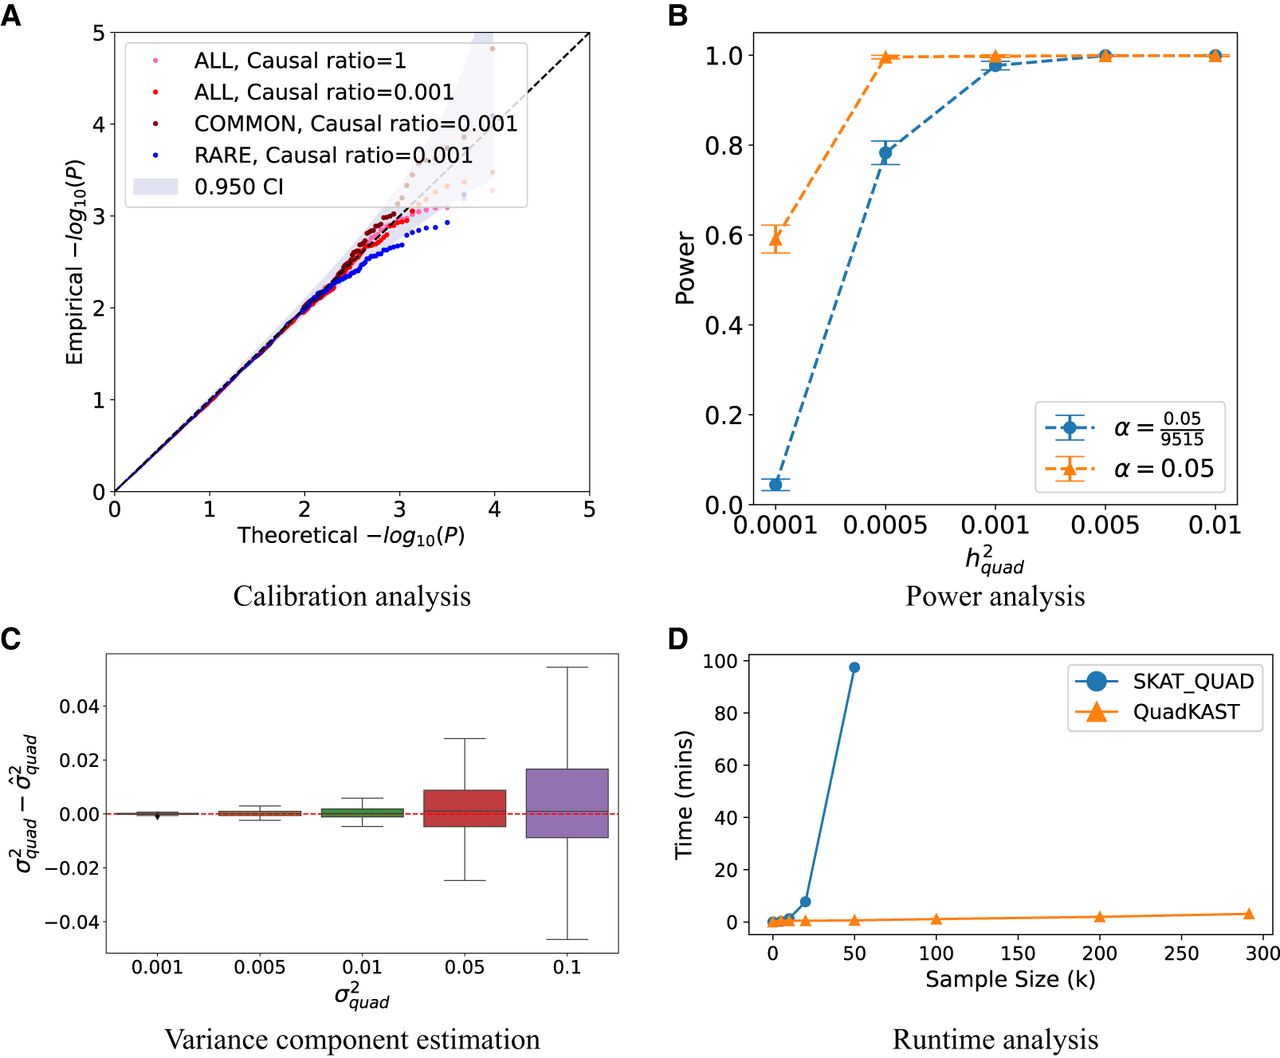
Overview of QuadKAST. (A) Calibration analysis. We applied QuadKAST to SNPs within 9515 protein-coding genes for four genetic architectures that consist entirely of linear
additive effects (N = 50 K individuals, UKB array data). (B) Power analysis. We simulated traits with varying quadratic variance component on a randomly selected subset of 5 K individuals from unrelated
white British individuals in UKB. We applied QuadKAST to 1000 randomly selected protein-coding genes and defined power as
the ratio of P-values reported by QuadKAST that pass the significance threshold α. In these experiments,  is equal to the quadratic heritability
  . (C) Accuracy. Similar to B, we applied QuadKAST to estimate the quadratic variance component at each gene. (D) Runtime. We evaluated the runtimes of the quadratic kernel option in SKAT (SKAT_QUAD) and QuadKAST by fixing the number of SNPs M = 100 and varying the number of individuals (average runtime across 10 replicates).


