
Abstract
Density separation is a process routinely used to segregate minerals, organic matter, and even microplastics, from soils and sediments. Here we apply density separation to archaeological bone powders before DNA extraction to increase endogenous DNA recovery relative to a standard control extraction of the same powders. Using nontoxic heavy liquid solutions, we separated powders from the petrous bones of 10 individuals of similar archaeological preservation into eight density intervals (2.15 to 2.45 g/cm3, in 0.05 increments). We found that the 2.30 to 2.35 g/cm3 and 2.35 to 2.40 g/cm3 intervals yielded up to 5.28-fold more endogenous unique DNA than the corresponding standard extraction (and up to 8.53-fold before duplicate read removal), while maintaining signals of ancient DNA authenticity and not reducing library complexity. Although small 0.05 g/cm3 intervals may maximally optimize yields, a single separation to remove materials with a density above 2.40 g/cm3 yielded up to 2.57-fold more endogenous DNA on average, which enables the simultaneous separation of samples that vary in preservation or in the type of material analyzed. While requiring no new ancient DNA laboratory equipment and fewer than 30 min of extra laboratory work, the implementation of density separation before DNA extraction can substantially boost endogenous DNA yields without decreasing library complexity. Although subsequent studies are required, we present theoretical and practical foundations that may prove useful when applied to other ancient DNA substrates such as teeth, other bones, and sediments.
Over the past decade, there has been a concerted effort to improve the efficiency of DNA recovery from irreplaceable archaeological specimens, such as human bones and teeth. The majority of ancient DNA research is now performed using skeletal elements that have biologically higher endogenous DNA contents, such as petrous bones, ear ossicles, and tooth cementum (Gamba et al. 2014; Damgaard et al. 2015; Pinhasi et al. 2015; 2019; Hansen et al. 2017; Sirak et al. 2020; Harney et al. 2021). Ancient DNA–specific wet laboratory protocols have increased the quantity of DNA isolated and extracted (Dabney et al. 2013; Rohland et al. 2018), and improved the efficiency of DNA library construction using single-stranded molecules (Gansauge and Meyer 2013, 2019; Gansauge et al. 2020; Kapp et al. 2021). “Pretreatment” steps, such as cleaning samples with a weak sodium hypochlorite (bleach) solution (Kemp and Smith 2005), implementing a chemical or enzymatic “predigestion” step (Damgaard et al. 2015; Korlević et al. 2015; Schroeder et al. 2019), or using a combination of the two (Boessenkool et al. 2017), aim to reduce contamination and maximize endogenous DNA yields; however, these steps reduce the complexity of genomic sequencing libraries, negatively influencing downstream analyses. Here, we present a different type of “pretreatment” step that improves endogenous DNA yields while not decreasing the complexity of sequencing libraries.
After the death of a vertebrate organism, the chemical composition of its skeletal remains immediately starts to be altered by diagenetic processes such as hydrolysis, enzymatic action, mineral dissolution, and microbial colonization (Bell et al. 2001; Hedges 2002; Booth 2016; Kendall et al. 2018; Rasmussen et al. 2019). These processes have substantial and irreversible effects on the structure and composition of bone, inducing collagen loss and alteration of the ratio of organic to inorganic fractions. Microorganisms, in particular, have been shown to play an important role in the mineralization of bone elements and can, therefore, cause deviations in localized density (Bell et al. 2001; Daniel and Chin 2010). As this process is one of the main pathways for the introduction of exogenous contaminant DNA, avoiding or eliminating these exogenous mineralized pockets before DNA extraction may facilitate the recovery of greater amounts of endogenous DNA.
In vivo bone naturally contains regions of differing densities. As an individual ages, new bone formation is accompanied by the progressive mineralization of existing bone matrix and osteocytes, in parallel with bone remodeling generating new osteonal systems, leading to regions of different densities within the same bone (Bell et al. 2001, 2008; Kendall et al. 2018). In petrous bones and ear ossicles, however, there is a lack of bone remodeling after ∼24 wk in utero (Hernandez et al. 2004), contributing to a high concentration of mineralized osteocytes in relation to other bones (Hernandez et al. 2004; Bell et al. 2008; Ibrahim et al. 2022), and this has been hypothesized to be one of the main determinants of the success of petrous bones in the retrieval of ancient DNA (Pinhasi et al. 2019; Ibrahim et al. 2022).
Previous work has used density separation, also referred to as fractionation, to isolate elements of different densities before applying isotopic analysis to successfully reconstruct the dietary habits of archaeological individuals over the last 15 yr of their lives (Bell et al. 2001). However, to the best of our knowledge, density separation has not yet been applied to the process of recovering ancient DNA from archaeological bone powders. In theory, it could be used to not only separate endogenous bone elements of different densities, specifically including mineralized osteocytes (like in the isotopic study just mentioned) but also to separate nonendogenous clusters of mineralized microorganisms and environmental sediments that sometimes cannot be removed entirely during sample processing in an ancient DNA laboratory.
Here we present a new method for isolating the most endogenous DNA-rich fractions of petrous bone powder without additional ancient DNA laboratory equipment and using a nontoxic heavy liquid named sodium polytungstate (SPT). The main objective of this work was to identify density interval(s) that contained more endogenous DNA compared with a standard extraction of bone powder from the same individual, establishing the validity of using density separation as a technique to improve DNA recovery.
To reduce the number of external and differentiating variables that could influence our results, we restricted our analyses to petrous bones from two temperate locations in Europe (for more details on the process of sample selection, see the Methods section). According to the Allen Ancient DNA Resource, of the 8797 libraries with a clearly stated skeletal source of DNA, the petrous was used for analysis 4839 times, representing more than half of all cases (teeth were used 3161 times, representing approximately another one-third of all cases, and all other elements were used in only ∼10% of cases) and is, therefore, the most likely element to which such a new methodology would be applied (https://reich.hms.harvard.edu/allen-ancient-dna-resource-aadr-downloadable-genotypes-present-day-and-ancient-dna-data; version 54.1.p1).
Results
As there are no published data or protocols for the recovery of ancient DNA from archaeological bone powder following a density separation step, we began by following a protocol similar to that presented by Bell et al. (2001), running a small preliminary experiment (for more details, see the Methods section) to achieve the protocol presented here (illustrated in Fig. 1). Any use of the terms “density” and “density intervals” in what follows refers to a measure that approximates true densities, instead of bulk densities, as the latter are calculated considering bone porosity as contributing to the units of space and have, therefore, substantially lower values than the true densities (Lee Lyman 2021).
Diagram summarizing the three main phases of the density separation protocol for ancient DNA: sequential density separation and acquisition of the different interval solutions, washes and repelleting of the bone powders, and DNA extraction following standard methods.
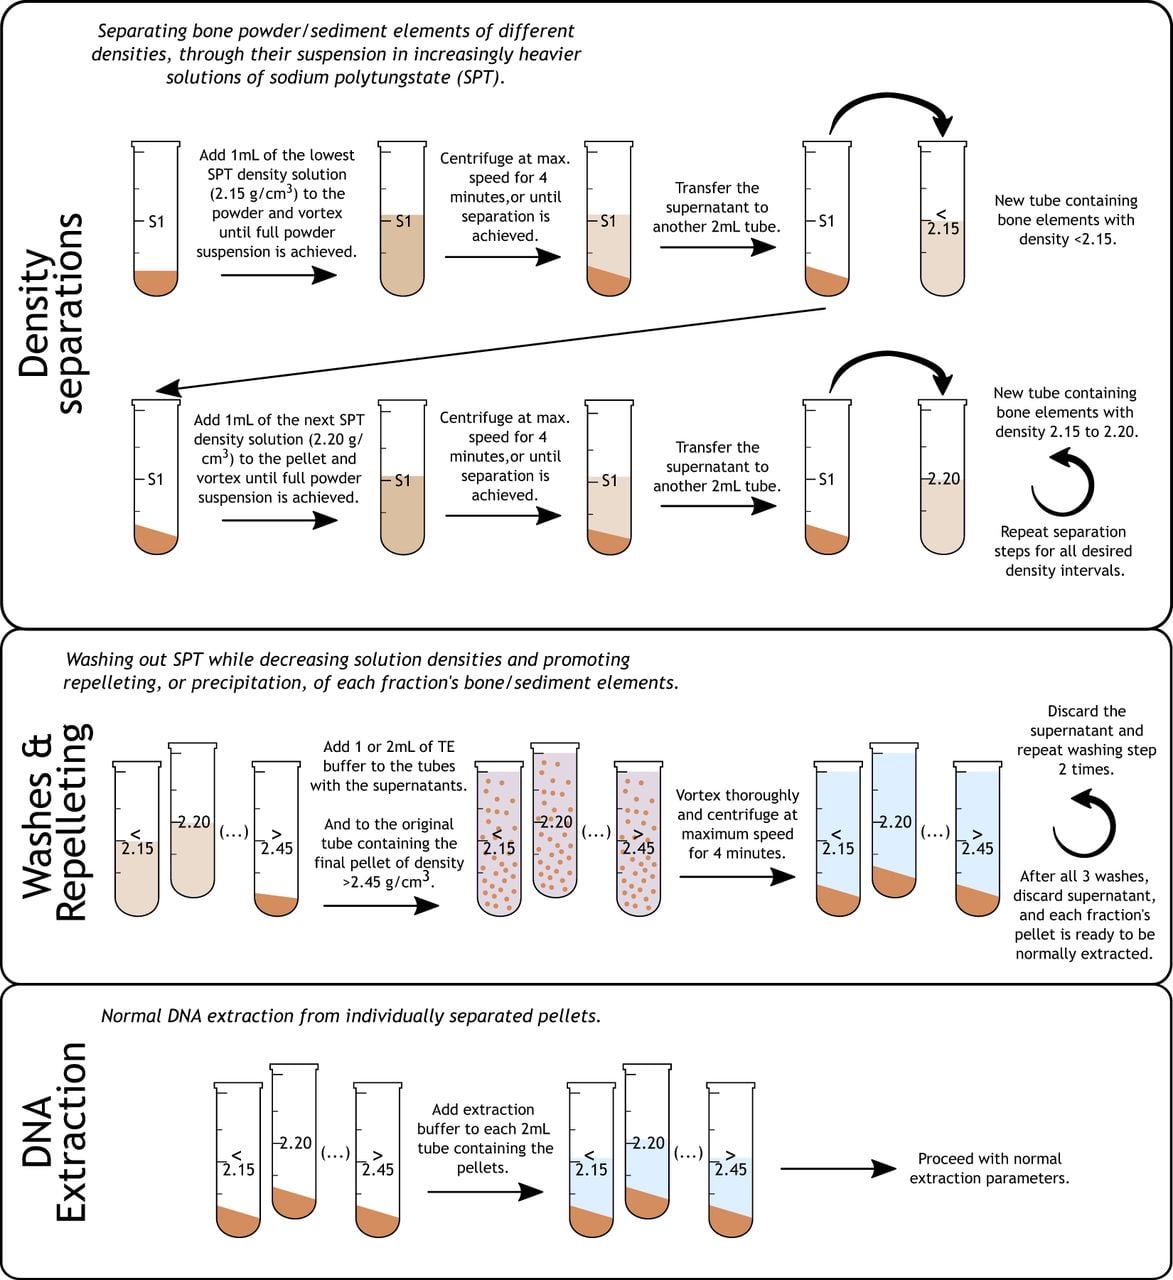
We selected 10 petrous bones from remains excavated from two archaeological locations in temperate parts of Europe, namely, the Bronze/Iron Age sites of Praha 5–Malà Ohrada/Jinonice, respectively, in the Czech Republic (n = 4) and the Late Antiquity/Early Medieval necropolis of Castel Sozzio (Civitella D'Agliano, Viterbo), in Italy (n = 6) (Supplemental Note S1; Supplemental Table S1). We separated, from macroscopically homogeneous bone powder generated for each individual, 150 mg of powder for sequential separation over eight density intervals that were identified in our preliminary experiment as the most relevant (<2.15, 2.15–2.20, 2.20–2.25, 2.25–2.30, 2.30–2.35, 2.35–2.40, 2.40–2.45, >2.45 g/cm3). For convenience, all intervals are from here on referred to by their highest value (e.g., interval 2.20 refers to the interval range 2.15–2.20; 2.40, to the range 2.35–2.40). We separated a further 50 mg of powder from the same homogeneous powder for standard ancient DNA extraction that followed a previously published protocol (Dabney et al. 2013) and did not include any density separation step. After sequential separation and suspension of the powder particles over the eight density intervals, each tube's liquid density was lowered and washed with Tris-EDTA (TE) buffer to repellet the suspended bone powder and remove all traces of SPT (for details, see the Methods section) (Fig. 1).
Subsequently, DNA extraction took place using the same protocol as for the standard extractions (Fig. 1). All 90 libraries (10 × 8 intervals plus 10 standard extractions) were screened using low-coverage shotgun sequencing (“Sequencing Group 1”), and the resulting sequencing data and quality metrics were assessed (Supplemental Table S1). After identifying the two best density intervals from “Sequencing Group 1” by their percentages of unique endogenous reads, we performed additional shotgun sequencing of the same libraries (also further sequencing the standard extraction libraries) in order to obtain greater amounts of data to allow for more robust comparisons (“Sequencing Group 2”). The data from the different sequencing runs were then merged (Supplemental Table S1) and, to ensure comparability and absence of bias owing to unequal sequencing yields, were randomly subsampled to equal numbers of reads within each individual, using seqtk (https://github.com/lh3/seqtk) (Supplemental Table S2). To statistically compare the data from the standard extractions and the best density intervals, we computed paired Wilcoxon signed-rank tests with a P-value threshold of significance of 0.05, a minimum of six paired observations, and the normalized, subsampled, and merged data for all metrics except for contamination estimates, as the latter should not be affected by random subsampling and benefits from more data for increased accuracy (for contamination, see Supplemental Table S1; for all other metrics, see Supplemental Table S3).
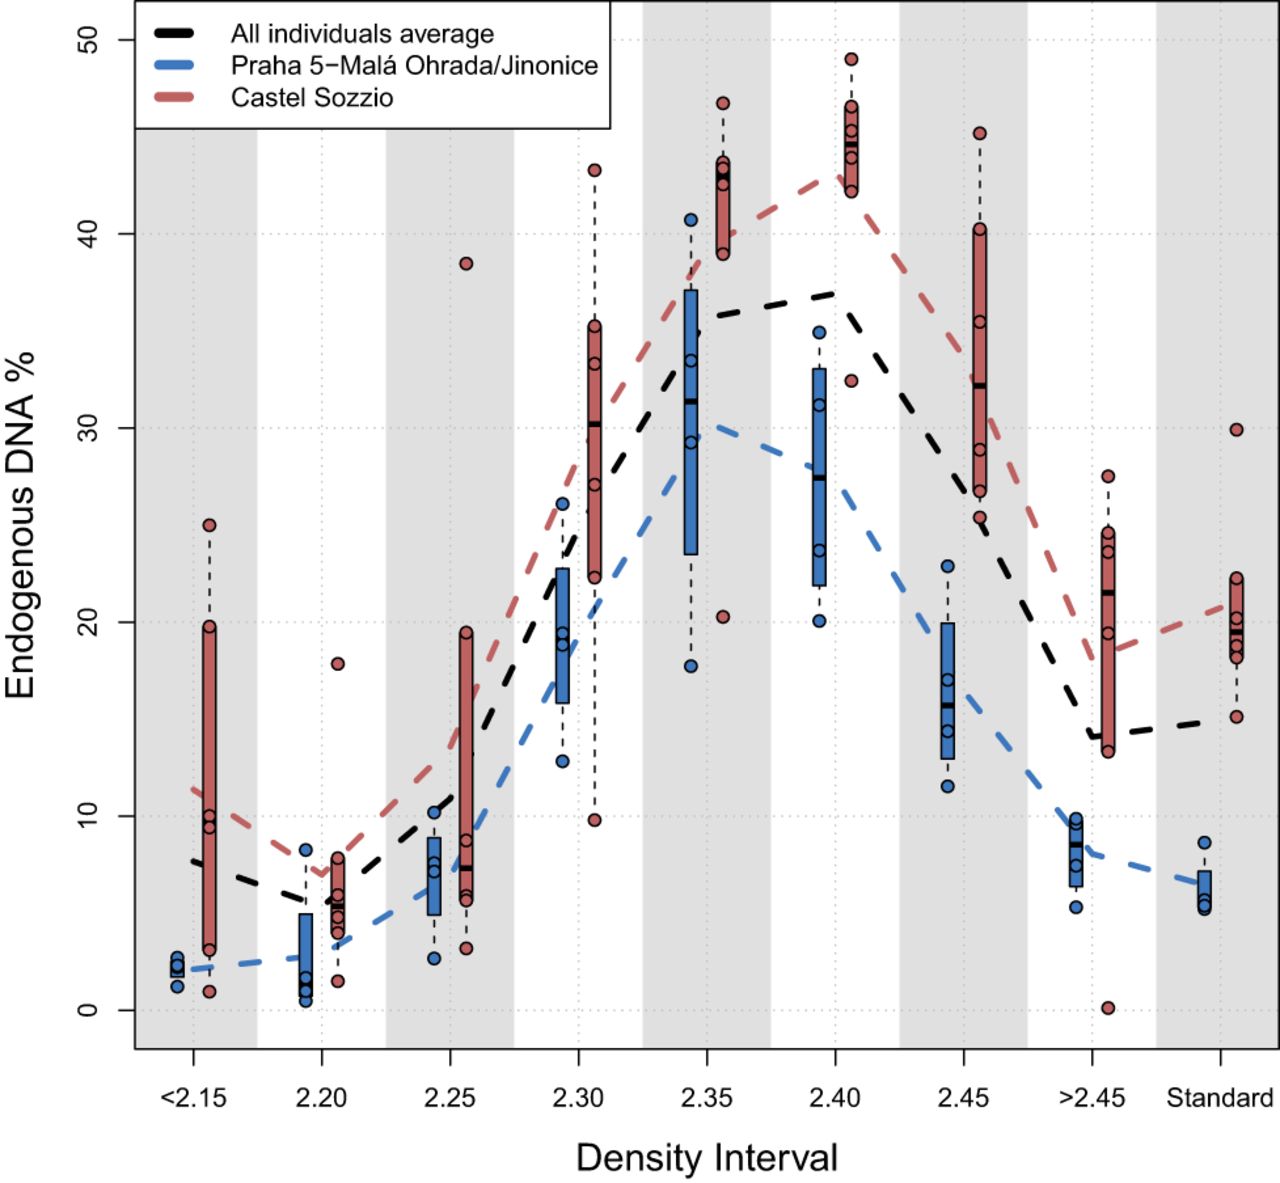
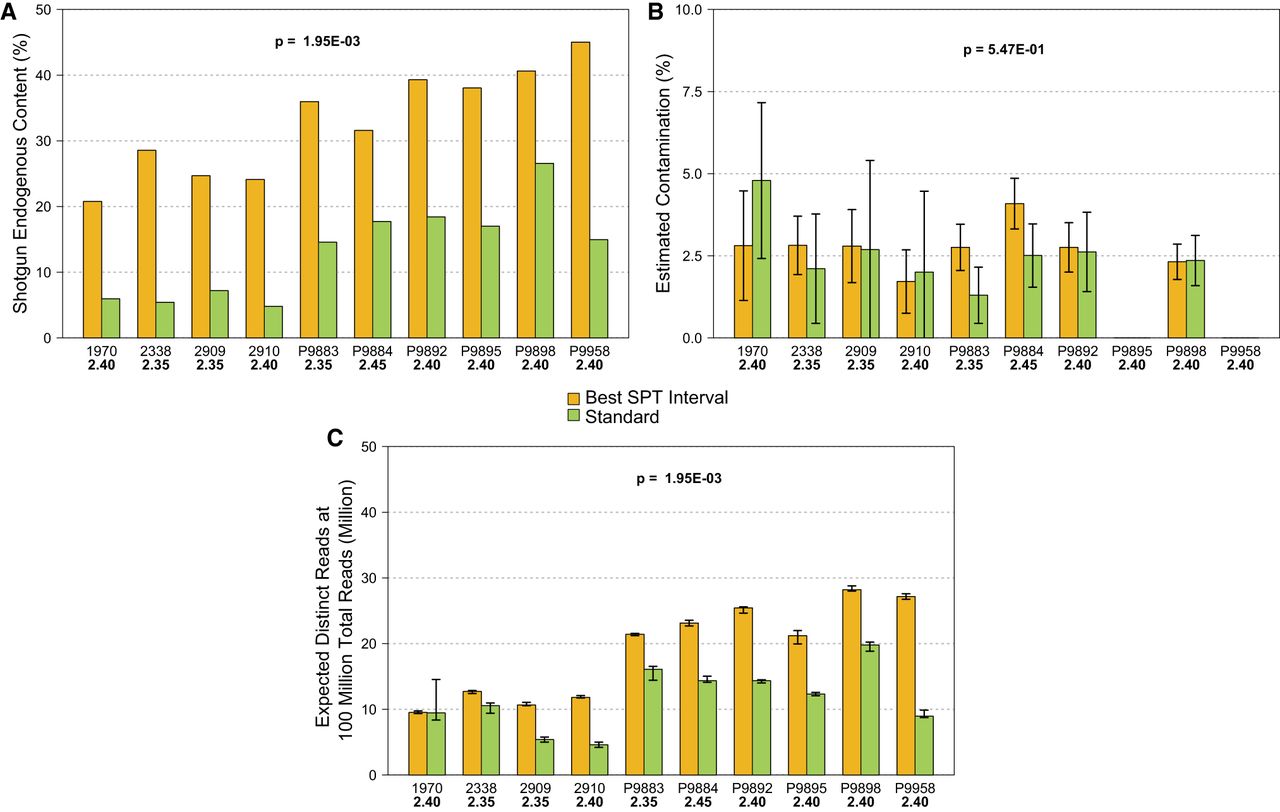
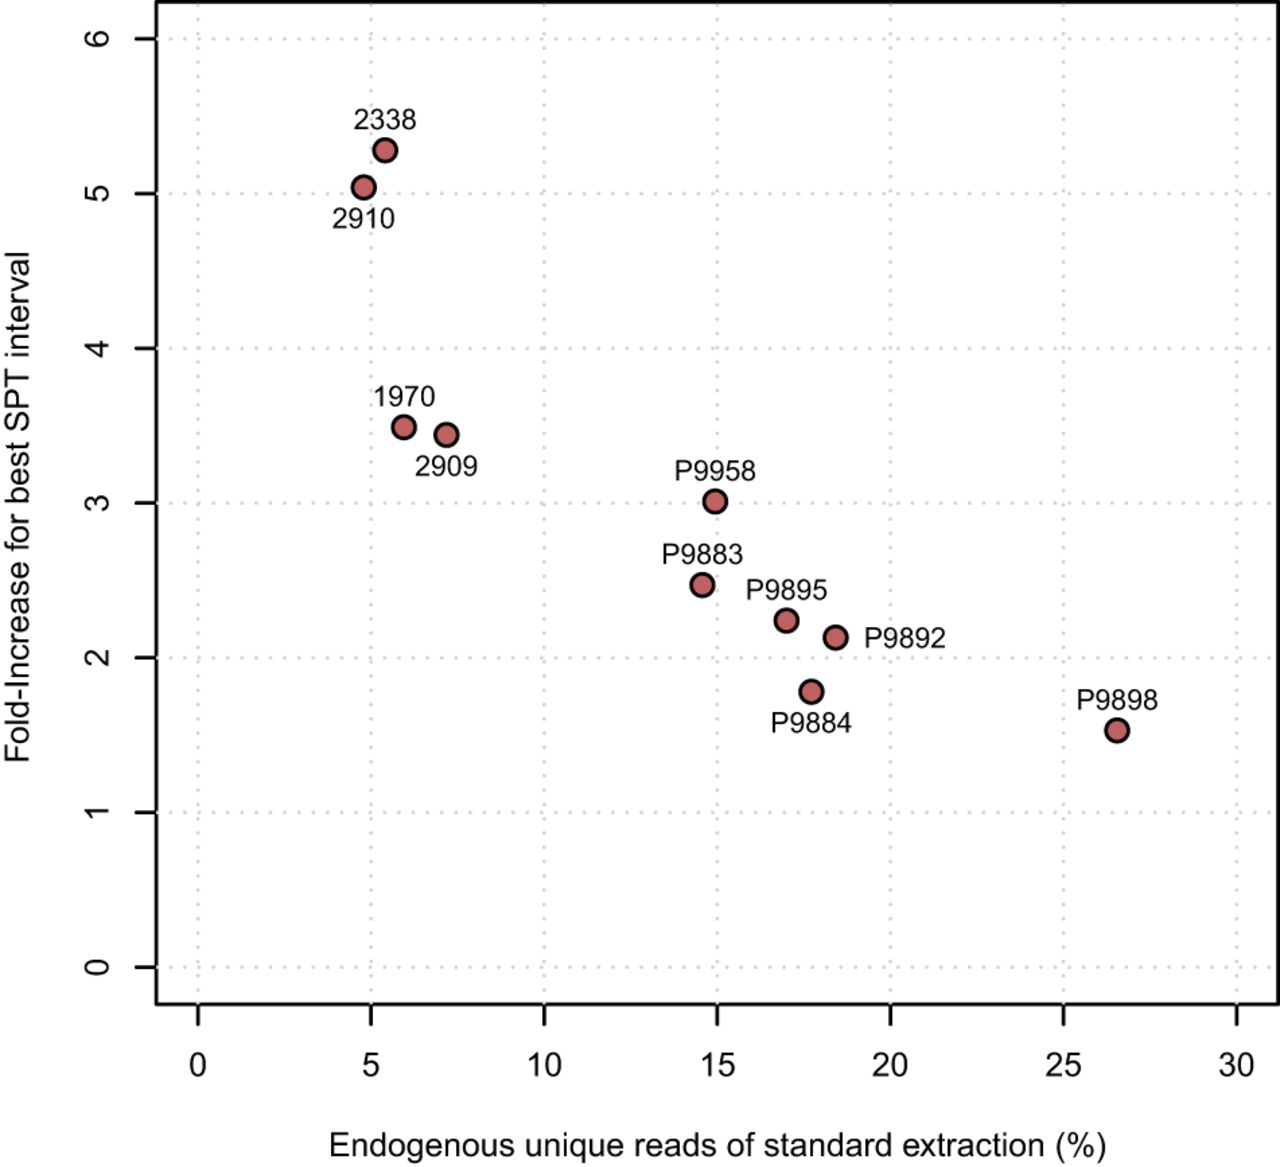
Overall, the application of the density separation protocol was successful for all individuals and densities, confirming that using SPT does not exert a negative influence on the DNA molecules or the process of DNA extraction itself. We did not weigh the exact powder amounts separated in each interval to avoid the potential introduction of contamination during the drying steps (the weight would have also been inaccurate because the powder was wet). However, a generalized sequential increase in separated repelleted powder quantities was observed along with the density, from nearly negligible amounts at <2.15 to substantial amounts at 2.40 and 2.45, with the largest pellet always present in the heaviest density interval, >2.45 g/cm3 (Supplemental Figs. S1, S2). The assessment of the screening data across the eight density intervals indicates that the relative amounts of unique endogenous DNA (measured by the ratio of nonduplicated reads aligned to the human genome by the total number of reads) increased from 2.15 to 2.40 g/cm3, with the highest endogenous DNA contents always present in the higher intervals: either at 2.35 or at 2.40 (Fig. 2; Supplemental Table S1). We note a single exception for individual P9884, for whom the optimal interval was 2.45 g/cm3 (Supplemental Table S1). After resequencing and normalizing the data, these best intervals and standard extractions were compared further (Supplemental Table S2). Here, the average fraction of endogenous unique DNA reads for the standard extractions was 13.25% (range, 4.79%–26.55%), whereas for the best SPT intervals it was 32.86% (range, 20.76%–45.01%), represented by an average improvement of 3.04-fold (range, 1.53–5.28) per individual (Fig. 3A; Supplemental Table S2). The smallest change was for individual P9898, from 26.55% endogenous DNA in the standard extraction powder to 40.62% in the 2.40 g/cm3 interval, whereas the largest was for individual 2338, from 5.41% in the standard extraction to 28.54% in the 2.35 g/cm3 interval (Fig. 3A; Supplemental Table S2). Consequently, the endogenous contents of the standard extractions were found to be inversely correlated to the fold-increase obtained in the best SPT intervals (Fig. 4).
Distribution (bar plots) and averages (colored lines) of endogenous DNA percentages after duplicate removal, per interval and per site, using the initial sequencing data (“Sequencing Group 1”) (Supplemental Table S1).
Comparison of some quality and authenticity metrics between the best SPT interval and the same individual's standard extraction. (A) Endogenous DNA contents (P-value = 0.001953). (B) Contamination estimated by hapCon for male individuals (P-value = 0.5469). (C) Expected distinct reads after deep sequencing as a measure of library complexity, estimated by preseq at a total number of reads of 100 million (P-value = 0.001953). P-values shown in bold denote significance under a threshold of 0.05. Panels A and B use subsampled and normalized total read numbers (Supplemental Table S2), whereas panel C uses the full merged data for statistical power (Supplemental Table S1).
Fold-increase in endogenous DNA contents as a function of the standard extraction's contents. Sample IDs plotted next to each dot.
These paired differences in endogenous DNA yields were statistically significant (P-value = 0.001953) and were the result of an average increase of 3.04-fold in the number of unique aligned reads (P-value = 0.001953) (Fig. 3A; Supplemental Tables S2, S3). However, these changes can potentially be higher in samples with lower library saturation and fraction of duplicated reads after alignment, as we were able to achieve an 8.53-fold increase in endogenous contents for individual 2338 before the removal of duplicated reads, from 6.24% to 53.20% (Supplemental Table S2).
We estimated individual library contamination using a recently developed method that requires only 0.02× whole-genome coverage per sample (Huang and Ringbauer 2021). This method models and quantifies mismatches in haploid X Chromosomes as contamination and is therefore restricted to individuals who are molecularly sexed as male, which in our case corresponded to eight out of 10 individuals. The average contamination for all but one library above the 0.02× threshold in “Sequencing Group 1” (n = 32) was estimated to be 2.87% (range 1.37%–4.48%), which stands below the typical threshold of 5% for ancient DNA (Supplemental Table S1; Fu et al. 2013; Nakatsuka et al. 2020). One outlier had an estimated 9.9% contamination on the lower density interval (<2.15 g/cm3 for individual P9898), which is likely an isolated observation, as the average contamination for the same individual's other six intervals and standard extraction was 2.57% (Supplemental Table S1). By then looking at the merged higher coverage data for the best intervals and the standard extraction (“Sequencing Group 2”; nonsubsampled in order to have increased analytical power), the average contamination among all was estimated to be 2.65% (range 1.30%–4.80%), with a nonsignificant difference between the best SPT intervals (average, 2.76%) and the standard extractions (average, 2.55%; P-value = 0.5469) (Fig. 3B; Supplemental Tables S1, S3). The negative controls included in all stages of the laboratory work support zero to negligible ancient cross-contamination, as 12/13 libraries had no terminal deamination, and the average duplication rate after polymerase chain reaction (PCR) amplification to plateau was high, at 64% (Supplemental Table S1). One control did have 0.02 terminal deamination, but only 302 sequences remained after filtering with PMDtools (threshold 3) to isolate those with the highest likelihood of being ancient (Skoglund et al. 2014).
We then investigated if separation using a wider density interval would still give better results than a standard extraction without a density separation step. A wider range that still improves DNA recovery with no introduction of contamination would enable this method to be applied simultaneously to multiple and varied samples with different preservation, taphonomic histories, and maybe even to different skeletal or other bioarchaeological DNA substrates, increasing the overall applicability of this technique. Using the screening data from “Sequencing Group 1,” we found that the average endogenous DNA yields for the combined intervals 2.25, 2.30, 2.35, and 2.40 were still statistically higher than the yields of the standard extraction (P-value = 0.003906), with an average increase of 2.35-fold (range, 0.81–5.24) (Supplemental Tables S1, S3). To investigate this further, we used the remaining powder (between 55 and 124 mg) from the exact same batches of seven individuals after having measured the initial 150 + 50 mg, and separated them at a single density of 2.40 g/cm3 to formally test the possibility of obtaining improved yields with a single practical separation. The average endogenous contents for the <2.40 intervals were 35.05% (range, 25.75%–47.61%), corresponding to an increase of 2.83-fold compared with the standard extractions (P-value = 0.01563) (Supplemental Tables S3, S4). Furthermore, for every individual, the single <2.40 interval yield was higher than the corresponding standard extraction, independently of the initial powder amount. This suggests that, although this wider density interval performed slightly worse than the narrower ones, a single separation at 2.40 g/cm3 still provides an improvement in endogenous yields relative to a standard extraction without a preceding density separation step and that smaller initial powder amounts down to at least 50 mg can likely be used (Supplemental Tables S3, S4).
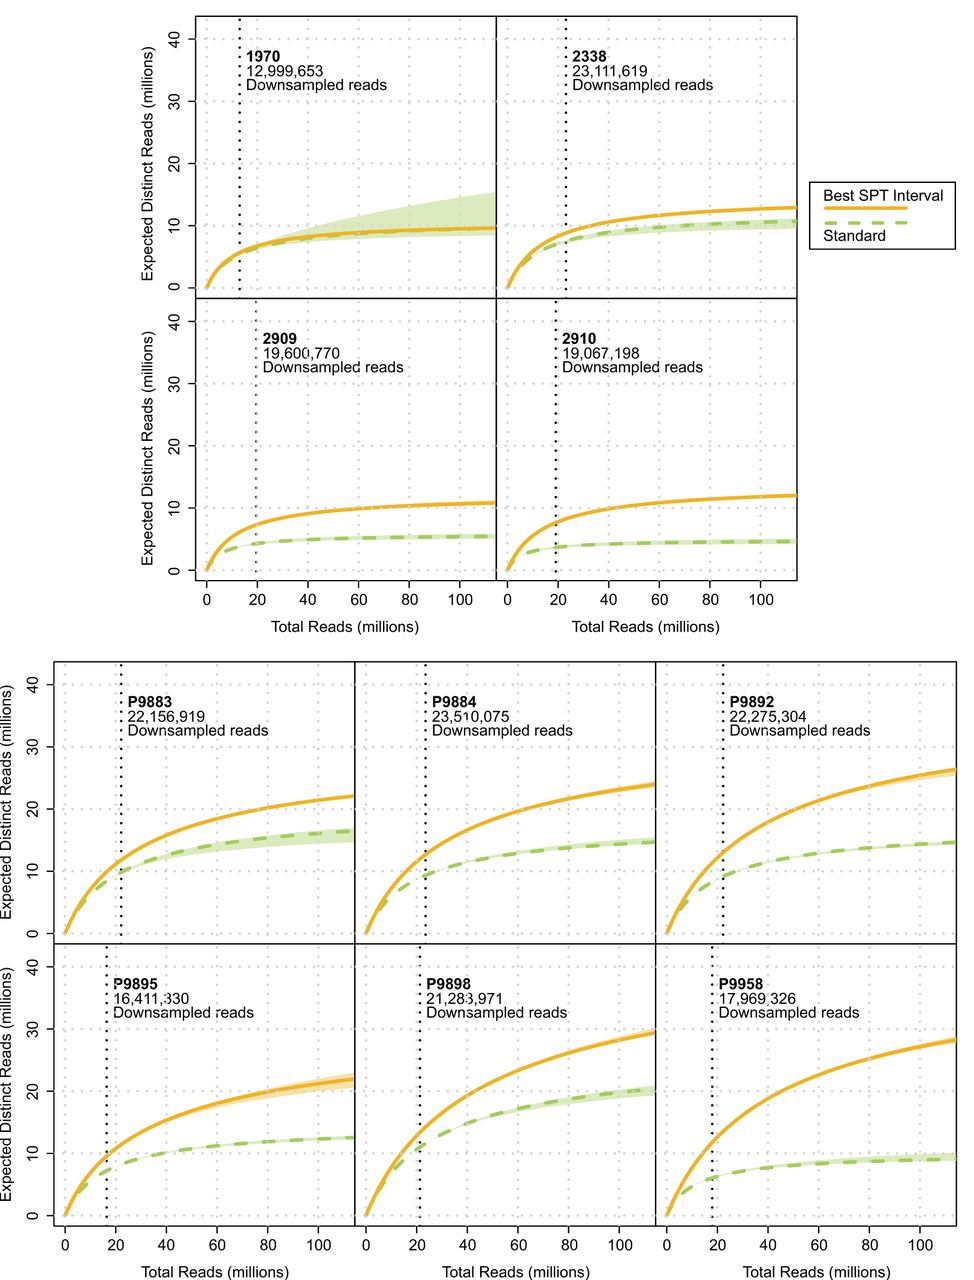
In regards to the effects of the overall increase in endogenous contents of the main set of 10 samples in other quantitative metrics, such as nuclear genomic and mitochondrial coverages, we observed an increase in both of these metrics for the best SPT intervals that was statistically significant (P-value = 0.001953, for both), with the average nuclear coverage increasing, on average, 2.94-fold (range, 1.58–5.04) and with the mitochondrial coverage increasing, on average, 3.12-fold (range, 1.87–5.01) (Supplemental Tables S2, S3). Similarly, when we looked at the curves produced by preseq’s (Daley and Smith 2013) lc_extrap command as a measure of library complexity, which extrapolates the expected number of distinct reads after extensive sequencing from duplication rates, we found a statistically significant average increase of 1.77-fold in the number of distinct reads at a sequencing effort of 100 million reads for the best SPT intervals (P-value = 0.001953) (Figs. 3C, 5; Supplemental Tables S3, S5). Although these results can be interpreted as suggesting an increase in observed library complexity, we were not able to investigate changes in complexity per milligram of input powder owing to the lack of the latter's measurements.
Yield of expected distinct reads for a theoretically larger sequencing effort, as a measure of library complexity, using the lc_extrap function of the software preseq. Vertical dotted lines represent the number of reads to which each sample's best SPT interval and standard extraction was randomly down-sampled. Shaded areas represent 95% confidence intervals. Results shown here for up to 100 million total reads; in Supplemental Figure S3, for up to 500 million.
Lastly, the average read length of 57 bp in the standard extracts (range, 50–67 bp) was not statistically different from the average of 55 bp in the best SPT intervals (range, 51–63 bp; P-value = 0.1641) (Supplemental Tables S2, S3). However, we observed significant differences in deamination frequencies in the terminal bases of the DNA. These chemical alterations to the DNA in the form of C > T and G > A changes have been shown to be characteristic of ancient DNA and are one of the most important metrics for assessing authenticity (Green et al. 2009; Ginolhac et al. 2011; Sawyer et al. 2012). We observed an increase in the average deamination frequencies of the terminal bases of the 5′ end of the DNA sequences from 0.32 in the standard extracts (range, 0.27–0.40) to 0.34 in the best SPT intervals (range, 0.31–0.44), with a P-value of 0.003906 (Supplemental Tables S2, S3). A similar pattern was observed for the 3′ end (Supplemental Tables S2, S3). Our data do not suggest that these were caused by chemical exposure to the SPT and/or its low pH, as there was no consistent pattern between exposure to higher SPT concentrations and higher deamination. Furthermore, an expected pattern in which higher contamination would lead to lower deamination was also not observed. Nevertheless, future investigations will be able to shed more light onto this situation.
Discussion
We performed density separation of bone powder across eight sequential density intervals as an alternative type of “pretreatment” step to increase unique endogenous ancient DNA yields without decreasing library complexity or negatively impacting DNA authenticity. When a density separation step was implemented, we observed an up to 5.28-fold increase in unique endogenous DNA recovery, reflecting a more efficient exclusion of contaminant-rich bone elements and leading to higher ratios of endogenous DNA on normalized total read numbers. All authenticity metrics examined were similar to those for the standard extractions, and library complexity based on expected distinct reads extrapolations was never reduced for the best SPT intervals, contrary to the results observed following other pretreatment techniques such as the use of bleach to reduce surface contamination. As such, a density separation step can provide an efficient way to improve the cost efficiency of ancient DNA sequencing without requiring additional laboratory equipment.
Notably, the largest improvements in endogenous unique DNA yield were observed for the samples with the lowest yields obtained for the standard extraction. On average, we saw an increase of 4.31-fold on samples with <10% endogenous DNA yield on the standard extraction, whereas for samples with >10%, that increase was 2.19-fold, suggesting that density separation may enable the re-evaluation and analysis of previously processed samples that failed to pass the quality and quantity thresholds that rendered them inappropriate for further sequencing or population genomics analysis.
The consistency in the best density intervals identified across all samples confirms that the theoretical background of this method is valid and that, in samples with similar preservation, particles rich in endogenous DNA will be concentrated at a specific shared density range. It also confirms the validity of our selection of intervals for this experiment, as the best intervals included the higher density intervals (2.35 and 2.40) but not, except for a single sample, the interval of highest density (2.45). These results also match what is described by Bell et al. (2001) regarding the 2.30 to 2.40 g/cm3 interval comprising interstitial bone and representing the most highly mineralized, and older, human bone elements, which is what is to be expected to be found in the cochlea owing to its lack of bone remodeling and high concentration of mineralized osteocytes containing endogenous DNA (Bell et al. 2008; Busse et al. 2010). However, and considering that different bone densities can be associated with different mineralization levels (Bell et al. 2008), variations between the various elements of the skeleton are expected, and further work should focus on the identification of each element's most optimal density intervals.
For example, as most bones are expected to have an overall lower density than the cochlea owing to constant bone remodeling, which results in a higher proportion of recently formed, lower density bone, those intervals might be slightly lower but, nevertheless, >1.7 g/cm3 (Currey 1984; Simmons et al. 1991; Cameron et al. 1993; Bell et al. 2001; Lee Lyman 2021). In the case of (fresh) teeth, specifically, it has been shown that cementum and dentin can be separated both from enamel and each other, using individual density fractionation intervals (2.04, 2.20–2.40, and 2.70–2.80 g/cm3, respectively) (Brekhus and Armstrong 1935). On the other hand, poorly preserved teeth and/or bones that have undergone substantial mineralization and fossilization over long time periods, may present an overall shift toward higher density intervals (Sillen 1981; Bell et al. 2001; Daniel and Chin 2010). Although no studies exist for human bones, this was shown in a gazelle bone from the Natufian period, for which the general density range moved from 1.9–2.3 g/cm3 to 2.4–2.6 g/cm3 (Sillen 1981; Bell et al. 2001). Thus, further studies may help us to understand if such shifts happen differentially across human bones, determine the rates at which they occur, and provide additional insight into where within the bone tissue structure the DNA is preserved (if it is still present).
Moreover, in a similar manner as to how oxygen isotopes from tooth enamel can be used to investigate individual mobility between childhood and adulthood (Budd et al. 2004; Pellegrini et al. 2016), the fact that different mineralization and density levels within the same bone are associated with differential bone formation over the last 15 yr of life of an individual (Bell et al. 2001, 2008) may prove extremely useful for future studies involving changes in ancient epigenetics and methylation patterns over a substantial period of the individual's life. Furthermore, because our proposed protocol includes several SPT wash steps, we argue that the fractions not used for ancient DNA isolation could be used in parallel for isotopic analysis. However, experimental confirmation of lack of SPT reactivity is required.
Sedimentary samples may also be a good candidate substrate for the application of density separation for ancient DNA extraction, as it may provide a way to segregate bone elements from substantially heavier and lighter soil minerals that should be richer in environmental DNA. Similarly, the same is likely also true for petrous bone powder samples obtained through cranial base drilling of complete skulls, as these often include soil particles that become loose owing to drilling vibrations and are very hard to be completely excluded from the final powder (Sirak et al. 2017).
All these possibilities create an almost endless array of follow-up investigations to the application of density separation in the field of ancient DNA and may even open up new possibilities for re-evaluating old stored powders or bones that previously did not yield workable amounts of endogenous DNA. By using a nontoxic, inexpensive, and easily accessible chemical reagent and requiring only a microcentrifuge (which is a staple equipment in any molecular DNA laboratory), density separation using SPT can be integrated into any existing ancient DNA laboratorial pipeline as a pretreatment step before DNA extraction that optimizes DNA recovery.
Methods
Selection of density intervals through preliminary experimentation
By following existing research (Simmons et al. 1991; Bell et al. 2001) and to have a more general view of the distribution of ancient DNA during the first application of SPT density separation to archaeological bone powder, we initially separated 300 mg from three ancient individuals in 0.2 g/cm3 intervals for the range of 1.6 to 2.8 g/cm3. Because of an imperfect first adaptation of the method to ancient bone powders, most of the tested intervals were lost during processing and were not sequenced; however, we did obtain data that showed that the intervals below 2.00 and above 2.40 g/cm3 yielded no endogenous DNA or extremely small amounts. Instead, we found that most of the DNA was present between 2.20 and 2.40 g/cm3. This preliminary data were in agreement with the results of the existing literature, indicating that the best density intervals for ancient human bones was between 2.00 and 2.40 g/cm3 and, more specifically, between 2.30 and 2.40 g/cm3 for the more mineralized bone elements (Bell et al. 2001), and formed the basis for our future work. We therefore decided to analyze the 2.20–2.40 range, and to increase specificity and accuracy, we used smaller 0.05 intervals. Given the observation that even minute amounts of bone powder were being separated, instead of the large initial amount of 300 mg of powder, we subsequently used only 150 mg. Lastly, we also included one extra interval on each side, ending up with 2.15 and 2.45 g/cm3, plus the analysis of the elements below 2.15 and above 2.45, resulting in eight density intervals per sample plus the standard extraction in a total of 90 independent powder aliquots for DNA extraction and sequencing (<2.15, 2.20, 2.25, 2.30, 2.35, 2.40, 2,45, >2.45, standard extraction).
Sample selection and processing
Because of the varied chemical and physical composition of different skeletal elements and how they are affected by many different variables such as overall preservation, taphonomic pathways, chronological age, exposure to sudden environmental changes, and others, measured densities will vary on an individual and elemental basis. A global and optimal density separation method for every single individual or sample type is therefore very unlikely. For this study, to reduce the number of external variables that could affect ancient DNA yields and quality and therefore inhibit our ability to detect statistically significant patterns and trends, we decided to use two sets of skeletal elements from individuals with similar preservation. The petrous bones were processed according to published protocols (Pinhasi et al. 2019) in dedicated ancient DNA facilities at the Department of Evolutionary Anthropology of the University of Vienna, where the cochleae were isolated and milled to homogeneous powder in a Retsch ball mixer mill MM 400 at maximum frequency (30 Hz) for two 30-sec sessions with a 10-sec pause between to allow for the dissipation of any heat built up. Two powder aliquots were prepared for each individual: one of 150 mg for density separation, and another of 50 mg for ancient DNA extraction using traditional protocols.
Density separation and DNA extractions
SPT (TC-Tungsten Compounds) was chosen to create heavy liquid solutions owing to its ease and safety of use for the researcher, being inorganic, nontoxic, and highly soluble in water. Furthermore, it has a large density range (∼1.10 to 3.1 g/cm3) and is thought to be inert against DNA. On the other hand, changes in its pH (2–3) affect its stability and may lead to chemical modifications and the transformation into sodium paratungstate, which is insoluble in water, and when in contact with ethanol, SPT creates a white precipitate that may have an unknown effect on, or may inhibit, PCR reactions (R. Kamps, pers. comm.). DNA library inhibition was not assessed during our experiments as this white precipitate was never observed. To ensure precision down to the 0.05 g/cm3 intervals, we started by preparing SPT solutions for the eight specified densities by creating a calibration curve based on the 3° polynomial trend line of 15 measured densities (Supplemental Table S6). Before use, these SPT solutions were then UV irradiated for 10 min. Starting with the lowest density solution (2.15), 1 mL of it was transferred to a 2-mL Eppendorf tube containing 150 mg of bone powder, and the contents were thoroughly mixed by vortexing. After 4 min of centrifugation at maximum speed (20,238g), all powder elements heavier than the density used (here, 2.15 g/cm3) sank into a pellet, whereas the supernatant contained a suspension of elements ≤2.15 g/cm3. The supernatant was transferred into a new 2-mL tube and labeled according to its density interval: here, <2.15 (Fig. 1). Although not specifically required, wide-bore tips can be useful for this step. Then, 1 mL of the next density, 2.20, was transferred into the tube with the pellet, and the process was repeated. In this case, elements lighter than 2.20 (and heavier than the previous density, 2.15) remained in suspension, whereas the heavier elements, again, formed the pellet that was used for the next density separation. This process was then repeated for all densities. The last tube obtained using the SPT solution of 2.45 g/cm3 contained a pellet with elements heavier than 2.45 and a supernatant with elements between 2.40 and 2.45. As mentioned above, both were further processed, extracted, and sequenced.
After all separations were achieved, each tube with the newly separated elements suspended in 1 mL of SPT went through a wash and repelleting phase by adding 1 mL of TE buffer to each tube in order to lower the liquid solution's density and force the pelleting of the now-heavier bone elements. The addition of 1 mL of TE buffer lowers the density of the SPT solutions to between 1.67 and 1.73 g/cm3, for the 2.15 and the 2.40 tubes, respectively, which should be lower than any existing bone elements and, therefore, should force them to repellet. After vortexing, each tube was centrifuged at maximum speed for 4 min, and the supernatant containing low-density SPT + TE was discarded. To ensure a thorough removal of the SPT, this wash/repelleting step was repeated two times. Although not requiring repelleting, the >2.45 tube with the final pellet was also washed three times to remove all SPT traces. If this, or any other pellet, is somewhat large (e.g., >50–100 mg), using 2 mL of TE buffer per wash is suggested.
After the washes, all pellets were ready for standard DNA extraction, which was performed using the Dabney protocol (Dabney et al. 2013), as modified by Korlević and colleagues (2015), using preassembled high pure viral nucleic acid large-volume kit spin columns from Roche instead of a custom MinElute column apparatus.
Library preparation, quality control, and sequencing
Double-stranded DNA libraries were prepared according to a modified Meyer and Kircher (2010) protocol. Individual libraries were prepared from 12.5 µL extract each, and intermediate clean-up steps were performed using Qiagen MinElute PCR purification kits to retain very short fragments (∼30–80 bp). Before amplification, real-time qPCR of a small quantity of library (1 µL) was performed to assess the number of molecules present and choose the required number of cycles for amplification. All libraries were then double-indexed and amplified using Agilent PfuTurbo Cx Hotstart DNA polymerase. Before sequencing, libraries were quantified using Qubit and TapeStation or Bioanalyzer. The libraries, plus negative controls for each laboratorial step, were then sequenced on an Illumina NovaSeq SP SR100 XP at the Vienna BioCenter Core Facilities.
Data processing
Raw sequencing data were processed with cutadapt (v2.3) (Martin 2011) to remove library adapters and barcodes from the DNA sequences, allowing for 1-bp overlap and excluding sequences <18 bp. These sequences were then aligned to the human reference genome hg19, with the mitochondrial genome replaced by the RCRS sequence, using BWA's (v0.7.17-r1188) (Li and Durbin 2009) aln command with seeding disabled using -l 1000. We note that the great majority of published ancient DNA data has been aligned to the human genome reference hg19, and therefore, we did the same for consistency. Moreover, an alignment to GRCh38 would not be expected to alter our findings, as our results are based on quantitative comparisons of sample metrics, rather than on population genomic analyses. The alignments were then converted to the SAM format using BWA's samse command and, subsequently, again converted to BAM format with SAMtools view (v1.1) (Li et al. 2009) using the quality filter -q 30 and discarding unmapped sequences with -F 4. Duplicated sequences were removed using SAMtools’ rmdup command. Terminal deamination was assessed using mapDamage (v2.0) (Jónsson et al. 2013); contamination was assessed on the haploid X Chromosome of males using hapCon with a threshold of 0.02× or 2000 SNPs (Huang and Ringbauer 2021); and molecular sex was determined by looking at the fraction of sequences aligning to the Y Chromosome compared with the total fraction aligning to both sex chromosomes (Skoglund et al. 2013). To randomly subsample FASTQ files for reanalysis of merged libraries, seqtk (https://github.com/lh3/seqtk) was used. Library complexity curves were estimated using the lc_extrap command from preseq (v2.0.2) on the merged down-sampled BAM files before duplicate removal, with default settings (Daley and Smith 2013). Statistical significance tests were performed in R (v4.2.1) using the function wilcox.test(), as well as wilcox.exact() when ties were present, and the argument paired=TRUE (R Core Team 2022).
Data access
The raw sequencing data generated in this study have been submitted to the European Nucleotide Archive (ENA; https://www.ebi.ac.uk/ena/browser/) under accession number PRJEB60553.
Competing interest statement
The authors declare no competing interests.
Acknowledgments
We thank Michael Hofreiter and Nadin Rohland for their input and helpful discussions. Funding was provided by the University of Vienna Research Platform: Mineralogical Preservation of the Human Biome from the Depth of Time (MINERVA). S.S. was funded by the Austrian Science Fund (FWF) M3108-G. This work was also partially supported by a Young Investigator Award to D.M.F. from the Faculty of Life Sciences of the University of Vienna. The excavation of Castel Sozzio was funded by the Grandi Scavi program of the Sapienza University of Rome.
Notes
[1] Supplementary material [Supplemental material is available for this article.]
[2] Article published online before print. Article, supplemental material, and publication date are at https://www.genome.org/cgi/doi/10.1101/gr.277714.123.
References
- ↵Bell LS, Cox G, Sealy J. 2001. Determining isotopic life history trajectories using bone density fractionation and stable isotope measurements: a new approach. Am J Phys Anthropol 116: 66–79. 10.1002/ajpa.1103
- ↵Bell LS, Kayser M, Jones C. 2008. The mineralized osteocyte: a living fossil. Am J Phys Anthropol 137: 449–456. 10.1002/ajpa.20886
- ↵Boessenkool S, Hanghøj K, Nistelberger HM, Der Sarkissian C, Gondek AT, Orlando L, Barrett JH, Star B. 2017. Combining bleach and mild predigestion improves ancient DNA recovery from bones. Mol Ecol Resour 17: 742–751. 10.1111/1755-0998.12623
- ↵Booth TJ. 2016. An investigation into the relationship between funerary treatment and bacterial bioerosion in European archaeological human bone. Archaeometry 58: 484–499. 10.1111/arcm.12190
- ↵Brekhus PJ, Armstrong WD. 1935. A method for the separation of enamel, dentin, and cementum. J Dent Res 15: 23–29. 10.1177/00220345350150010401
- ↵Budd P, Millard A, Chenery C, Lucy S, Roberts C. 2004. Investigating population movement by stable isotope analysis: a report from Britain. Antiquity 78: 127–141. 10.1017/S0003598X0009298X
- ↵Busse B, Djonic D, Milovanovic P, Hahn M, Püschel K, Ritchie RO, Djuric M, Amling M. 2010. Decrease in the osteocyte lacunar density accompanied by hypermineralized lacunar occlusion reveals failure and delay of remodeling in aged human bone. Aging Cell 9: 1065–1075. 10.1111/j.1474-9726.2010.00633.x
- ↵Cameron JR, Skofronick JG, Grant RM, Siegel E. 1993. Medical physics: physics of the body. Am J Phys 61: 1156–1156. 10.1119/1.17319
- ↵Currey JD. 1984. The mechanical adaptations of bones. Princeton University Press, Princeton, NJ.
- ↵Dabney J, Knapp M, Glocke I, Gansauge M-T, Weihmann A, Nickel B, Valdiosera C, García N, Pääbo S, Arsuaga J-L, 2013. Complete mitochondrial genome sequence of a Middle Pleistocene cave bear reconstructed from ultrashort DNA fragments. Proc Natl Acad Sci 110: 15758–15763. 10.1073/pnas.1314445110
- ↵Daley T, Smith AD. 2013. Predicting the molecular complexity of sequencing libraries. Nat Methods 10: 325–327. 10.1038/nmeth.2375
- ↵Damgaard PB, Margaryan A, Schroeder H, Orlando L, Willerslev E, Allentoft ME. 2015. Improving access to endogenous DNA in ancient bones and teeth. Sci Rep 5: 11184. 10.1038/srep11184
- ↵Daniel JC, Chin K. 2010. The role of bacterially mediated precipitation in the permineralization of bone. Palaios 25: 507–516. 10.2110/palo.2009.p09-120r
- ↵Fu Q, Meyer M, Gao X, Stenzel U, Burbano HA, Kelso J, Pääbo S. 2013. DNA analysis of an early modern human from Tianyuan Cave, China. Proc Natl Acad Sci 110: 2223–2227. 10.1073/pnas.1221359110
- ↵Gamba C, Jones ER, Teasdale MD, McLaughlin RL, Gonzalez-Fortes G, Mattiangeli V, Domboróczki L, Kővári I, Pap I, Anders A, 2014. Genome flux and stasis in a five millennium transect of European prehistory. Nat Commun 5: 5257. 10.1038/ncomms6257
- ↵Gansauge M-T, Meyer M. 2013. Single-stranded DNA library preparation for the sequencing of ancient or damaged DNA. Nat Protoc 8: 737–748. 10.1038/nprot.2013.038
- ↵Gansauge M-T, Meyer M. 2019. A method for single-stranded ancient DNA library preparation. Methods Mol Biol 1963: 75–83. 10.1007/978-1-4939-9176-1_9
- ↵Gansauge M-T, Aximu-Petri A, Nagel S, Meyer M. 2020. Manual and automated preparation of single-stranded DNA libraries for the sequencing of DNA from ancient biological remains and other sources of highly degraded DNA. Nat Protoc 15: 2279–2300. 10.1038/s41596-020-0338-0
- ↵Ginolhac A, Rasmussen M, Gilbert MTP, Willerslev E, Orlando L. 2011. mapDamage: testing for damage patterns in ancient DNA sequences. Bioinformatics 27: 2153–2155. 10.1093/bioinformatics/btr347
- ↵Green RE, Briggs AW, Krause J, Prüfer K, Burbano HA, Siebauer M, Lachmann M, Pääbo S. 2009. The Neandertal genome and ancient DNA authenticity. EMBO J 28: 2494–2502. 10.1038/emboj.2009.222
- ↵Hansen HB, Damgaard PB, Margaryan A, Stenderup J, Lynnerup N, Willerslev E, Allentoft ME. 2017. Comparing ancient DNA preservation in petrous bone and tooth cementum. PLoS One 12: e0170940. 10.1371/journal.pone.0170940
- ↵Harney É, Cheronet O, Fernandes DM, Sirak K, Mah M, Bernardos R, Adamski N, Broomandkhoshbacht N, Callan K, Lawson AM, 2021. A minimally destructive protocol for DNA extraction from ancient teeth. Genome Res 31: 472–483. 10.1101/gr.267534.120
- ↵Hedges REM. 2002. Bone diagenesis: an overview of processes. Archaeometry 44: 319–328. 10.1111/1475-4754.00064
- ↵Hernandez CJ, Majeska RJ, Schaffler MB. 2004. Osteocyte density in woven bone. Bone 35: 1095–1099. 10.1016/j.bone.2004.07.002
- ↵Huang Y, Ringbauer H. 2021. hapCon: estimating contamination of ancient genomes by copying from reference haplotypes. Bioinformatics 38: 3768–3777. 10.1093/bioinformatics/btac390
- ↵Ibrahim J, Brumfeld V, Addadi Y, Rubin S, Weiner S, Boaretto E. 2022. The petrous bone contains high concentrations of osteocytes: one possible reason why ancient DNA is better preserved in this bone. PLoS One 17: e0269348. 10.1371/journal.pone.0269348
- ↵Jónsson H, Ginolhac A, Schubert M, Johnson PLF, Orlando L. 2013. mapDamage2.0: fast approximate Bayesian estimates of ancient DNA damage parameters. Bioinformatics 29: 1682–1684. 10.1093/bioinformatics/btt193
- ↵Kapp JD, Green RE, Shapiro B. 2021. A fast and efficient single-stranded genomic library preparation method optimized for ancient DNA. J Hered 112: 241–249. 10.1093/jhered/esab012
- ↵Kemp BM, Smith DG. 2005. Use of bleach to eliminate contaminating DNA from the surface of bones and teeth. Forensic Sci Int 154: 53–61. 10.1016/j.forsciint.2004.11.017
- ↵Kendall C, Eriksen AMH, Kontopoulos I, Collins MJ, Turner-Walker G. 2018. Diagenesis of archaeological bone and tooth. Palaeogeogr Palaeoclimatol Palaeoecol 491: 21–37. 10.1016/j.palaeo.2017.11.041
- ↵Korlević P, Gerber T, Gansauge M-T, Hajdinjak M, Nagel S, Aximu-Petri A, Meyer M. 2015. Reducing microbial and human contamination in DNA extractions from ancient bones and teeth. BioTechniques 59: 87–93. 10.2144/000114320
- ↵Lee Lyman R. 2021. Bone density and bone attrition. In Manual of forensic taphonomy (ed. Pokines JT, ), pp. 79–102. CRC Press, Boca Raton, FL.
- ↵Li H, Durbin R. 2009. Fast and accurate short read alignment with Burrows–Wheeler transform. Bioinformatics 25: 1754–1760. 10.1093/bioinformatics/btp324
- ↵Li H, Handsaker B, Wysoker A, Fennell T, Ruan J, Homer N, Marth G, Abecasis G, Durbin R, 1000 Genome Project Data Processing Subgroup. 2009. The Sequence Alignment/Map format and SAMtools. Bioinformatics 25: 2078–2079. 10.1093/bioinformatics/btp352
- ↵Martin M. 2011. Cutadapt removes adapter sequences from high-throughput sequencing reads. EMBnet.J 17: 10. 10.14806/ej.17.1.200
- ↵Meyer M, Kircher M. 2010. Illumina sequencing library preparation for highly multiplexed target capture and sequencing. Cold Spring Harb Protoc 2010: pdb.prot5448. 10.1101/pdb.prot5448
- ↵Nakatsuka N, Harney É, Mallick S, Mah M, Patterson N, Reich D. 2020. ContamLD: estimation of ancient nuclear DNA contamination using breakdown of linkage disequilibrium. Genome Biol 21: 199. 10.1186/s13059-020-02111-2
- ↵Pellegrini M, Pouncett J, Jay M, Pearson MP, Richards MP. 2016. Tooth enamel oxygen “isoscapes” show a high degree of human mobility in prehistoric Britain. Sci Rep 6: 34986. 10.1038/srep34986
- ↵Pinhasi R, Fernandes D, Sirak K, Novak M, Connell S, Alpaslan-Roodenberg S, Gerritsen F, Moiseyev V, Gromov A, Raczky P, 2015. Optimal ancient DNA yields from the inner ear part of the human petrous bone. PLoS One 10: e0129102. 10.1371/journal.pone.0129102
- ↵Pinhasi R, Fernandes DM, Sirak K, Cheronet O. 2019. Isolating the human cochlea to generate bone powder for ancient DNA analysis. Nat Protoc 14: 1194–1205. 10.1038/s41596-019-0137-7
- ↵Rasmussen KL, Milner G, Skytte L, Lynnerup N, Thomsen JL, Boldsen JL. 2019. Mapping diagenesis in archaeological human bones. Heritage Science 7: 41. 10.1186/s40494-019-0285-7
- ↵R Core Team. 2022. R: a language and environment for statistical computing. R Foundation for Statistical Computing, Vienna. https://www.R-project.org/.
- ↵Rohland N, Glocke I, Aximu-Petri A, Meyer M. 2018. Extraction of highly degraded DNA from ancient bones, teeth and sediments for high-throughput sequencing. Nat Protoc 13: 2447–2461. 10.1038/s41596-018-0050-5
- ↵Sawyer S, Krause J, Guschanski K, Savolainen V, Pääbo S. 2012. Temporal patterns of nucleotide misincorporations and DNA fragmentation in ancient DNA. PLoS One 7: e34131. 10.1371/journal.pone.0034131
- ↵Schroeder H, de Barros Damgaard P, Allentoft ME. 2019. Pretreatment: improving endogenous ancient DNA yields using a simple enzymatic predigestion step. Methods Mol Biol 1963: 21–24. 10.1007/978-1-4939-9176-1_3
- ↵Sillen A. 1981. Post-depositional changes in Natufian and Aurignacian faunal bones from Hayonim Cave. Paléorient 7: 81–85. 10.3406/paleo.1981.4300
- ↵Simmons EDJr, Pritzker KP, Grynpas MD. 1991. Age-related changes in the human femoral cortex. J Orthop Res 9: 155–167. 10.1002/jor.1100090202
- ↵Sirak KA, Fernandes DM, Cheronet O, Novak M, Gamarra B, Balassa T, Bernert Z, Cséki A, Dani J, Gallina JZ, 2017. A minimally-invasive method for sampling human petrous bones from the cranial base for ancient DNA analysis. BioTechniques 62: 283–289. 10.2144/000114558
- ↵Sirak K, Fernandes D, Cheronet O, Harney E, Mah M, Mallick S, Rohland N, Adamski N, Broomandkhoshbacht N, Callan K, 2020. Human auditory ossicles as an alternative optimal source of ancient DNA. Genome Res 30: 427–436. 10.1101/gr.260141.119
- ↵Skoglund P, Storå J, Götherström A, Jakobsson M. 2013. Accurate sex identification of ancient human remains using DNA shotgun sequencing. J Archaeol Sci 40: 4477–4482. 10.1016/j.jas.2013.07.004
- ↵Skoglund P, Northoff BH, Shunkov MV, Derevianko AP, Pääbo S, Krause J, Jakobsson M. 2014. Separating endogenous ancient DNA from modern day contamination in a Siberian Neandertal. Proc Natl Acad Sci 111: 2229–2234. 10.1073/pnas.1318934111