Figure 2.
Distribution (bar plots) and averages (colored lines) of endogenous DNA percentages after duplicate removal, per interval and per site, using the initial sequencing data (“Sequencing Group 1”) (Supplemental Table S1).
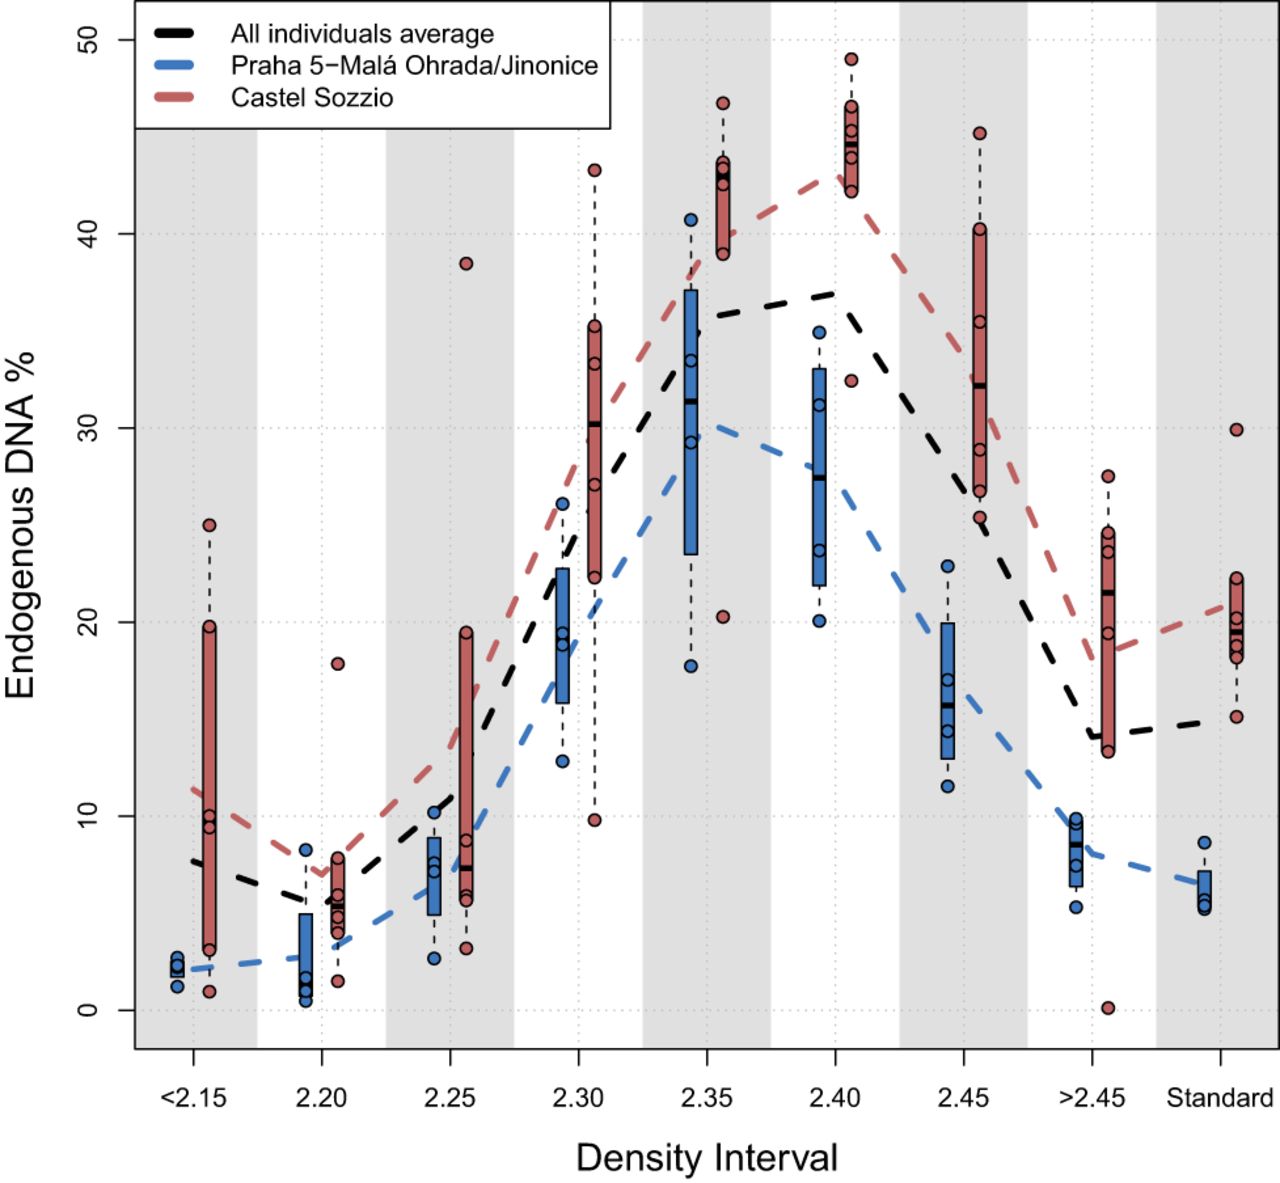
Distribution (bar plots) and averages (colored lines) of endogenous DNA percentages after duplicate removal, per interval and per site, using the initial sequencing data (“Sequencing Group 1”) (Supplemental Table S1).