
Mitochondrial DNA variation across 56,434 individuals in gnomAD
- Kristen M. Laricchia1,2,8,
- Nicole J. Lake3,4,8,
- Nicholas A. Watts1,2,
- Megan Shand1,
- Andrea Haessly1,
- Laura Gauthier1,
- David Benjamin1,
- Eric Banks1,
- Jose Soto1,
- Kiran Garimella1,
- James Emery1,
- Genome Aggregation Database Consortium7,
- Heidi L. Rehm1,2,
- Daniel G. MacArthur1,4,5,
- Grace Tiao1,2,9,
- Monkol Lek3,9,
- Vamsi K. Mootha1,6,9 and
- Sarah E. Calvo1,2,9
- 1Broad Institute of MIT and Harvard, Cambridge, Massachusetts 02142, USA;
- 2Massachusetts General Hospital, Boston, Massachusetts 02114, USA;
- 3Yale School of Medicine, New Haven, Connecticut 06510, USA;
- 4Murdoch Children's Research Institute, Melbourne, Victoria 3052, Australia;
- 5Garvan Institute of Medical Research and UNSW Sydney, Sydney, New South Wales 2010, Australia;
- 6Howard Hughes Medical Institute and Massachusetts General Hospital, Boston, Massachusetts 02114, USA
Abstract
Genomic databases of allele frequency are extremely helpful for evaluating clinical variants of unknown significance; however, until now, databases such as the Genome Aggregation Database (gnomAD) have focused on nuclear DNA and have ignored the mitochondrial genome (mtDNA). Here, we present a pipeline to call mtDNA variants that addresses three technical challenges: (1) detecting homoplasmic and heteroplasmic variants, present, respectively, in all or a fraction of mtDNA molecules; (2) circular mtDNA genome; and (3) misalignment of nuclear sequences of mitochondrial origin (NUMTs). We observed that mtDNA copy number per cell varied across gnomAD cohorts and influenced the fraction of NUMT-derived false-positive variant calls, which can account for the majority of putative heteroplasmies. To avoid false positives, we excluded contaminated samples, cell lines, and samples prone to NUMT misalignment due to few mtDNA copies. Furthermore, we report variants with heteroplasmy ≥10%. We applied this pipeline to 56,434 whole-genome sequences in the gnomAD v3.1 database that includes individuals of European (58%), African (25%), Latino (10%), and Asian (5%) ancestry. Our gnomAD v3.1 release contains population frequencies for 10,850 unique mtDNA variants at more than half of all mtDNA bases. Importantly, we report frequencies within each nuclear ancestral population and mitochondrial haplogroup. Homoplasmic variants account for most variant calls (98%) and unique variants (85%). We observed that 1/250 individuals carry a pathogenic mtDNA variant with heteroplasmy above 10%. These mtDNA population allele frequencies are freely accessible and will aid in diagnostic interpretation and research studies.
The genetic material of human cells is contained in the nucleus and mitochondria. The mitochondrial genome (mtDNA) is a circular molecule of 16,569 bp containing 37 genes that encode 13 proteins, 22 tRNAs, and two rRNAs (Anderson et al. 1981), all essential to mitochondrial electron transport and energy homeostasis. Depending on the tissue, human cells contain hundreds to thousands of copies of mtDNA. Because the maternally inherited mtDNA does not recombine and exhibits a 10× greater rate of polymorphism than nuclear DNA, it has been extremely useful in tracking human biogeography (Brown et al. 1979; Cann et al. 1987; Cavalli-Sforza 1998).
Pathogenic variants in the mtDNA account for ∼80% of adult-onset and ∼20% of pediatric-onset mitochondrial disease (Lott et al. 2013; Gorman et al. 2015, 2016). Pathogenic mtDNA variants can cause disease at homoplasmy or when heteroplasmy rises to high levels (Craven et al. 2017). These latter disorders are particularly challenging to diagnose because pathogenic variants can sometimes be observed at lower heteroplasmy levels and even absent in blood versus affected tissue and can decrease over time (Grady et al. 2018). For both homoplasmic and heteroplasmic variants, distinguishing those that are pathogenic from those that are benign is a challenge, especially as commercial and research entities now provide routine sequencing of the entire mtDNA.
Population frequency data are extremely helpful for the clinical interpretation of variants of uncertain significance (VUS) (McCormick et al. 2020). Until now, mtDNA variants have not been included in most large databases of genomic variation such as the Exome Aggregation Consortium (ExAC) (Lek et al. 2016), the Genome Aggregation Database (gnomAD) (Karczewski et al. 2020), and the BRAVO server (https://bravo.sph.umich.edu). Instead, four specialized databases provide easily accessible mtDNA population frequencies across humans: (1) MITOMAP (Lott et al. 2013) provides population frequencies from the NCBI GenBank database (which has heterogeneous data quality and is known to include individuals with disease); (2) HmtDB provides population frequencies from GenBank and from mitochondrial disease patients (Clima et al. 2017); (3) MSeqDR compiles population frequency data including MITOMAP, HmtDB, and GeneDx (Shen et al. 2018); (4) HelixMTdb uses proprietary exome technology on saliva samples to report homoplasmic and heteroplasmic variants for nearly 200,000 individuals (mainly of European ancestry), despite relatively low (∼180×) mean mtDNA coverage that can make it difficult to call heteroplasmic variants (Bolze et al. 2020). The first three mtDNA databases report only homoplasmic variants.
The Genome Aggregation Database is a widely used resource of human genomic variation developed by an international consortium which has aggregated whole-genome sequence (WGS) data from large-scale sequencing projects (see Methods). The data in gnomAD are analyzed jointly using a single pipeline and are depleted for Mendelian or severe pediatric diseases, as well as for cryptically related individuals, allowing for the computation of accurate and high-quality allele frequencies. Summary gene and variant metrics are made public for a range of diverse ancestral groups, including individuals of African and African-American, Amish, Latino and admixed American, Ashkenazi Jewish, East Asian, Finnish, non-Finnish European, Middle Eastern, and South Asian descent. gnomAD v2 contains 125,748 exomes and 15,708 genomes aligned to the GRCh37 human reference. gnomAD v3 contains 76,156 WGS samples aligned to the GRCh38 human reference and includes cohorts derived from controls and biobanks (∼16.5 K), the Trans-Omics for Precision Medicine (TOPMed) data set (∼35.7 K), nonpediatric neurological disease cohorts (∼8.7 K, including individuals with schizophrenia, Alzheimer's disease, migraines, bipolar, and affective and psychotic disorders), and others. Although not a random population sampling and the enrollment percentages from common diseases do not exactly represent the general population prevalence of these disorders, the population frequency data within gnomAD are useful for assessing involvement in severe pediatric disease and in later onset conditions when prevalence in the general population is taken into account. Unlike other large genomic databases such as UK Biobank (Bycroft et al. 2018; Yonova-Doing et al. 2021), gnomAD is an easily accessible public database that does not require fees, applications, or login and for which the allele frequencies are computed. The gnomAD resource has been widely used for both basic and clinical research, with ubiquitous adoption in clinical genetic diagnostic pipelines worldwide. However, analysis of the mtDNA has not been included in gnomAD until now.
The main challenge for mtDNA variant calling from WGS data is to distinguish low heteroplasmy variants from sample contamination, sequencing errors, and misalignment. Specifically, misalignment from nuclear sequences of mitochondrial origin (NUMTs) is particularly problematic because the reference genome contains several hundred ancient NUMTs (Li et al. 2012) and hundreds of “polymorphic NUMTs” not present in the reference genome (Dayama et al. 2014), including rare instances of large, tandemly repeated mega-NUMTs (Wei et al. 2020; Lutz-Bonengel et al. 2021). In addition, the circular mtDNA molecule can present alignment challenges, and many alignment algorithms show a drop of coverage at the artificial ends of the linearized mtDNA. Because nuclear variant pipelines are not suitable for mtDNA variant calling, the mtDNA has not been routinely analyzed by many WGS projects.
Multiple tools exist to call mtDNA variants. Tools such as mtDNA-Server (Weissensteiner et al. 2016a), MToolBox (Calabrese et al. 2014), and mity (Puttick et al. 2019) have been designed specifically to call heteroplasmic and homoplasmic variants. mtDNA-Server specifically identifies contamination, and MToolBox aims to avoid misalignment of NUMTs in the reference assembly but cannot avoid polymorphic NUMTs. Other tools not specifically designed for mtDNA can be adapted to call heteroplasmic variants, such as GATK Mutect2 (Benjamin et al. 2019), which was originally designed to identify subclonal variants in cancer. Many of these tools are easy to run; however, by themselves, they do not address issues such as contamination and false positives from misalignment.
Here, we describe the methods used to accurately call mitochondrial variants in gnomAD WGS samples and create an easily accessible database of population frequency useful for clinicians and researchers at gnomad.broadinstitute.org.
Results
mtDNA coverage varies across cohorts in gnomAD
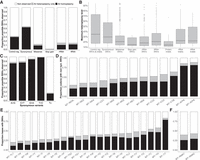
WGS provides even coverage across the mtDNA for all 70,375 gnomAD v3 samples available for analysis (Fig. 1A). However, we find that mtDNA coverage, as well as mtDNA copy number per cell (mtCN), vary widely across gnomAD cohorts, independent of nuclear coverage (Fig. 1B–E). This variation likely depends on source material (e.g., blood, buffy coat, cell line, tissue) and DNA extraction protocol; however, such annotations are available only for a subset of samples. A typical blood sample with 30× nuclear coverage shows ∼2700× mtDNA coverage. We estimate mtCN as 2 m/n where m is mean mtDNA coverage and n is median nuclear coverage. As expected, mtCN varies by source material. Blood samples show two distinct peaks (median 40 for TOPMED COPD and 207 for NHLBI cohorts) possibly associated with DNA extraction kits or blood cell types collected (Fig. 1E). Cell lines typically have 500–1200 mtDNA copies per cell. A small number of samples with outlier mtCN > 2000 are derived from tissue samples such as heart, adrenal, and kidney.
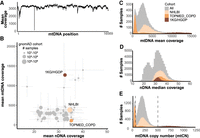
Coverage statistics for 70,375 gnomAD WGS samples. (A) Per-base mean depth of coverage across mtDNA, with coverage dips at positions 303–315 (Tan et al. 2016) and 3107 (Bandelt et al. 2014) due to homopolymeric tract and Chr M reference deletion, respectively. (B) For each cohort within gnomAD, a scatterplot shows the mean nuclear (nDNA) and mtDNA coverage ± standard deviation. Three example cohorts are shown in color: 1000 Genomes and Human Genome Diversity Project cell lines (1KG/HGDP), NHLBI, and TOPMed Chronic Obstructive Pulmonary Disease (TOPMED COPD). (C) Histogram shows mean mtDNA coverage for all samples, and overlaid histograms show three selected cohorts (806 outliers with coverage 15,000–97,000 excluded). We note mean and median mtDNA coverage statistics are extremely similar (Pearson's r = 0.99997). (D) Histogram shows median nDNA coverage for all samples, and overlaid histograms show three selected cohorts (84 outliers with coverage 60–94 excluded). (E) Histogram shows mtDNA copy number per cell (2 × mean mtDNA coverage/ median nDNA coverage) for all samples, and overlaid histograms show three selected cohorts (223 outliers with mtCN 1250–7000 excluded). Only samples with mtCN 50–500 (dashed lines) were included in the released mtDNA call set (56,434/70,375).
Pipeline for mtDNA variant calling in individual samples
We developed a high-throughput GATK pipeline to call homoplasmic and heteroplasmic variants in mtDNA from whole-genome sequence data (Fig. 2A). WGS was aligned to the reference genome using BWA-MEM (Li 2013). Only mate-pairs with both reads mapping to Chr M were used for variant calling, after excluding duplicate pairs. Variants were called using the GATK Mutect2 variant caller (Benjamin et al. 2019), parameterized via a specific “mitochondria mode” designed to account for high coverage and potential low-heteroplasmy variants. To call variants in the control region that spans the artificial break in the circular genome (coordinates Chr M: 16,024–16,569 and Chr M: 1–576), we extracted all Chr M reads and realigned them to a mtDNA reference that was shifted by 8000 bases, called variants on this shifted alignment, and then converted coordinates back to their original positions. Variants showing weak evidence or strand bias were then filtered. Variant allele fraction (VAF) was calculated as the fraction of alternate reads to total reads for each variant and sample. We denote variants with VAF 0.95–1.00 as homoplasmic or near homoplasmic, and variants with VAF < 0.95 as heteroplasmic.
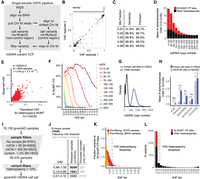
mtDNA call set is designed to exclude NUMT-derived false positives (NUMT-FPs), cell line artifacts, and contaminants. (A) Schematic shows GATK pipeline for calling mtDNA variants in single WGS samples. The control region spans the artificial break in Chromosome M sequence. (B) Reproducibility of GATK pipeline on 91 WGS replicate samples shows 99.3% concordance of calls (2533/2551), and density plot at top shows 87% variants are homoplasmic. (C) Accuracy of single-sample pipeline in samples with mtCN > 500 based on “in silico” mixing data. Note these are valid only for samples with high mtCN. (D) Bar chart shows that the mean number of putative heteroplasmies per sample depends on mtDNA copy number (mtCN), as does the subset occurring at 25 validated NUMT-FP sites (red). (E) Scatterplot shows the observed VAF for a single NUMT-FP (m.16293A > C) across 6844 samples versus the theoretical VAF if the NUMTs were heterozygous and all reads misaligned to the mtDNA. (F) Plot shows VAF levels for NUMT-FP sites decrease with mtCN (colored lines). Y-axis indicates the percent of detected variants that occur at 25 NUMT-FP sites. (G) Density plot shows mtCN for known cell lines and all other samples. (H) Bar plot shows that known cell lines have increased number of heteroplasmic variants in all categories compared to samples with mtCN 50–500 (enrichment shown with *** indicates P-value < 1 × 10⁻⁵ based on Fisher's exact test); pLOF indicates predicted loss-of-function. (I) Schematic shows steps for combining and filtering single-sample variant calls into the gnomAD mtDNA call set, designed to exclude NUMT-derived false positives, cell line artifacts, and contaminants. (J) Number of unique variants that pass filters (bold black) versus those filtered out based on VAF (black) or not released (gray). The 19,137 variants are partitioned into mutually exclusive categories; for example, VAF 0.10–0.95 excludes variants also detected VAF 0.95–1.00. (K) For each VAF level, bar chart shows the fraction of variants at 25 NUMT-FP sites before sample filtering (red) or after filtering (orange, shown overlaid). (L) Histogram of VAF (after sample filtering) shows that below 10% VAF, there are a large number of variants and a substantial fraction present at 25 validated NUMT-FP sites (red). X-axis label indicates upper bound of VAF bin.
We assessed the reproducibility of our pipeline using 91 samples for which replicate WGS was available (Fig. 2B). We observed 99.3% concordance for all variants with VAF ≥ 0.01, where concordance is defined as the number of variants detected in both samples/number of variants detected in either sample. Some of the highly discordant calls were derived from cell lines, which may have accumulated mutations over the times sampled.
To assess sensitivity and precision at different heteroplasmy levels, we created in silico mixtures of samples (Fig. 2C) to model variants at specific VAF levels (0.01, 0.05, 0.50, 0.90, 0.99). We mixed truth data from cell line NA12878 with each of 22 African-haplogroup samples to increase the total number of variants (1200 variants at 286 positions, including eight indels). For VAF ≥ 0.05, we observed excellent sensitivity (99%–100%) and precision (98.9%–99.7%), where sensitivity indicates the percent of true variants that are detected, and precision indicates the percent of detected variants that are true positives. Sensitivity dropped to 32% for variants at 0.01 VAF. Compared to the mtDNA-Server algorithm, GATK Mutect2 had higher precision at all heteroplasmies, similar sensitivity for VAF 0.05–0.99, but reduced sensitivity for VAF 0.01 variants (Supplemental Fig. S1).
We note that this in silico approach uses cell lines and does not account for possible NUMT-misalignment, which we show is very problematic for samples with low mtDNA copy number.
NUMT-derived false positives anticorrelate with sample mtDNA copy number and VAF
When we applied this variant calling pipeline to 70,375 available whole genomes in gnomAD v3.1, we observed that the number of candidate heteroplasmies per sample was anticorrelated with sample mtCN (Fig. 2D). This observation was consistent with false positives derived from NUMT-misalignment. Theoretically, a misaligned heterozygous NUMT will have VAF approximately 0.5 n/(0.5 n + m) or 1/(1 + mtCN), where n is nuclear coverage and m is mtDNA coverage and mtCN = 2 m/n. We observed several dozen common variants whose VAF correlated with 1/(1 + mtCN) (e.g., m.16293A > C) (Fig. 2E) and that were often linked in cis to each other (Supplemental Table S1). We hypothesized that these were derived from polymorphic NUMTs, that is, NUMTs present in some individuals but not in the reference genome assembly. We validated two polymorphic NUMTs using long-read Pacific Biosciences (PacBio) data: numtA (871-bp insertion from Chr M: 12,361–13,227 into Chr 21: 9,676,568), and numtB (536-bp insertion from Chr M: 16,093–Chr M: 59 into Chr 11: 49,862,017). When misaligned to the reference mitochondrial genome, these two NUMTs together yielded 25 common false-positive calls that we term NUMT-derived false positives (NUMT-FPs) (Supplemental Fig. S2; Supplemental Table S1). Some of the false positives were properly filtered out by strand bias, but others passed our variant filters. Using unfiltered variant calls, we estimate numtA and numtB are each present in ∼40% of individuals in our data set (Supplemental Table S1; Supplemental Fig. S2).
Next, we aimed to estimate the extent of NUMT-misalignment and how it relates to sample mtCN and VAF. As a lower bound, we can assess the percent of variants at each VAF level located at these 25 NUMT-FP sites (requiring each NUMT to be supported by at least two NUMT-FP per sample). As expected, the 25 NUMT-FPs were more problematic for samples with low mtCN and for variants with low VAF (Fig. 2F). Samples with extremely low mtCN (<50) showed substantial NUMT-FP exceeding 0.15 VAF. For mtCN 50–75, there were detectable NUMT-FP variants up to 0.10 VAF. For samples with mtCN 75–100, there were substantial NUMT-FPs up to 0.05 VAF. For samples with mtCN > 500, there were almost no NUMT-FPs with VAF ≥ 0.01. As expected, shorter WGS insert sizes also cause greater misalignment (Supplemental Fig. S3). The true extent of NUMT-derived false positives (NUMT-FPs) is likely to be much higher, and this analysis considers only two common NUMTs, whereas there are hundreds of known polymorphic NUMTs (Dayama et al. 2014) and hundreds of NUMTs yet to be identified.
Given these large numbers of false positive calls for variants with VAF < 0.10, for the initial release we chose to exclude samples with mtCN < 50 and to report only variants with VAF ≥ 0.10, as we have greater confidence that such variants represent genuine heteroplasmies and not NUMT-derived false positives (Fig. 2F).
We note that misalignment due to NUMTs not only causes false-positive calls at low VAF but also can cause truly homoplasmic variants to appear heteroplasmic, with the reference alleles derived from the misalignment of a NUMT. Because of this, we term all variants with VAF 0.95–1.00 as “homoplasmic” or “near-homoplasmic” (Supplemental Fig. S4).
Cell lines show excess deleterious heteroplasmies
Whereas not all samples have annotations of source material, the 3436 known cell lines account for the majority of the 5633 samples with mtCN > 500 (Figs. 1E, 2G). Samples annotated to be cell lines show significantly elevated numbers of heteroplasmies (VAF 0.10–0.95), with a particular excess of potentially deleterious variants (loss of function, missense, tRNA, and rRNA) compared to synonymous and noncoding variants (Fig. 2H). These data show that cell lines accumulate mutations and suggest that deleterious mtDNA variants may be tolerated in cell culture.
Filtering gnomAD samples and variants
We performed stringent filtering of samples to create a high-quality mtDNA variant call set (Fig. 2I). Specifically, we excluded: (1) 6505 samples with mtCN < 50 to avoid excessive misalignment due to NUMTs; (2) 5633 samples with mtCN > 500, because these were primarily cell lines and enriched with what appear to be cell culture-derived variants; and (3) 1803 samples with contamination exceeding 2% based on estimates from the nuclear DNA or mitochondrial DNA, because samples with low nuclear contamination can still have substantial mtDNA contamination. No data from these excluded samples are provided in the release.
In the remaining 56,434 samples, we conservatively report only mtDNA variants with VAF ≥ 0.10 (Supplemental Table S2). Of this number, 10,850 unique variants pass our thresholds whereas the remainder (including variants VAF 0.01–0.10) (Fig. 2J) are available as filtered variants in download files and on the web portal but are plagued with false positives (Fig. 2K). Using just two validated NUMTs, we calculate a lower bound for NUMT-misalignment, which accounts for 43% of all variant calls VAF 0.01–0.05, 1% of all variants VAF 0.05–0.10, and virtually 0% of variants in other heteroplasmy bins (Fig. 2L). Variants enriched for false positives are annotated and highlighted in the web browser, for example, using the “common_low_heteroplasmy” flag (variants detected at VAF 0.001–0.50 in >56 individuals), “artifact_prone_site” filter, “indel_stack” filter, or “no pass genotype” filter (see Methods; Supplemental Table S2). Because variants with VAF 0.10–0.95 have few false positives, we refer to these as heteroplasmies.
mtDNA variants across 56,434 gnomAD samples
We release high-confidence mtDNA variants for 56,434 samples that pass our quality control filters. These samples exhibited median 2700× mtDNA coverage and 184 mtCN (Supplemental Fig. S5). Overall, 8793 of the 16,569 mtDNA nucleotides had a variant (53%) (Fig. 3A). We observed 10,850 unique variants, including 10,434 SNVs (96%) and 416 indels (4%), with SNVs being predominantly transitions rather than transversions (Fig. 3A). Of the 1.9 M total variant calls, 98% were homoplasmic or near-homoplasmic and 2% were heteroplasmic (40,706 variant calls 10%–95% heteroplasmy) (Fig. 3A; Supplemental Fig. S5D). The 9209 unique homoplasmic variants include known haplogroup markers (46%) as well as a large number of rare variants. Homoplasmic variants showed a range of population frequencies (Fig. 3B,C).
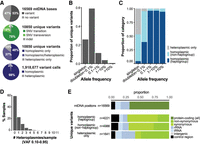
gnomAD mtDNA variant statistics. (A) Pie charts summarize statistics on mtDNA bases with variants, unique variants, and total variant calls. (B) Bar plot shows the proportion of unique mtDNA variants detected at different population allele frequencies in gnomAD v3.1. (C) Bar chart shows the proportion of variants that are observed only at 10%–95% heteroplasmy (gray) or observed at homoplasmy (blue) including those that are known haplogroup markers in Phylotree (dark blue). (D) Histogram shows number of heteroplasmies per sample (VAF 0.10–0.95). (E) Stacked bar charts show the distribution of variant annotations in the entire mtDNA and for unique variants that are homoplasmic or only observed at heteroplasmy.
The majority of samples had no heteroplasmies with VAF 0.10–0.95 (Fig. 3D). We note that 5205 (48%) unique variants were observed only at homoplasmy, 4004 (37%) were observed both as homoplasmic and heteroplasmic, and 1641 (15%) were observed only at heteroplasmy (Fig. 3A). Most unique variants observed only at heteroplasmy were found in only one or two samples (Fig. 3B,C). Heteroplasmic variants detected in at least two individuals were rarely from the same haplogroup (Supplemental Fig. S4G), consistent with recurrent mutations. Variants observed only at heteroplasmy showed increased nonsynonymous and RNA gene changes, whereas variants observed at homoplasmy showed higher prevalence of synonymous and noncoding variants (Fig. 3E).
This gnomAD release contains 997 variants not previously observed in MITOMAP or HelixMTdb databases. Compared to MITOMAP (51,836 samples, 11,903 unique variants), gnomAD contains 1222 additional homoplasmic SNVs (10% increase), and the 7682 homoplasmic SNVs detected in both databases show highly similar allele frequencies (Pearson's correlation 0.98) (Supplemental Fig. S5E). Similarly, compared to HelixMTdb (195,983 samples, 14,324 unique variants), gnomAD contains 712 additional homoplasmic variants (6% increase), and the 8497 homoplasmic variants detected in both databases show highly similar allele frequencies (Pearson's correlation 0.97) (Supplemental Fig. S5F,G).
Haplogroups versus nuclear ancestry
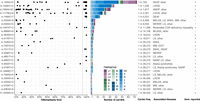
Because mtDNA does not recombine and is inherited maternally, closely related mtDNA sequences have historically been grouped together in “haplogroups.” There are 5184 haplogroups from diverse populations available in the Phylotree database (van Oven and Kayser 2009) and broadly associated with African, Asian, and European ancestry (Lott et al. 2013). Samples in gnomAD v3.1 spanned 61% of the haplogroups defined by Phylotree and provide representation from 29/33 of the top-level haplogroups (missing L6, Q, O, S) (Fig. 4A). Forty-six percent of gnomAD v3.1 homoplasmic unique variants were known haplogroup markers, and 4250/4571 (93%) of all haplogroup markers were observed in the data set, emphasizing the haplogroup and population diversity of the samples included in the current release. The mtDNA reference sequence in hg38, also known as the revised Cambridge Reference Sequence (rCRS), belongs to the European top-level haplogroup H (Andrews et al. 1999). Accordingly, the number of homoplasmic mtDNA variants per person in gnomAD increased as distance from the reference haplogroup in the phylogenetic tree increased, where individuals of European haplogroups typically had 0–50 variants, Asian haplogroups typically had 25–50 variants, and African haplogroups typically had 50–100 variants (Fig. 4B). In contrast, the number of heteroplasmic variants was similar across haplogroups (Supplemental Fig. S6).
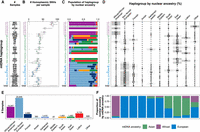
gnomAD v3.1 samples by mtDNA haplogroup and nuclear ancestry. (A) The number of samples is shown by mtDNA top-level haplogroup. Color indicates mtDNA haplogroups phylogenetically associated with African (purple), Asian (green), or European (blue) origin (Lott et al. 2013). (B) For each haplogroup, box plots show the number of homoplasmic SNVs per sample compared to the GRCh38 reference genome (haplogroup H) with the median shown in color. (C) For each haplogroup, stacked bar charts show nuclear ancestry from nuclear genome analysis, with colors as in panel E. (D) For each haplogroup, the percentage of samples from each inferred nuclear ancestry is shown in a heat map. Dash indicates 0 samples, and 0 indicates a percentage between 0–1. (E) The number of samples is shown by inferred nuclear ancestry. (F) For each inferred nuclear ancestry shown in panel D, stacked bar chart shows mtDNA haplogroups phylogenetically associated with African (purple), Asian (green), or European (blue) origin (Lott et al. 2013).
gnomAD annotates sample ancestry based on principal components analysis of the nuclear genome (Fig. 4C–E; Karczewski et al. 2020). The 56,434 samples were predominantly of European (58%) and African (25%) ancestry with lower representation from Latino and admixed American (10%), East Asian (3%), and South Asian (3%) ancestral populations (Fig. 4E). The mtDNA haplogroups were largely concordant with nuclear ancestry (Fig. 4C,F), consistent with previous studies (Wei et al. 2019).
Patterns of variation in mtDNA genes
Unlike the nuclear genome, ∼90% of the mtDNA encodes protein or RNA genes, and only 10% is intergenic. The proportion of possible SNVs observed was consistent with selection against nonsynonymous and RNA variation. Specifically, 55% of all possible synonymous variants were observed, but only 10% of possible missense and RNA variants, and 1% of possible stop gain variants were observed (Fig. 5A). We also observed fewer possible SNVs in the noncoding control region compared to synonymous variants (Fig. 5A), and this held true within the hypervariable region and when limiting to transitions (Supplemental Fig. S7A). The proportion of variants observed at homoplasmy and the median maximum heteroplasmy of heteroplasmic variants decreased as the predicted severity of the variant type increased (Fig. 5B; Supplemental Fig. S7B–D). SNV and indel variants in the RNA genes showed a similar pattern of heteroplasmy to each other. Only two predicted loss-of-function variants were homoplasmic in gnomAD (one stop gain and one frameshift). However, manual inspection revealed neither is likely a true loss-of-function, as the frameshift can result in a protein of the same length, and the stop gain is rescued by a multinucleotide variant in the same codon (Supplemental Table S3).
Patterns of variation in the mtDNA in gnomAD. (A) The bar chart shows the proportion of possible SNVs observed, partitioned into those observed at homoplasmy (black), only at 10%–95% heteroplasmy (gray), or not observed (white). (B) The box plot shows the maximum heteroplasmy of variants observed only at heteroplasmy. Protein indels include frameshift and in-frame variants. “Control reg.” represents the noncoding control region m.16024-576 in A and B. (C) The bar chart shows the proportion of possible synonymous variants observed in gnomAD for transversions (Tv) and all possible transitions (A > G, C > T, G > A, T > C) on the reference strand. (D) The bar chart shows the proportion of codons in protein-coding genes with nonsynonymous SNVs observed. (E,F) The proportion of bases in tRNA and rRNA genes with SNVs. Panels C–F follow the color legend in A.
Transitions predominate over transversions across the mtDNA, where T > C and G > A mutations are associated with the highest mutability (Ju et al. 2014). Approximately 95% of possible synonymous T > C and G > A variants were observed at homoplasmy (Fig. 5C), suggesting that the size of this data set is near saturation for this highly mutable, weakly negatively selected variant type. We note that nearly all of the possible G > A synonymous variants not seen at homoplasmy were within AUG codons that were either a start codon (c.3G > A) or the third codon of a gene with an AUA start codon (Supplemental Table S4). In the mitochondria, AUG and AUA both code for methionine, although modification of the mitochondrial tRNAMet is required to pair with AUA (Van Haute et al. 2017). In the nine genes with AUG start codons, a c.3G > A variant was never observed at homoplasmy in gnomAD, nor in HelixMTdb, and was absent or seen once in MITOMAP (Supplemental Table S4; Lott et al. 2013; Bolze et al. 2020). Collectively, these observations suggest selection against AUA at AUG start codons.
To provide insight into gene-level tolerance of variation, we assessed the proportion of nonsynonymous codon changes in protein-coding genes and base changes in RNA genes. Among protein-coding genes, the proportion of codons with a nonsynonymous variant ranged from 30%–90%, suggesting that some proteins are more tolerant of variation (Fig. 5D). For example, complex V genes MT-ATP8 and MT-ATP6 showed the highest proportion of codons with nonsynonymous variation, whereas complex I genes had the lowest proportion. Among the RNA genes, the proportion of bases with a variant ranged from 20%–85%, indicating that specific RNAs may be more tolerant of variation, especially MT-TT (Fig. 5E,F).
Prevalence of known pathogenic mtDNA variants in gnomAD
We calculated the carrier frequency of the 94 variants listed as “confirmed” pathogenic in MITOMAP, including 56 reported to cause disease at heteroplasmy (typically > 60% heteroplasmy) and 38 reported to cause disease at homoplasmy or both at homoplasmy and heteroplasmy (Lott et al. 2013; Craven et al. 2017). In gnomAD, we observe 26 pathogenic variants in 231/56,434 individuals, equating to a total carrier frequency of ∼1 in 250 individuals (Fig. 6). Fewer variants associated with disease only at heteroplasmy were observed in gnomAD relative to those associated with disease at homoplasmy (16% vs. 45%), consistent with the expectation that the latter group includes milder mutations (Supplemental Fig. S8A; Craven et al. 2017). Eleven pathogenic variants were observed at homoplasmy, most of which are reported to be incompletely penetrant and/or associated with adult-onset disease when homoplasmic (including nonsyndromic hearing loss, aminoglycoside-induced hearing loss, Leber Hereditary Optic Neuropathy (LHON), or reversible myopathy). One of these variants seen at homoplasmy in gnomAD was not associated with disease at homoplasmy in MITOMAP (m.8993T > C); however, it has recently been described in adult-onset cases at homoplasmy (Stendel et al. 2020). Across all pathogenic variants, m.1555A > G had the highest carrier frequency (1 in ∼750) (Fig. 6), and m.3243A > G and m.8344A > G variants had the highest carrier frequency among those only observed at heteroplasmy (∼1 in 10,000) (Fig. 6).
Known pathogenic variants in gnomAD. Shown are the 26 pathogenic variants observed in gnomAD along with their heteroplasmy levels, haplogroup distribution, carrier frequency, MITOMAP-curated disease phenotypes, and indicator showing whether disease occurs at homoplasmy (Hom. reported; note this includes variants only associated with disease at homoplasmy, or at both homoplasmy and heteroplasmy). The carrier frequency is calculated as the high-quality allele count divided by the number of individuals with high-quality sequence at the position. The dark gray line at the 95% heteroplasmy level represents the threshold used to define homoplasmic variant calls. Haplogroups are ordered by their position in the phylogenetic tree and colored by their association with African (purple), Asian (green), or European (blue) ancestry. (AMDF) Ataxia, myoclonus, and deafness, (COX) cytochrome c oxidase, (DEAF) maternally inherited deafness or aminoglycoside-induced deafness, (EXIT) exercise intolerance, (LHON) Leber Hereditary Optic Neuropathy, (LS) Leigh syndrome, (MELAS) mitochondrial encephalomyopathy, lactic acidosis, and stroke-like episodes, (MERRF) myoclonic epilepsy and ragged red muscle fibers, (MLASA) mitochondrial myopathy, lactic acidosis, and sideroblastic anemia, (MM) mitochondrial myopathy, (NARP) neurogenic muscle weakness, ataxia, and retinitis pigmentosa, (SNHL) sensorineural hearing loss, (other) other phenotypes listed for this variant in MITOMAP.
Mitochondrial DNA specifications of the American College of Medical Genetics and Association of Molecular Pathology (ACMG/AMP) guidelines for sequence variant interpretation state that allele frequency in population databases <0.00002 or >0.005 can provide evidence of pathogenicity or benign impact, respectively, where analysis of homoplasmic databases was used to determine these thresholds (McCormick et al. 2020). Consistent with this guideline, none of the pathogenic mtDNA variants in gnomAD had a homoplasmic allele frequency (AF_hom) that satisfied benign variant frequency criteria (AF_hom > 0.005 for benign strong BS1, or AF_hom > 0.01 for benign stand-alone BA1). Approximately 90% of the 94 known pathogenic variants had AF_hom < 0.00002, satisfying the pathogenic supporting criteria PM2_supporting for variant frequency; this included all of the variants only associated with disease at heteroplasmy (Supplemental Fig. S8B). All pathogenic variants also had AF_hom < 0.005 within haplogroups and populations (Supplemental Fig. S8B). Analysis of the heteroplasmic allele frequency (AF_het) of pathogenic variants showed that all were <0.005 and that ∼85% were <0.00002 (Supplemental Fig. S8B). Consistent with recent observations in the UK Biobank and HelixMTdb, the AF_hom of m.14484T > C was greater than the maximum credible population AF reported by Bolze et al. (0.00053 vs. 0.00023), lending support to the suggestion that this variant alone may not cause LHON (Bolze et al. 2020).
Discussion
Here, we present a pipeline for calling homoplasmic and heteroplasmic mtDNA variants and its application to gnomAD v3.1. To our knowledge, this represents the first easily accessible database of both nuclear and mtDNA variants from WGS data and the only database with heteroplasmic variants aside from HelixMTdb. We present a conservative set of variants based on WGS from 56,434 individuals, after stringent filtering of samples with low mtDNA copy number, samples derived from cell lines, and samples with high contamination. Moreover, we have chosen to report heteroplasmic variants that are occurring at a level of 10% or greater. As expected, the vast majority of variant calls were homoplasmic, including nearly all known haplogroup markers and thousands of additional rare homoplasmic variants. Most heteroplasmies occurred at variants that were observed at homoplasmy in at least one individual. The gnomAD data set and web browser provide detailed information for each variant, including predicted functional consequence, distribution of heteroplasmy levels, maximum observed heteroplasmy, and population allele frequencies (both aggregated per haplogroup and per nuclear ancestry population).
Our analyses show that misalignment of polymorphic NUMTs contributes to high false-positive mtDNA variant calls in WGS, particularly for variants with low putative heteroplasmy and for samples with low mtDNA copy number (Fig. 2D,K). Using two polymorphic NUMTs not in the reference human genome assembly that we validated using PacBio sequencing, we estimate a lower bound for NUMT-derived false positives. In samples with mtCN < 50, NUMT-FPs account for the majority of putative heteroplasmies VAF 0.01–0.10 (Fig. 2F). Conversely, in samples with mtCN > 500 (e.g., tissues and cell lines), NUMT-FPs show putative heteroplasmy substantially less than 0.01 and thus are typically not a problem. Even after excluding samples with mtCN < 50 and mtCN > 500, we observe that 50% of variants with VAF 0.01 are NUMT-FPs (Fig. 2K). These NUMT-FPs are also called by tools such as mToolBox that exclude reads mapping to both mitochondrial and nuclear genomes, because such approaches cannot account for polymorphic NUMTs. Our data suggest that, for Illumina WGS data, with insert sizes ∼375 bp, the NUMTs in the reference genome do not cause substantial false positives, whereas reads from NUMTs that are not found in the reference genome will misalign to the mtDNA genome. To our knowledge, there are no estimates of NUMT-FPs from HelixMTdb or WGS studies focusing on heteroplasmies (Wei et al. 2019).
Given these findings, and to avoid NUMT-FPs, we employ stringent sample filtering and release only variants with heteroplasmy ≥ 10%. Future releases may develop more sophisticated approaches to define a sample-specific heteroplasmy threshold to exclude NUMT-derived artifacts or may reduce the threshold to 5%. Ultimately, long-read sequencing technologies will be required to fully address the NUMT misalignment problem.
Our data show that known cell lines harbor excess heteroplasmies, including excess deleterious variants (Fig. 2H). These findings likely result from relaxed selection pressures in high-glucose cell culture conditions that may be permissive for accumulation of mtDNA variants that are deleterious in vivo. We note that this finding is of particular importance, given emerging technologies that culture patient-derived cells ex vivo before transplantation into the individuals (e.g., CAR-T and stem cell therapies), and may warrant further study (Perales-Clemente et al. 2016).
Our pipeline has several limitations. The pipeline is available and easy to run within a scalable cloud-based framework but may need modifications to deploy on local compute resources. However, the Mutect2 “mitochondria-mode” variant caller is easy to run and provides comparable results to other stand-alone tools such as mtDNA-Server and mToolBox. These tools show different trade-offs; for example, mtDNA-Server shows higher sensitivity for variants with 1% heteroplasmy at the cost of reduced precision. For analysis of other cohorts, less stringent sample and heteroplasmy filtering may be more appropriate depending on mtCN observed in the cohorts. This reported pipeline only calls SNVs and indels but does not report larger structural variation such as duplications, deletions, and inversions.
Analyses of variants in gnomAD are broadly consistent with previous studies of human mtDNA variation. We observed a carrier frequency of ∼1 in 250 individuals (VAF 0.10–1.00), consistent with estimates from other studies (Elliott et al. 2008; Wei et al. 2019). Our observed patterns of variation suggest negative selection against variants that impair gene function, as reported by others (Stewart et al. 2008; Wei et al. 2019; Bolze et al. 2020). Missense, tRNA, and rRNA variants showed similar occurrence and heteroplasmy distributions, suggesting that they may be removed from the population at a similar rate by negative selection. We observed less variation within the noncoding control region compared to synonymous variants at transition variants (but not at transversion variants) (Supplemental Fig. S7A); however, this may be explained by the higher prevalence of the most mutable trinucleotides at synonymous sites (Zhou et al. 2014). To our knowledge, our analyses are the first to reveal a lack of putative synonymous variants at start codons, changing AUG > AUA, implying such mutations may impair mitochondrial function and fitness. Studies in bacteria and yeast mitochondria have shown that AUG is a more efficient initiation codon than AUA (Romero and García 1991; Mulero and Fox 1994). The identification of a c.3G > A variant in an individual with mitochondrial disease may thus warrant further investigation.
We anticipate that gnomAD mtDNA variants will be of broad use in the clinical interpretation of variants; however, we want to emphasize key limitations for interpretation of heteroplasmic variants detected in patients. The mitochondrial specifications of the ACMG/AMP guidelines provide clear methods for variant interpretation based on homoplasmic allele frequency (AF_hom): specifically, AF_hom > 0.005 provides evidence for benign classification whereas AF_hom < 0.00002 is supporting evidence for pathogenicity (McCormick et al. 2020). However, for variants never detected at homoplasmy, no such guidelines for heteroplasmic allele frequency (AF_het) have yet been developed. In the default browser setting, we have chosen to only include variants that we observe at heteroplasmy ≥ 10% because, below this threshold, we observed thousands of variants that are enriched for NUMT-derived false positives and sequencing errors. It is important to note that if clinical sequencing of a patient detects a low heteroplasmy variant (e.g., heteroplasmy <10%–15%) that is apparently absent from gnomAD based on the browser view, we caution against using the absence to support pathogenicity and urge gnomAD users to select the “Include unfiltered variants” option to view these artifact-prone sites and other excluded variants. These filtered variants are also included in downloadable gnomAD data files with the relevant flags. This scenario applies specifically to low heteroplasmy variants, which are prone to sequencing errors and NUMT-misalignments that are not typically problematic for high heteroplasmy mtDNA variants or nuclear variants. Another limitation of the gnomAD data set is that nearly all samples are derived from blood and do not include tissue-specific data—which are of particular importance for diagnosis of mitochondrial diseases, given that tissue differences in heteroplasmy influence variant interpretation.
Given the challenge and extent of NUMT-derived false positives, we urge confirmatory studies of putative low level heteroplasmy variants detected by clinical diagnostics. We note that many clinical sequencing methods (appropriately) aim to avoid NUMT-derived artifacts, using specialized methods to enrich for circular DNA or long-range PCR that selectively amplifies intact mtDNA. However, even such specialized methods may inadvertently report NUMT-derived false positives, as may be the case in the controversial report of paternally inherited mtDNA (Luo et al. 2018; Lutz-Bonengel and Parson 2019; Lutz-Bonengel et al. 2021).
The gnomAD database is not a random sampling of populations. As described in Methods, in addition to controls and biobanks samples, gnomAD v3 also includes samples from studies of diseases known to be common in the population (e.g., cardiovascular disease, cancer, and neurological diseases), although cohorts of rare pediatric diseases are excluded. It is possible that if certain mtDNA variants causally contribute to the diseases enriched in these common disease cohorts, the population frequencies reported in gnomAD may be different from random population sampling.
gnomAD's diverse population representation, exclusion of individuals known to have severe pediatric disease, and capture of homoplasmic and heteroplasmic variation offer value for mtDNA variant interpretation. As the first large-scale mtDNA database built from WGS data via a publicly available pipeline, this study has provided both open-source tools and data that will support mtDNA analysis in addition to nuclear variants as part of clinical WGS testing.
Methods
gnomAD database composition
The gnomAD v3 database aggregates data from large WGS projects. gnomAD includes WGS samples from the National Heart, Lung, and Blood Institute (NHLBI, 17 K samples), TOPMed projects (36 K samples), the Centers for Common Disease Genomics (CCDG, 7 K samples), The Cancer Genome Atlas (TCGA, 2 K samples), the Genotype-Tissue Expression project (GTEx, 1 K samples), and many others. All individuals known to be affected by severe pediatric disease, as well as their first-degree relatives, have been removed. gnomAD v3 contains samples enrolled as controls or through general population biobanks (24% of samples) as well as cases from a wide spectrum of diseases that are known to be common in the population, including 11% neurological disease (e.g., Alzheimer's, schizophrenia, bipolar, and other neuropsychiatric disorders, though autism and other pediatric neurological disease are excluded), 3% cardiac disease (e.g., coronary artery disease, atrial fibrillation), 3% inflammatory bowel disease, and 3% cancer. The remaining 56% of samples are not annotated with case/control status, including some disease studies and population-based observational cohort studies, with the following breakdown by study disease domain: 38% cardiac; 16% pulmonary; 2% neurological; and <1% other/unknown.
Mitochondrial variant calling pipeline in single samples
WGS data were aligned to reference genome GRCh38, which includes Chr M (identical to the revised Cambridge Reference Sequence, GenBank NC_012920.1) using BWA-MEM version 0.7.15-r1140 (parameters -K 100000000 -p -v 3 -t 2 -Y). For each sample CRAM, Terra MitochondrialPipeline version 25 was run (https://portal.firecloud.org/?return=terra#methods/mitochondria/MitochondriaPipeline/25). Briefly, GATK version 4.1.2.0 (McKenna et al. 2010) tools were used to estimate the median nuclear genome coverage (Picard CollectWgsMetrics), to exclude duplicates (Picard MarkDuplicates), to pull reads from Chr M (GATK PrintReads ‐‐read-filter MateOnSameContigOrNoMappedMateReadFilter ‐‐read-filter MateUnmappedAndUnmappedReadFilter), and to call variants (GATK Mutect2 ‐‐mitochondria-mode ‐‐annotation StrandBiasBySample ‐‐max-reads-per-alignment-start 75 ‐‐max-mnp-distance 0). For calling variants in the control region (coordinates Chr M: 16,024–16,569 and Chr M: 1–576), reads originally aligning to Chr M were realigned to a Chr M reference genome shifted by 8000 nucleotides, and then variants called on the shifted reference were mapped back to standard coordinates (Picard liftOver) and combined with variants from the noncontrol region. Mutect2 variants were then filtered (GATK FilterMutectCalls ‐‐stats raw_vcf_stats ‐‐max-alt-allele-count 4 ‐‐mitochondria-mode ‐‐autosomal_coverage nDNA_MEDIAN_COV ‐‐min_allele_fraction 0.01); multi-allelic sites were split into different variants (LeftAlignAndTrimVariants ‐‐split-multi-allelics ‐‐dont-trim-alleles ‐‐keep-original-ac); and HaploGrep/HaploCheck (v1.0.5) was run to assign haplogroup (Weissensteiner et al. 2016b) and estimate mtDNA contamination (Weissensteiner et al. 2021). The min_vaf_threshold was set to 0.01 and calls below 0.01 VAF were later set to homoplasmic reference. For each input sample, a VCF with mtDNA variants was produced. We note that GATK left-aligns all indel calls, unlike calls from mtDNA-Server and variants in the Phylotree database.
We developed Mutect2 “mitochondria mode,” which, in contrast to its original use in calling somatic mutations in cancer, sets parameters and filters specialized for calling low VAF variants in high-coverage mtDNA. Mutect2 performs local read realignment (using the same realignment algorithm as GATK's HaplotypeCaller), performs a local assembly of haplotypes, prunes these haplotypes, and then calls SNVs and short insertions/deletions via a Bayesian somatic genotyping model. To increase sensitivity, Mutect2 “mitochondria mode” lowers the threshold for ActiveRegions (regions to be considered by the variant caller) and the threshold for omitting variants based on quality. Additionally, “mitochondria mode” implements a specialized adaptive approach to prune paths from the assembly graph, which is necessary due to extremely high mtDNA coverage. Adaptive pruning uses both the local coverage and observed sequencing error rate to determine appropriate paths to prune from the graph to reduce false-positive calls. Finally, “mitochondria mode” removes several standard Mutect2 filters (including clustered events, filtered haplotypes, and multiallelic) that operate with the assumption that variants do not typically occur near each other, which does not apply to mtDNA.
A predefined list of artifact-prone sites (positions 301, 302, 310, 316, 3107, 16182) was provided as input into this pipeline, and any variant overlapping these sites was filtered (“artifact_ prone_site”), similar to other tools (Weissensteiner et al. 2016a; Wei et al. 2019). Sequence context at these specific artifact-prone sites makes it difficult to distinguish true variants from technical artifacts. The homopolymer tracts at location Chr M: 300–317 (AAACCCCCCCTCCCCCGC) cause Illumina sequencing errors in all samples and cause (1) a large coverage dip in this region, (2) reads with many apparent indels near position Chr M: 310T, and (3) apparent substitutions of Chr M: 301A > C, Chr M: 302A > C, Chr M: 310T > C, and Chr M: 316G > C. Similarly, homopolymer tracts at location Chr M: 16,180–16,193 (AAAACCCCCTCCCC) cause errors and apparent indels at position Chr M: 16,182–16,183. The reference genome contains “N” at position Chr M: 3107 (Bandelt et al. 2014), which causes misalignment of many reads. We note that this artifact-prone site filter was re-implemented at the cohort level after variants were combined across samples (see below).
Reproducibility
Duplicate samples were determined as described in Karczewski et al. (2020). For Mutect2, we ran version 25 of the Terra MitochondrialPipeline, filtered artifact-prone sites, and set any filtered genotypes to homoplasmic reference. To measure how similar variant calls were between duplicate samples for each tool, we calculated the Jaccard index for all variants as well as only variants with VAF > 0.10, 0.50, and 0.90. We output the results of this comparison for both SNVs and indels, but we note that mtDNA-Server is focused on calling SNVs and that their method for calling indels is in beta testing.
Assessing accuracy on truth data sets
Sample NA12878 and 22 samples from diverse L haplogroups were selected for in silico mixing experiments to create a large truth data set compared to the reference Chr M (totaling 1200 variants at 286 positions, including eight indels). For each L haplogroup sample, the number of mtDNA reads per sample was counted (SAMtools v1.8 idxstats [Li et al. 2009]), and then downsampling was performed (SAMtools v1.8) to create five BAM files containing a predefined ratio of reads from the L haplogroup sample and NA12878 (1%, 5%, 50%, 90%, 99%). For each mixture, total coverage was set to the L haplogroup sample's original coverage. GATK's HaplotypeCaller version 4.0.3.0 was used to call homoplasmic variants on the original BAMs before downsampling, with the ploidy argument set to 100. For each L haplogroup sample, a truth set was defined as variants present in the L haplogroup sample (allele count > 94/100) but absent in NA12878 (based on manual review using overlapping read pair data, with padding of 1 bp around each NA12878 variant). For each L haplogroup sample mixture, true- and false-positive calls were calculated against the sample-specific truth set and then summed across all 22 L haplogroup samples to create sensitivity and precision metrics.
mtDNA-Server comparison
We used Hail's Batch service (Hail 0.2, Hail Team, https://github.com/hail-is/hail) to run mtDNA-Server on sample mixtures and sample duplicates. We ran mutserve v1.3.4 using “analyse-local” with the heteroplasmy level threshold set to 0.01 and parameters outputting deletions and insertions. Consecutive deletion calls were merged (if VAF differed < 0.10) and summarized with mean depth and heteroplasmy. Output was reformatted to match Mutect2 calls. BCFtools (v1.10.2) (Li 2011) was used to left-align and normalize the variants.
NUMT-derived false positives
We identified candidate NUMT-FPs (Supplemental Table S1) as follows: we identified 122 common heteroplasmic mtDNA variants (unfiltered variants with VAF 0–0.50 in ≥ 1000 samples), of which 67 had heteroplasmy levels that correlated with 1/(1 + mtCN) (Spearman's correlation > 0.45), of which over half co-occurred with another common heteroplasmy in the same samples (Pearson's correlation > 0.45). For each candidate NUMT-FP, we generated a 20-mer sequence centered on the variant, then searched the derived 20-mer (and its reverse complement) against PacBio SAM files corresponding to three cell lines (NA12891, NA19239, NA19238), with read lengths ∼10 kb. PacBio reads that contained the 20-mers were aligned to GRCh38 via BLAT (Kent 2002). For two NUMTs, exact NUMT sequence and break points were identified that give rise to 25 validated NUMT-FPs (Supplemental Table S1). We defined “linked NUMT-FPs” as those where at least two of the 25 NUMT-FPs derived from the same NUMT were present in the same sample with heteroplasmy levels within 0.05 (unfiltered variants, VAF 0–0.50). For Figure 2F, all PASS variants were binned by VAF (e.g., 0.01–0.02); all samples were binned by sample mtCN (e.g., 25–50); and then the fraction of all variants in those bins that were “linked NUMT-FPs” was calculated and plotted.
PacBio sequencing and data processing
We performed long-read sequencing using the Pacific Biosciences (PacBio) circular consensus sequencing (CCS) protocol. Briefly, for library preparation, we obtained 5 μg of high molecular weight genomic DNA (>50% of fragments ≥ 40 kb) and sheared fragments to ∼10 kb using the Megaruptor 3 (Diagenode B06010003), followed by DNA repair and ligation of PacBio adapters using the SMRTbell Template Prep kit v1.0 (PacBio 100-991-900). Each library was subsequently size selected for 10 kb ± 20% using the SageELF with 0.75% agarose cassettes (Sage Science). Libraries were quantified with the Qubit dsDNA High Sensitivity Assay kit (Thermo Fisher Scientific Q32854), subsequently diluted to 50 pM per single molecule, real-time (SMRT) cell, hybridized with PacBio v2 sequencing primer, and bound with SMRT sequencing polymerase using a Sequel II Binding kit 1.0 (PacBio 101-731-100). Sequencing was performed in CCS mode on the Sequel II instrument using 8 M SMRT Cells (PacBio 101-389-001) and Sequel II Sequencing 1.0 kit (PacBio 101-717-200), with a 2-h pre-extension time and 30-h movie time per SMRT cell. Initial quality filtering, base calling, and adapter marking were performed automatically on-board the Sequel II to generate an initial raw “subreads.bam” file. CCS reads were generated using CCS software v.3.4.1 from PacBio (https://github.com/PacificBiosciences/ccs) with parameters “‐‐minPasses 3 ‐‐minPredictedAccuracy 0.99 ‐‐maxLength 21000.” CCS reads were mapped to the “GRCh38_noalt” reference sequence (GRCh38 without decoy sequences, HLA sequences, and alternative loci representations) using minimap2 (Li 2018) (version 2.17-r941 with parameters “-ayYL ‐‐MD ‐‐eqx -x map-pb”).
Cell line analyses
Selected gnomAD cohorts were annotated as cell lines including samples from the 1000 Genomes Project and the Human Genome Diversity Project (n = 3277), and Osaka University (n = 246). Variant subtypes for known cell lines and samples with mtCN 50–500 were annotated via the Variant Effect Predictor (VEP) and categorized as pLOF (if VEP consequence = stop_gained|frameshift_variant), missense (VEP consequence = missense_variant), synonymous (VEP impact = LOW), or rRNA/tRNA (VEP biotype = Mt_tRNA|Mt_rRNA); otherwise, they were categorized as noncoding.
gnomAD sample and variant filtering
gnomAD v3.1 contains 76,156 samples passing filters, of which 70,375 had read data available for analysis. For mtDNA analysis, we analyzed 56,434 samples after excluding 6505 samples with mtCN < 50, 5633 samples with mtCN > 500, and 1803 samples with contamination > 2% based on nuclear contamination (VerifyBamID v1, v2) (Jun et al. 2012; Zhang et al. 2020), mtDNA contamination (Haplocheck v1.0.5) (Weissensteiner et al. 2021), or an internal algorithm (mt-high-hets). Mt-high-hets utilizes the PASS haplogroup-defining variants which should be homoplasmic (VAF = 1.00) but in contaminated samples show multiple alleles with VAF 0.85–0.998. Mt-high-hets calculates contamination = 1−mean(VAF 0.85–0.998) if three such variants are present; otherwise, contamination = 1−mean(VAF 0.85–1.00).
To distinguish between missing calls and homoplasmic reference sites after combining the samples, we set the genotype of a sample that lacked a call at a site to homoplasmic reference if the depth of coverage at the respective site was greater than 100×. The genotype was otherwise set to missing.
Problematic variants were filtered or flagged as follows. Flag “common_low_heteroplasmy” was applied to variants found with PASS genotypes in >56 individuals (allele frequency > 0.001) at VAF 0–0.50. (Note that this includes PASS variants 0–0.01 VAF, which are subsequently filtered.) Filter “indel_stack” was applied to any indel allele where all samples with a variant call had at least two different heteroplasmic indels called at that position. The Hail pipeline re-implemented the “artifact_prone_site” filter, and any variant overlapping positions 301, 302, 310, 316, 3107, or 16182 was filtered. The original single-sample pipeline assigned filters “possible_numt” and “mt_many_low_hets” which were found to be unreliable and were ignored in the gnomAD release. Filter “npg” (no pass genotype) was applied to variants that had no passing genotype across all samples.
gnomAD annotations
All variant annotations were implemented in Hail. Annotations from VEP (v101) (McLaren et al. 2016) were added using the same pipeline which was used for gnomAD v3.1 nuclear annotations, with the modification of changing the distance parameter to 0 to avoid “upstream” and “downstream” annotations. Some annotations generated by LOFTEE were edited because the assumptions for the nuclear genome do not apply to the mtDNA. We removed the “SINGLE_EXON” flag because all mtDNA transcripts are single-exon. We also removed the “END_TRUNC” filter and converted “LC” (low confidence) loss-of-function variants due to “END_TRUNC” to “HC” (high confidence) because all mtDNA transcripts are short, single-exon genes not subject to nonsense-mediated decay. We obtained rsIDs from dbSNP (b154) and added in silico prediction annotations for tRNA variants from PON-mt-tRNA (download date 08-27-2020) (Niroula and Vihinen 2016), MitoTIP (download date 08-27-2020) (Sonney et al. 2017), and HmtVar (Preste et al. 2019). We define heteroplasmic variants as variants with VAF 0.10–0.95 and homoplasmic variants as variants with VAF 0.95–1.00. We generated allele frequency information for both homoplasmic and heteroplasmic variants and also provided this information for each top-level haplogroup and population.
Multinucleotide variants (MNVs)
Homoplasmic MNVs that were found adjacent in at least 90% of samples were flagged on the web portal. Specifically, homoplasmic MNVs were defined as variants where AC_hom_MNV/AC_hom > 0.90, where AC_hom_MNV indicates the number of samples where this homoplasmic variant was adjacent to any other homoplasmic variant, and AC_hom indicates the number of samples with this homoplasmic variant. For example, adjacent variants Chr M: 5185G > A (homoplasmic in one sample) and Chr M: 5186A > T (homoplasmic in 80 samples) were observed together in one sample and thus the former was flagged MNV (AC_hom_MNV/AC_hom = 1/1) whereas the latter was not (AC_hom_MNV/AC_hom = 1/80).
Haplogroups
Haplogroups were downloaded from the rCRS-orientated version of PhyloTree Build 17 (van Oven and Kayser 2009), and variants were extracted using custom Python scripts. As Phylotree represents a right-alignment of indels, we manually inspected haplogroup indel variants and inferred the equivalent left-alignment that would be expected in gnomAD, with the exception of haplogroup insertions of unknown length (denoted by ‘.X’).
Inferred nuclear ancestry
Each sample was assigned to a predefined set of continental ancestries (Fig. 4E) based on principal component analysis of nuclear SNVs (Karczewski et al. 2020).
Proportion possible observed
A “synthetic” VCF with all possible mtDNA SNVs was generated using an in-house script and annotated by VEP (v97). This was used to calculate the proportion of possible SNVs observed in gnomAD. For variants within two genes (with two consequences), both consequences were included in the possible variant counts. The proportion of codons in each protein-coding gene with homoplasmic or only heteroplasmic nonsynonymous SNVs (all SNVs except those with consequence “synonymous_variant”), and the proportion of bases in each RNA gene with homoplasmic or only heteroplasmic SNVs in gnomAD were calculated using a custom script.
Pathogenic variants and other variant annotations
Pathogenic variants with a “Confirmed” status were downloaded from the MITOMAP database (disease table, download date 02-02-2021) (Lott et al. 2013); indel variants were manually inspected, and the equivalent left-alignment that would be expected in gnomAD was inferred. APOGEE in silico predictions were downloaded from MitImpact (v3.0.6) (Castellana et al. 2017). HmtVar in silico predictions were retrieved from the HmtVar database (download date 11-18-2020) (Preste et al. 2019). Data from HelixMTdb were downloaded from Helix (https://www.helix.com) (version dated 03-27-2020) (Bolze et al. 2020). Comparison to HelixMTdb and to MITOMAP variants with GenBank count > 0 (polymorphisms and disease tables, download date 02-02-2021) was used to identify gnomAD variants not previously observed in either database.
Data access
Variants and population frequencies generated by this study are available in gnomAD v3.1 (https://gnomad.broadinstitute.org). A user-friendly website provides variant annotations, including distributions across heteroplasmy levels, populations, haplogroups, and age. Data are available for download in multiple formats, including VCF, Hail Table, and simple tab-delimited files (https://gnomad.broadinstitute.org/downloads#v3-mitochondrial-dna). The Mutect2 pipeline is available through GATK at GitHub (https://github.com/broadinstitute/gatk/blob/master/scripts/mitochondria_m2_wdl/MitochondriaPipeline.wdl) (the data available in gnomAD v3.1 were generated using https://portal.firecloud.org/?return=terra#methods/mitochondria/MitochondriaPipeline/25), and the Hail scripts used for combining the VCFs, filtering samples and variants, adding annotations, and performing analyses can be found at GitHub (https://github.com/broadinstitute/gnomad-mitochondria). We also released a simplified MitochondriaPipelineSlim.wdl (https://portal.firecloud.org/?return=terra#methods/mitogenomics2/MitochondriaPipelineSlim/17) (with parameter “‐‐min-median-mapping-quality 0”) that omits the realignment step to reduce complexity, input parameters, and cost, without substantial differences to the output VCF. Scripts are also available for download in Supplemental Code.
Competing interest statement
V.K.M. is a paid advisor to Janssen Pharmaceuticals and 5 am Ventures. The other authors declare no competing interests.
Acknowledgments
We thank David Thorburn, John Christodoulou, and members of their labs for their feedback on displaying mtDNA variants on the browser. The gnomAD results published here are in part based on data: (1) generated by The Cancer Genome Atlas (TCGA) managed by the National Cancer Institute and the National Human Genome Research Institute (NHGRI) (accession: phs000178.v10.p8); information about TCGA can be found at http://cancergenome.nih.gov; (2) generated by the Genotype-Tissue Expression Project (GTEx) managed by the National Institutes of Health (NIH) Common Fund and NHGRI (accession: phs000424.v7.p2); and (3) generated by the Alzheimer's Disease Sequencing Project (ADSP), managed by the National Institute on Aging and NHGRI (accession: phs000572.v7.p4). Analysis of the Genome Aggregation Database was supported by the National Institute of Diabetes and Digestive and Kidney Diseases (U54DK105566) and the NHGRI of the NIH under award number U24HG011450. N.J.L. received a National Health and Medical Research Council (NHMRC) Early Career Fellowship and an Australian American Association Scholarship. This work was supported by grants from the Broad Institute Scientific Projects to Accelerate Research and Collaboration (S.E.C. and V.K.M.) grant and the NIH, National Institute of General Medical Sciences (R35GM122455; S.E.C. and V.K.M). Additional funding for Genome Aggregation Database Consortium members is listed in the Supplemental Material. The content is solely the responsibility of the authors and does not necessarily represent the official views of the National Institutes of Health.
Author contributions: K.M.L. and N.J.L. performed data analysis and manuscript preparation. N.A.W. adapted the gnomAD browser to incorporate mitochondria-specific annotations. M.S. and D.B. developed the mitochondria mode of Mutect2. M.S., A.H., and J.S. developed the mitochondrial pipeline and Terra WDL with guidance from L.G. and E.B., and assistance from J.E. K.G. developed the PacBio sequencing pipeline. gnomAD Consortium provided samples and project oversight. H.L.R. and D.G.M. provided gnomAD leadership. G.T. provided oversight of the collaboration and manuscript preparation. M.L. and V.K.M. provided leadership, analytical advice, and editing of the manuscript. S.E.C. provided leadership, expert knowledge, data analysis, and manuscript preparation. All authors listed under The Genome Aggregation Database Consortium contributed to the generation of the primary data incorporated into the gnomAD resource, and specific members provided additional contributions: Mark J. Daly provided gnomAD leadership, Sebastian Schönherr provided assistance with Haplocheck, and Konrad J. Karczewski reviewed the code for call set assembly and annotation.
Footnotes
-
↵7 Full lists of Consortium authors and affiliations are located in the Supplemental Material.
-
↵8 These authors contributed equally to this work.
-
↵9 Co-senior authors.
-
[Supplemental material is available for this article.]
-
Article published online before print. Article, supplemental material, and publication date are at https://www.genome.org/cgi/doi/10.1101/gr.276013.121.
-
Freely available online through the Genome Research Open Access option.
- Received July 23, 2021.
- Accepted January 19, 2022.
This article, published in Genome Research, is available under a Creative Commons License (Attribution-NonCommercial 4.0 International), as described at http://creativecommons.org/licenses/by-nc/4.0/.


