
Genomic context sensitivity of insulator function
- André M. Ribeiro-dos-Santos1,3,
- Megan S. Hogan1,3,4,
- Raven D. Luther1,5,
- Ran Brosh1 and
- Matthew T. Maurano1,2
- 1Institute for Systems Genetics, NYU Grossman School of Medicine, New York, New York 10016, USA;
- 2Department of Pathology, NYU Grossman School of Medicine, New York, New York 10016, USA
-
↵3 These authors contributed equally to this work.
Abstract
The specificity of interactions between genomic regulatory elements and potential target genes is influenced by the binding of insulator proteins such as CTCF, which can act as potent enhancer blockers when interposed between an enhancer and a promoter in a reporter assay. But not all CTCF sites genome-wide function as insulator elements, depending on cellular and genomic context. To dissect the influence of genomic context on enhancer blocker activity, we integrated reporter constructs with promoter-only, promoter and enhancer, and enhancer blocker configurations at hundreds of thousands of genomic sites using the Sleeping Beauty transposase. Deconvolution of reporter activity by genomic position reveals distinct expression patterns subject to genomic context, including a compartment of enhancer blocker reporter integrations with robust expression. The high density of integration sites permits quantitative delineation of characteristic genomic context sensitivity profiles and their decomposition into sensitivity to both local and distant DNase I hypersensitive sites. Furthermore, using a single-cell expression approach to test the effect of integrated reporters for differential expression of nearby endogenous genes reveals that CTCF insulator elements do not completely abrogate reporter effects on endogenous gene expression. Collectively, our results lend new insight into genomic regulatory compartmentalization and its influence on the determinants of promoter–enhancer specificity.
A boundary model offers an attractive paradigm for understanding regulatory specificity in mammalian genomes through the delineation of independent regulatory domains. Insulators are a class of genomic regulatory elements that block interaction of enhancers with their cognate promoters (Phillips and Corces 2009). Enhancer blocker activity is canonically defined by a reporter assay that interposes a candidate insulator element between a weak promoter and an enhancer (Chung et al. 1993), while barrier insulators protect transgenes from silencing owing to spreading of heterochromatin (West et al. 2002). Insulators have also been used to counter genotoxicity from transgene enhancer activation of endogenous oncogenes (Li et al. 2009; Liu et al. 2015). Known insulators such as the chicken beta-globin hypersensitive site 4 element or the Igf2/H19 imprinting control region (Bell and Felsenfeld 2000) are composite elements with enhancer blocker, barrier, and other activities (Dickson et al. 2010), and often have secondary functions, such as silencers (Qi et al. 2015).
The architectural protein CTCF is the only known vertebrate insulator protein, and its binding can confer a potent enhancer blocking effect (Phillips and Corces 2009). Additionally, binding sites for CTCF colocalize with genomic features such as topologically associated domain boundaries (Dixon et al. 2012), but direct functional analysis of these sites is impeded by the difficulty of genome engineering at the relevant scales. Although binding affinity, DNA methylation, and recognition sequence orientation appear to confer some specificity for CTCF sites involved in domain organization (de Wit et al. 2015; Guo et al. 2015; Sanborn et al. 2015), these factors alone remain inadequate to distinguish true insulator elements impacting expression of nearby genes from the ∼100,000 CTCF sites genome-wide (Maurano et al. 2015; Tycko et al. 2019). Stably integrated reporter assays have shed light on the mechanics of insulator function, but such methods do not assess interaction with the surrounding endogenous genomic elements (Walters et al. 1999). In contrast, integrated barcoded reporter assays (Akhtar et al. 2013; Maricque et al. 2019; Moudgil et al. 2020) offer the potential to directly assess the interaction between novel CTCF sites and the endogenous genomic landscape.
Here, we aim to functionally characterize endogenous genomic regulatory elements through their effect on integrated reporters. We describe a high-throughput randomly integrated barcoded reporter platform based on a previously described enhancer blocker construct interposing a potent CTCF insulator element (Liu et al. 2015) between a weak promoter and a potent enhancer. We integrate these reporters, both with and without insulator elements, randomly throughout the genome of K562 erythroleukemia cells using the Sleeping Beauty transposase system. We use the unique reporter barcodes to map individual insertion locations and enable position-specific readout of genomic context effects. Finally, we apply single-cell RNA-seq (scRNA-seq) to detect specific reporter integrations that perturb endogenous gene expression.
Results
Flow cytometry characterization of enhancer blocker reporter
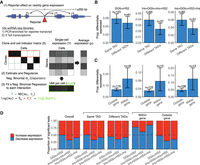
The canonical definition of an enhancer blocker relies on a well-studied reporter construct design (Chung et al. 1993; Liu et al. 2015) incorporating the well-characterized human HBG1 promoter driven by the murine Hbb locus control region (LCR) hypersensitive site 2 (HS2) enhancer. We designed a series of reporter constructs bearing potent insulator elements (A1 or C1) previously identified from analysis of highly occupied genomic CTCF sites (Supplemental Fig. S1; Liu et al. 2015). These insulators were interposed between the reporter promoter and enhancer in an enhancer blocker position (Fig. 1A). Reporter expression drove Puro and GFP to enable selection and/or measurement of transcriptional activity on a cellular level. The transcription unit was flanked by Sleeping Beauty (Mátés et al. 2009) inverted terminal repeats (ITR) to permit stable integration at random genomic sites without high bias for particular regions (de Jong et al. 2014). Transposition was performed through transient cotransfection with a plasmid expressing SB100X, a highly active variant of the Sleeping Beauty transposase (Mátés et al. 2009).
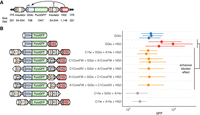
Cellular activity of enhancer blocker activity. (A) Reporter scheme consisting of HBG1 promoter (GGlo) driving Puro and GFP expression. A CTCF site is interposed between the promoter and an HS2 enhancer to act as an enhancer blocker. (ITR) Sleeping Beauty inverted terminal repeats; (HS2) beta-globin hypersensitive site 2 enhancer. (B) Reporter plasmids cotransfected with a plasmid expressing the Sleeping Beauty SB100X transposase for random genomic integration. GFP activity was measured by flow cytometry. A1 and C1 represent previously characterized CTCF-binding insulator elements (Liu et al. 2015). A1Core and C1Core were truncated to the core 54-bp CTCF recognition sequence. FW and RV indicate forward or reverse orientation of insulator elements. Independent transfections are shown separately. Dots indicate median GFP levels, and whiskers extend to the 25th and 75th percentiles.
We first characterized activity of several different classes of reporters, including GGlo (promoter-only), GGlo + HS2 (promoter and enhancer), and Ins + GGlo + Ins + HS2 (enhancer blocker) (Supplemental Table S1) in K562 erythroleukemia cells using flow cytometry (Fig. 1B; Supplemental Fig. S2). The baseline promoter-only GGlo construct showed low activity, whereas the GGlo + HS2 construct including an enhancer showed higher activity (Fig. 1B). In contrast, Ins + GGlo + Ins + HS2 reporters showed low activity, slightly below that of promoter-only GGlo constructs (Fig. 1B), thus recapitulating classical work defining enhancer blocker insulators (Chung et al. 1993).
To confirm that the enhancer blocker effect is tightly coupled to CTCF occupancy, we tested a series of constructs whose insulator elements were truncated to the core 54-bp CTCF recognition sequence (A1Core and C1Core) (Supplemental Fig. S1). These constructs showed similar activity to the baseline construct (Fig. 1B). Exchanging the insulator elements A1Core and C1Core showed similar activity in the enhancer blocker position, suggesting they can be used interchangeably (Fig. 1B). As the relative orientation of genomic CTCF sites may play a role in determining their specificity (de Wit et al. 2015; Guo et al. 2015; Sanborn et al. 2015), we designed constructs with the orientation of each CTCF site reversed. This showed that CTCF effect on reporter activity was orientation independent (Fig. 1B). Ins + Ins + HS2 without a promoter showed essentially no activity, confirming that neither the insulator elements nor Sleeping Beauty ITRs have intrinsic transcriptional activity on their own (Fig. 1B). Ins + GGlo + Ins showed activity below that of GGlo, recapitulating the previously reported silencer activity of insulator A1 (Liu et al. 2015), which might be conferred by an NFI site outside the core CTCF recognition sequence (Supplemental Fig. S1). These results confirm that our reporter assay detects canonical enhancer blocker reporter activity mediated by a strong CTCF recognition sequence.
Although each reporter class manifests characteristic activity in cellular assays, cellular activity potentially varies with transfection or transposition efficiency and selection for reporter activity. Furthermore, although flow cytometry assesses single-cell GFP levels representing the total activity of all reporters integrated in that cell, genomic context may modulate the effect of individual insertion sites. We therefore turned to a genomics approach capable of distinguishing site-specific reporter activity.
Reporter activity in genomic context
To assess the effect of genomic context on reporter activity, we developed a massively parallel reporter assay (MPRA) to deconvolute the position-specific activity of individual reporters. We designed reporter plasmid libraries incorporating 16-nt reporter barcode (BC) sequences to uniquely identify each insertion site (Supplemental Fig. S3). For each transfection, we generated three types of sequencing libraries (Fig. 2A; Supplemental Fig. S4): an inverse PCR (iPCR) library to map reporter genomic insertion sites, a DNA library to determine their representation, and an RNA library to measure their expression. Sequencing libraries were constructed using a two-stage nested polymerase chain reaction (PCR) to add Illumina adapters. Further, RNA and DNA libraries incorporated an 8- to 12-nt unique molecular identifier (UMI) (Jee et al. 2016) to permit single-molecule counting.
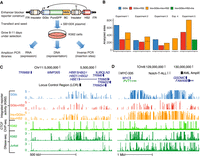
Site-specific profiling of enhancer blocker activity. (A) Barcoded reporters were randomly integrated using SB100X transposase. Site-specific reporter activity was read out in multiplex using sequencing to map insertion sites (inverse PCR libraries), barcode representation (DNA libraries), and expression (RNA libraries). (GGlo) HBG1 promoter; (BC) unique barcode; (HS2) beta-globin hypersensitive site 2 enhancer; (ITR) Sleeping Beauty inverted terminal repeats. (B) Counts of analyzed sites in thousands for five experiments including promoter-only (GGlo), promoter and HS2 enhancer (GGlo + HS2), with CTCF site interposed between GGlo and HS2 (Ins + GGlo + Ins + HS2), or with CTCF sites fully flanking the reporter and enhancer (Ins + GGlo + HS2 + Ins). (C,D) Analysis of enhancer blocker functionality at the HBB (C) and MYC (D) loci. The top three tracks show reporter activity. Data shown merged from replicate experiments. The bottom three tracks show CTCF ChIP-seq data for K562 erythroleukemia cells, and DNase-seq data for K562 and Jurkat T-cell leukemia cells. Regions highlighted in D include the MYC-335 enhancer region coinciding with a genetic association for colorectal cancer (Sur et al. 2012), the Notch-T-ALL (Acute Lymphocytic Leukemia) enhancer cluster (Herranz et al. 2014), and the AML (acute myeloid leukemia) amplified region (Radtke et al. 2009).
We performed five independent experiments using the GGlo, GGlo + HS2, and Ins + GGlo + Ins + HS2 constructs, as well as an Ins + GGlo + HS2 + Ins construct wherein the reporter was fully flanked by insulator elements (Supplemental Table S1). After growth for 8–11 d, multiple DNA, RNA, and iPCR libraries (n = 2–5 replicates) were generated for each experiment (Supplemental Table S2) and sequenced to saturation. Reporter activity was quantified as the log-ratio of normalized RNA and DNA counts. Individual transfections averaged 36,195 reporter insertions analyzed after quality control (Fig. 2B; Table 1; Supplemental Table S3). These data yielded high-resolution maps of genomic reporter activity, with an insertion every 14–107 kb on average, and at an average distance from an endogenous DNase I hypersensitive site (DHS) of 6–40 kb. Insertion densities were moderately enriched in regions of active DHSs and generally similar across experiments (Supplemental Fig. S5). To maximize resolution for visualization, libraries with the same construct design from the five experiments were merged, averaging 117,428 insertion sites per construct (Table 1; Supplemental Table S3).
Summary of insertions analyzed per reporter class and experiment
Examination of the beta-globin (Fig. 2C) and MYC (Fig. 2D) loci showed notable differences in patterns of reporter activity. GGlo showed variable activity that was highly responsive to local genomic context: at the beta-globin locus, its activity was concentrated tightly at genes; at MYC, activity localized to two separate domains around the MYC gene itself and distal acute lymphoblastic leukemia (ALL) enhancers. In contrast, GGlo + HS2 showed more variable insertion location and site-specific activity. Insertions were depleted over several regions, including directly upstream of MYC and downstream from its proximal DHS cluster, suggesting that the GGlo + HS2 construct does not support expression at these regions, or that those insertions have a negative effect on cell growth. Notably, GGlo had higher activity than GGlo + HS2 near the beta-globin LCR and MYC enhancer clusters. We speculate that the HS2 enhancer in the reporter may interfere with its activation by the endogenous genomic enhancers. Ins + GGlo + Ins + HS2 showed less variable activity and a broader window of genomic positions permissive of expression, consistent with a model in which CTCF sites moderate the impact of surrounding genomic context on regulatory activity.
Decomposing context sensitivity
Reporter activity averaged across all insertion sites (Fig. 3A) recapitulated observed cellular activity (Fig. 1). Of note, there was significant overlap in expression among reporter classes, suggesting that although each reporter shows characteristic activity in aggregate, activity at individual sites can be strongly modulated by genomic context. We therefore assessed the correlation in activity for insertion pairs separated by different distance scales (Fig. 3B; Supplemental Fig. S6A). GGlo correlation between insertions started high at short range, but dropped steeply with increased distance. GGlo + HS2 showed the lowest correlation across all distance ranges, suggesting the most stochastic activity. Constructs bearing insulators (Ins + GGlo + Ins + HS2 and Ins + GGlo + HS2 + Ins) maintained high correlation that decayed less significantly with distance. These results suggest intrinsic activity, stochasticity, and sensitivity to genomic context can be read out in a systematic manner using our approach (Fig. 3C).
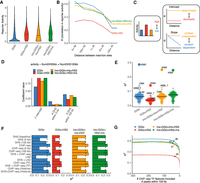
Quantitative assessment of genomic context effects on reporter activity. (A) Distribution of activity by reporter class. Average activity was computed across all fully mappable 10-kb bins with at least one insertion. Horizontal bars represent medians. (B) Correlation in activity for nearby insertions by reporter class merged across all experiments. For each insertion, 50 nearby insertions were sampled with replacement from within 500 kb. Correlation was computed across pairs of insertions in each distance bin. Bins with fewer than 100 data points were omitted. (C) Model of genomic context effects on reporter activity and correlation profiles. Increased correlation across all length scales reflects deterministic versus stochastic activity. Constant correlation across all length scales reflects context-independent activity, whereas a reduction of correlation with distance represents genomic context dependency. (D) Linear regression coefficients for model partitioning reporter activity into close and long-range genomic context represented by count of DHSs within 5 and 100 kb, respectively. (E) Predictive performance of reporter activity using DHS data from other cell types. Bar indicates median. (F) Predictive performance of models incorporating ENCODE histone and TF ChIP-seq data, and lamin-associated domains (LADs) (Leemans et al. 2019). Model including the number of DHSs within 5 and 100 kb as features is used as baseline for comparison (dashed line). (G) Analysis of TF ChIP-seq feature importance under iterative removal of feature with smallest effect size. Inflection points are labeled with the number of ChIP-seq features.
We then assessed the influence of genomic features relevant to insulator function. It has been hypothesized that TAD organization directly affects expression (Symmons et al. 2014). Thus, we repeated our analysis but stratified our reporter pairs into those that share the same TAD and those that do not. Reporters in the same TAD presented overall higher correlation than those in different TADs, even when comparing insertion pairs separated by similar distances (Supplemental Fig. S6B). If reporter or endogenous CTCF orientation influences gene expression at a given genomic site, insertion pairs having consistent orientations should show increased correlation. Yet, our analysis showed little effect of orientation on correlation across all distance ranges (Supplemental Fig. S6C), implying that the orientation of endogenous CTCF sites is not a major factor in reporter activity.
To provide an easily computed metric reflecting the contribution of genomic context at different distance scales, we counted the number of DHSs within 5 and 100 kb of the reporter insertion site (Supplemental Fig. S7A,B). We then used a linear regression model to systematically quantify the effect of these indicators of genomic context on reporter activity (Fig. 3D). Consistent with the correlation pattern observed at nearby insertions (Fig. 3B), GGlo and Ins + GGlo + Ins + HS2 showed the highest contribution of genomic features to reporter activity, whereas GGlo + HS2 showed the lowest. Each reporter class showed distinct contributions of DHSs with 5 and 100 kb, suggesting that our approach provides a means of partitioning the influence of genomic context into short- and long-range components.
Virtually all genomic features vary along chromosomes with a significant degree of correlation, including structural features such as gene density, G + C content, and density of various repeat classes. To distinguish the contribution of these structural features (which do not vary across cell types) versus the role of the cell-selective actuation of regulatory DNA, we used DHS maps from 109 cell types (Supplemental Table S4; Thurman et al. 2012). For each of these cell types, we computed the number of DHSs within 5 and 100 kb of reporter insertion sites and evaluated predictive performance for reporter activity measured in K562 cells. Predictive performance using features computed from unmatched cell types was poor, with the highest performance in closely related cell types, such as the leukemia cell lines CMK and KBM-7 (Fig. 3E). These results suggest that despite the large genomic intervals reflected by these features, their predictive power is highly cell type–selective.
Next, we evaluated overall predictive performance for a series of models to dissect the molecular underpinning of these features representing genomic context. Using just the number of DHSs within 100 kb yielded a similar performance to the baseline model on all reporter classes, although GGlo performance was additionally influenced by the number of DHSs within 5 kb (Fig. 3F). The relevance of DHS density as a feature extending as far as 100 kb suggests an infinitesimal model in which genomic context reflects the influence of a large number of regulatory elements, with most contributing a small but significant effect. To assess the scope of genomic features contributing to context on this scale, we analyzed ChIP-seq data from the ENCODE Project (The ENCODE Project Consortium 2012) for 321 histone modifications, sequence-specific TFs, coactivators, and corepressors in K562 cells (Supplemental Table S4). Adding all ChIP-seq data sets as features yielded the overall highest predictive performance and increased predictive performance relative to the original model based solely on DHSs (Fig. 3F). The improved performance did not derive from histone modifications, but rather sequence-specific TFs, coactivators, and corepressors (Fig. 3F). Lamin-associated domains (LADs) have previously been associated with reporter expression, but their predictive power alone was inferior to the DHS-based features (Leemans et al. 2019). Breaking out each TF ChIP-seq track individually showed that no single factor contributed a dominant amount to predictive performance (Fig. 3G). These results suggest that numerous distinct trans-acting factors each contribute to genomic context over long range.
Clonal analysis using integrated barcodes
Single-cell RNA-seq approaches can provide the compartmentalization needed to associate reporter BCs integrated in the same cell, which can provide a unique combinatorial genetic identifier for cells derived from a given clone during transfection (Lu et al. 2011; Biddy et al. 2018; Weinreb et al. 2020). We adapted our integrated reporter assay to the droplet-based 10x Genomics scRNA-seq platform and generated a full-transcriptome 3′ scRNA-seq library (Fig. 4A; Supplemental Table S5). To ensure maximal representation of BCs from moderately expressed reporters, we additionally generated a reporter transcript enrichment library from the same scRNA-seq cDNA using an amplicon-based targeted library construction approach.
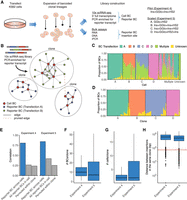
scRNA-seq inference of clonal relationship of reporter insertions. (A) scRNA-seq experiment to infer clonal relationships between single cells using presence of reporter BCs. (B) Graph-based inference of clones from scRNA-seq data using reporter BC to link cells deriving from the same clone. (C,D) Deconvolution of pooled transfections in Experiment 5. The x-axis represents cells (C) or final inferred clones (D), grouped by inferred transfection and ordered according to hierarchical clustering. (Multiple) reporter BCs or cellBCs linked to multiple transfections; (Unknown) reporter BCs or cellBCs detected only in scRNA-seq data. (E) Reporter BC counts show high correlation across multiple cells. All reporter BCs in the same cells or reporter BC counts shuffled within clones show little correlation. (F–H) Summary of clones including number of cells per clone (F), number of reporter BCs per clone (G), and distance between reporters integrated in cells derived from the same clone (H). Boxes represent 1st and 3rd quartiles, horizontal bars indicate median, and whiskers represent ±1.5 interquartile range. Horizontal red line in H at 500 kb indicates distance cutoff selected for insertions in the same clone to be considered independent.
We developed a graph-based clonal inference approach to identify cells deriving from the same clone to impute reporter presence and improve analysis power (Fig. 4B). The reporter-enriched scRNA-seq libraries were used to initialize a graph in which nodes represented cellBCs and reporter BCs that were connected based on sequencing reads. This initial graph was then pruned to reduce the impact of expected sources of experimental noise in large screens, such as chimeric PCR products and cell doublets (Methods; Supplemental Data S2; Supplemental Data S3).
We performed both a pilot experiment including Ins + GGlo + Ins + HS2 (Experiment 4) and a scaled-up experiment (Experiment 5) using three different classes of reporter constructs, including GGlo + HS2, Ins + GGlo + Ins + HS2 (transfected in replicate from the same plasmid library), and Ins + GGlo + HS2 + Ins. We generated DNA, RNA, and iPCR libraries from each transfection separately but pooled the cells from four independent transfections (labeled A–D) for scRNA-seq (Supplemental Table S5). We used our clonal inference approach to deconvolute the pooled transfections and prune conflicting cells or clones. The majority of cells were assignable to a single transfection, with the exception of reporter BCs shared from the replicate transfections B and C (Fig. 4C,D).
We first confirmed that that reporter activity was highly reproducible across multiple cells (Fig. 4E). For comparison, unrelated reporters in the same cells or with permuted data within clones showed little correlation (Fig. 4E). Clonal inference significantly consolidated cells by identifying clonally related cells and reporter BCs present in the same cell (Fig. 4F,G). Assessing reporter insertion sites in the same cell showed that the distance between insertions was sufficiently large to enable independent readout of hundreds of reporters in a given cell (Fig. 4H).
Effect of reporters on endogenous gene expression
The compartmentalization provided by single-cell readout enables direct linkage of individual insertions to their effect on adjacent genes (Gasperini et al. 2019). To investigate the effect of ectopic regulatory DNA on the local genomic landscape, we developed an analysis approach called differential expression of clonal alterations local effects (DECAL), which compares the expression of a gene in perturbed clone against the expression in all other clones while accounting for the sparsity of single-cell data (Fig. 5A; Methods). DECAL models single-cell gene expression count using a negative binomial regression with dispersion estimated using a maximum likelihood model and a regularization strategy.
Analysis of reporter effect on nearby endogenous gene expression. (A) Schematic of DECAL analysis framework. (B,C) Rate of significant effect on gene expression by whether reporter and gene are in the same TAD (B) and whether reporter is inside or outside gene body (C). Numbers at the top indicate the number of significant tests. Error bars represent 99% confidence intervals estimated by 1000 bootstrap simulations. (D) Significant tests for each category broken down by proportion of those that increase versus decrease expression.
Our use of clonal inference permitted imputation across cells of reporter presence and flanking gene expression levels, which substantially increased the number of cells linked to a particular reporter beyond those with direct measurement of the reporter BC (Supplemental Fig. S8A). Expression levels were highly consistent between cells with direct measurement of the reporter BC and other cells in the same clone (Supplemental Fig. S8B).
After performing a power simulation to identify well-powered tests (Supplemental Fig. S9; Methods), we tested the full-scale data from Experiment 5 for significant changes of gene expression nearby insertions, merging results from the two Ins + GGlo + Ins + HS2 replicates (transfections B and C). There was sufficient power to test an average of 3122 insertions for each of the three distinct reporter classes (Table 2; Supplemental Data S4). While most reporters did not have an effect on nearby endogenous gene expression, a small proportion (3.2%–6.8%) of reporters of all three classes caused detectable effects on expression of a nearby gene (Table 2). Although K562 cells are highly aneuploid (Zhou et al. 2019), we did not observe confounding with increased copy number level (Supplemental Fig. S10A). As expected (Symmons et al. 2014), insertions were more likely to affect expression of genes with a transcription start site (TSS) in the same topologically associating domain (TAD) (Fig. 5B; Supplemental Fig. S10B; Supplemental Table S8).
Effect of reporter insertion on endogenous gene expression
Reporters inserted in the gene body itself were more likely to affect that gene's transcript (Fig. 5C; Supplemental Table S9), consistent with results from a smaller screen (Zhang et al. 2020). Focusing on insertions outside of gene bodies still showed a similarly increased significance for insertions within the same TAD versus across different TADs (Supplemental Fig. S10C), suggesting that these two effects are not confounded.
The overall direction of effect for significant insertion-gene tests was evenly divided between increased and decreased expression of the target gene (Fig. 5D). Ins + GGlo + Ins + HS2 and Ins + GGlo + HS2 + Ins showed a slightly higher rate of increased gene expression relative to the other two constructs, raising the possibility that the reporter insulator element also modulates the effect of the reporter on endogenous gene expression. Notably, insertions within gene bodies skewed toward decreased expression of that gene. Collectively, these results underscore the role for genomic context in dictating the effect of ectopically delivered regulatory elements on endogenous gene expression.
Discussion
Although recognized classes of genomic regulatory elements were originally defined using reporter assays, short constructs alone cannot model the effect of hundreds or thousands of regulatory sites that collectively influence genomic context (Klein et al. 2020). Here, we show that although insulator elements demonstrate a strong effect in aggregate, individual reporters demonstrate a wide range of expression levels depending on genomic context. Indeed, high reporter expression at some genomic integration sites implies a total abrogation of insulator function. Similarly, integrated reporters perturbed endogenous gene expression regardless of whether they harbored insulator elements. A strict barrier definition of insulator function is difficult to reconcile with these results, or with studies showing perturbations of CTCF binding yield readily detectable alterations in genome organization but not of gene expression (Nora et al. 2017; Zhang et al. 2020).
Our results are instead consistent with a model in which insulators moderate but do not eliminate sensitivity to genomic context and suggest that insulator elements might counteract increased stochasticity from an enhancer element while still leaving expression subject to position effects. Consistent with this model, single-cell analyses have shown that enhancers increase the frequency of transcription in a given cell rather than augmenting the transcriptional rate per cell (Weintraub 1988; Walters et al. 1996). It is possible that more complex, composite regulatory elements might further fine-tune variability of expression and sensitivity to context effects. For example, multiple tandem CTCF sites have been shown to increase the strength of insulation (Huang et al. 2021).
Genomic context is a key predictive feature of models for recognizing functional regulatory variation (Halow et al. 2021), suggesting a need for further large-scale characterization of genomic regulatory element classes and composite regulatory elements. Our work suggests that genomic regulatory element function should be evaluated on multiple axes, including expression (1) level, (2) consistency (stochastic vs. deterministic), and (3) sensitivity to the local and/or long-range regulatory landscape (Fig. 3C). We expect that our approach will enable further dissection of the interplay between regulatory sequence, genomic context, and single-cell behavior, and facilitate incorporation of genomic context sensitivity in models of functional regulatory variation.
Methods
Plasmid cloning and barcoding
pCMV(CAT)T7-SB100 (SB100X) and pT2/LTR7-GFP were gifts from Zsuzsanna Izsvak (Addgene plasmids #34879 and #62541, respectively) (Mátés et al. 2009).
The human HBG1 globin promoter, murine Hbb hypersensitive site 2 (HS2) enhancer, A1 insulator, C1 insulator, A1 Core, and C1 Core DNA fragments (Supplemental Table S6) were synthesized by GenScript USA. All plasmids used in this study are listed in Supplemental Table S7.
Cell culture and transfection
K562 cells were obtained from ATCC (ATCC CCL-243) and cultured in RPMI 1640 medium with glutamine (Thermo Fisher Scientific MT10040CV) supplemented with 10% FBS (Gemini Bio-Products 100-106), 1 mM sodium pyruvate, and 10 units/mL penicillin-streptomycin. Cultures were maintained at 37°C and 5% CO2 and were subcultured once cultures reached a density of 5 × 10⁵ cells/mL.
Using the Thermo Fisher Scientific Neon Transfection System 100 µL Kit according to the manufacturer's instructions with varying amounts of transposon and transposase, 1 × 10⁶ K562 cells were transfected (Supplemental Table S1). Cells were transfected with 4 µL TE to use as a negative control for puromycin selection. Transfected cells were selected with puromycin (2.5 µg/mL). K562 media with puromycin was replaced every 2 d. Cell counts were performed either using PrestoBlue (Thermo Fisher Scientific A13261) and fluorescence detection with the Synergy H1 Multi-Mode Microplate Reader, or were stained with trypan blue and counted on a hemocytometer.
Flow cytometry of GFP expression assays
On day 8 after transfection, GFP expression was measured using the Sony SH800S Cell Sorter. For each experiment, a 100 µM chip and the Optical Filter Pattern 2 were used; the 405, 488, and 561 nm lasers were enabled; automatic color compensation was turned off; and sensor gain settings were set to the following values: forward scatter (FSC) = 3, back scatter (BSC) = 30.5%, and FL2 (GFP) = 36.5%.
Using FlowJo v10.7.2, single live cells were gated using side scatter (SSC) and FSC values from a TE (mock) transfected cell sample. GFP expression data were plotted on a histogram of unit area versus GFP fluorescence (525 ± 50 nm).
Generation of barcoded reporter plasmids
Sleeping Beauty reporter constructs used in this study were barcoded using a Gibson Assembly approach before introduction into K562 cells (Supplemental Fig. S3). The plasmid backbone to be barcoded was PCR amplified using pTR-GibsonBC-FW and pTR-GibsonBC-RV primers, and the correct length fragment was purified from a 1% agarose gel. Next, Gibson Assembly was performed using the amplified plasmid backbone and a synthesized DNA fragment “GibsonBC4” according to the manufacturer's protocol (NEB E2611L). Barcoded plasmid library DNA was purified using the Zymo Clean & Concentrate-5 (Zymo Research D4014) protocol before transformation. Purified barcoded plasmid DNA was transformed into electrocompetent MegaX DH10B-T1 bacteria (Thermo Fisher Scientific C640003) using an Eppendorf 2510 electroporator set to 1800 V. After recovering for 1 h at 37°C, transformation reactions were transferred to 50 mL LB Media with 100 µg/mL ampicillin and incubated for 16 h at 37°C, shaking at 220 RPM. Barcoded plasmid library DNA was purified using the ZymoPure II Plasmid Maxiprep kit protocol and quantified on a NanoDrop.
Genomic DNA purification
At 11–14 d post-transfection, cell pellets containing 3 × 10⁶ to 4 × 10⁶ cells each were snap frozen in LN2 and stored at −80°C until DNA extraction. Cell pellets were allowed to warm to room temperature, and then were resuspended in 385 µL DNA Quick Extract (Lucigen QE09050) and transferred to a 1.5 mL tube. Cells were incubated for 15 min at 65°C, followed by 5 min at 98°C. After cooling briefly, 10 µL Proteinase K (Sigma-Aldrich P4850-5ML) was added, and cell lysate was incubated overnight at 55°C. The following day, 5 µL RNase A (Sigma-Aldrich R4642-50MG) was added, and the cell lysate was incubated for 30 min at 37°C. Genomic DNA was precipitated by adding 4 µL Glycoblue (Thermo Fisher Scientific AM9515), 40 µL 3M Sodium Acetate, and 1 mL ice-cold 100% ethanol. After incubating at −80°C for 1 h, DNA was pelleted by centrifugation at 20,000g for 30 min at 4°C. The DNA pellet was washed twice with 70% ethanol and then resuspended in 200 µL Buffer EB (Qiagen 19086).
RNA purification
At 11–14 d post-transfection, cell pellets containing 1 × 10⁶ cells each were resuspended in 350 µL TRIzol solution (Thermo Fisher Scientific 15596026) and stored at −80°C until RNA extraction. Frozen samples were allowed to warm to room temperature, and then 350 µL cell solution was transferred to a Phase-Lock gel tube (Thermo Fisher Scientific NC1093153). To each Phase-Lock tube, 70 µL chloroform was added and shaken vigorously, followed by a 2 min incubation at room temperature. Tubes were centrifuged at 12,000g for 10 min at 4°C. Following centrifugation, the aqueous phase was decanted from each tube and transferred to a new tube. Then, 350 µL 70% ethanol was added and mixed well, and the solution was transferred to a Qiagen RNeasy-mini spin column. Samples were centrifuged at 13,000g for 15 sec, and the flow-through was discarded. Next, 350 µL Buffer RW1 was added to each column, samples were centrifuged at 13,000g for 15 sec, and the flow-through was discarded. This Buffer RW1 wash was repeated once more for a total of two washes. Next, 500 µL Buffer RPE was added to each column, samples were centrifuged at 13,000g for 15 sec, and the flow-through was discarded. This Buffer RPE wash was repeated once more for a total of two washes. After the last RPE wash, the column was centrifuged for an additional 2 min at 13,000g to remove residual ethanol. Samples were eluted in 40 µL RNase-free H2O.
To ensure that the RNA preparation was DNA-free, we used the Ambion TURBO DNA-free kit protocol (Thermo Fisher Scientific AM1907). Following DNase treatment, RNA was transferred to a fresh tube, and the concentration was quantified on the NanoDrop.
Amplicon library preparation
For DNA libraries, unique molecular identifiers (UMIs) and the inner portion of the P5 sequencing adapter were added. Twenty micrograms of genomic DNA was digested with PstI (NEB R3140L) for 1 h at 37°C and then purified using the Zymo Clean & Concentrate-25 (Zymo Research D4034) protocol. One cycle of PCR was performed with the following conditions: eight replicate 50 µL reactions were prepared, each containing 500 ng PstI-digested DNA, 1× Phusion Hot Start Flex Mastermix (NEB M0536L), and 200 nM of the primer P5_Plasmid_8N/9N/10N, and incubated for 5 min at 98°C, for 1 min at 60°C, and for 10 min at 72°C. Replicate reactions were combined and then purified using the Zymo Clean & Concentrate-5 (Zymo Research D4014) protocol, eluting the DNA in 20 µL.
For RNA libraries, cDNA was synthesized using the SuperScript IV First Strand Synthesis kit (Invitrogen), with 5 µg RNA template and 2 µM primer P5_barcode_0N/1N/2N (containing a truncated sequencing adapter) in two replicate reactions per sample. RNA was first incubated with primers and dNTPs for 10 min at 60°C, then placed on ice for 1 min. The remaining reverse transcription (RT) reagents were added, and samples were incubated for 10 min at 55°C, for 10 min at 80°C, and then cooled to 4°C. Next, 1 µL RNase H was added to each reaction, and incubated for 20 min at 37°C. Single-stranded cDNA was purified using the Zymo Clean & Concentrate-5 protocol (Zymo Research D4014), using seven volumes of DNA binding buffer and eluting in 10 µL Zymo DNA elution buffer. Unique molecular identifiers (UMIs) and the inner portion of the P7 sequencing adapter were added to each single-stranded cDNA molecule using 1 cycle of PCR with the following conditions: two replicate 50 µL reactions were prepared, each containing 5 µL cDNA, 1× Phusion Hot Start Flex Mastermix (NEB M0536L), and 200 nM of the primer P7_Plasmid_8N/9N/10N, and incubated for 5 min at 98°C, for 5 min at 64°C, and for 5 min at 72°C. Replicate reactions were combined and then purified using the Zymo Clean & Concentrate-5 (Zymo Research D4014) protocol, eluting the DNA in 20 µL.
For inverse PCR (iPCR) libraries, 40 µg genomic DNA was digested with DpnII for 2 h at 37°C. Digested DNA was purified using the Zymo Clean & Concentrate-25 column protocol, and digestion was verified by running 100 ng DpnII digested DNA out on a 1% agarose gel. Intramolecular DpnII ligation was performed using DpnII digested DNA at a concentration of 5 µg/mL, and T4 DNA ligase at a concentration of 10,000 units/mL. Ligation reactions were incubated overnight at 4°C, and ligation products were purified using the Zymo Clean & Concentrate-25 column protocol.
DNA, RNA, and iPCR libraries then amplified using a nested PCR approach to add full Illumina sequencing adapters in two stages. To add the inner P5 and P7 sequencing adapters (DNA and RNA samples already had P5 or P7 added, respectively), samples were amplified for 20–30 PCR cycles. Eight replicate 50 µL reactions were prepared, each containing 2 µL DNA, 1× Phusion Hot Start Flex Mastermix (NEB M0536L), 200 nM of the appropriate P5 and P7 primers for each library type (Supplemental Table S6), and incubated 1 cycle for 5 min at 98°C; 20–30 cycles (sample dependent) for 15 sec at 98°C, for 15 sec at 55°C, and for 30 sec at 72°C; and 1 cycle for 10 min at 72°C. Replicate reactions were combined and then purified using the Zymo Clean & Concentrate-5 (Zymo Research D4014) protocol, eluting the DNA in 20 µL.
The remaining (outer) adapter sequences with indexing barcodes were added to each library using 10 cycles of PCR with the following conditions: one 50-µL reaction was prepared per library, each containing 1 µL DNA purified from the previous round of PCR, 1× Phusion Hot Start Flex Mastermix (NEB M0536L), 200 nM of each indexed P5 and P7 primers (e.g., P5_amplicon_S502 and P7_Amplicon_N704) (Supplemental Table S6), and incubated 1 cycle for 5 min at 98°C, 10 cycles for 15 sec at 98°C, for 15 sec at 71°C, and for 30 sec at 72°C, and 1 cycle for 10 min at 72°C. Final DNA libraries were purified using the Zymo Clean & Concentrate-5 (Zymo Research D4014) protocol, eluting the DNA in 20 µL. Completed libraries were quantified using the Qubit dsDNA HS (Thermo Fisher Scientific Q32851) kit protocol.
Single-cell RNA-seq library preparation
Cells were transfected as described above (Supplemental Table S1). To enrich for cells that received the transposase construct, mKate-positive cells were sorted into new plates 24 h after transfection using a Sony SH800 cell sorter as described above, except that the 665 ± 30 nm optical filter was used to gate for mKate fluorescence, and expanded.
scRNA-seq expression libraries were generated using the 10x Chromium Next GEM Single Cell 3′ workflow (10x Genomics 1000128). For Experiment 4, an additional sort for GFP-positive cells was performed on day 4, and 5700 cells were collected for scRNA-seq (Supplemental Table S5), whereas the remaining cells were expanded in culture for an additional 7 d, at which point cell pellets were collected for RNA, DNA, and iPCR libraries.
For Experiment 5, cell pellets were collected for RNA, DNA, and iPCR libraries, and cells were frozen 14 d post-transfection. After thawing cells and expanding for 2 d, cells were collected from each of four separate transfections and pooled for scRNA-seq libraries (Supplemental Table S5). Additional pellets were collected post-thaw for additional RNA, DNA, and iPCR libraries.
Separate libraries enriched for reporter transcripts were generated from the cDNA produced in the Post GEM–RT Cleanup & cDNA Amplification step of the 10x Chromium Single Cell 3′ (v3.1) library protocol using PCR with the following conditions: eight replicate 25 µL reactions were prepared, each containing 1 µL amplified 10x Chromium Single Cell cDNA, 1× Phusion Hot Start Flex Mastermix (NEB M0536L), 500 nM of the primer P5_Halfsite, and 500 nM of the primer P7_10xSBbarcodeV2_0N, and incubated 1 cycle for 5 min at 98°C; eight cycles (sample dependent) for 15 sec at 98°C, for 15 sec at 66°C, and for 30 sec at 72°C; and one cycle for 10 min at 72°C. Replicate reactions were combined and then purified using the Zymo Clean & Concentrate-5 (Zymo Research D4014) protocol, eluting the DNA in 20 µL. Completed indexed adapter sequences were added to each library during a final 10 cycles of PCR using the conditions described in DNA Library Preparation above. Completed libraries were quantified using the Qubit dsDNA HS (Thermo Fisher Scientific Q32851) kit protocol.
Sequencing and analysis
Illumina libraries were generated and sequenced on an Illumina NextSeq 500. Reads were demultiplexed by a standard pipeline using Illumina bcl2fastq v2.20, requiring a perfect match to indexing BC sequences.
DNA, RNA, iPCR, and enriched scRNA-seq libraries were processed by a custom pipeline (Supplemental Table S2). Read pairs whose sequence comprised >75% G bases were dropped. PCR primer sequence was removed, and UMI and cell barcodes (cell BC) were extracted using UMI-tools v1.0.1 (Smith et al. 2017) including the option “‐‐quality-filter-threshold = 30”. Reporter barcodes (BCs) were extracted from the expected position from read pairs matching the expected template sequence with <10% mismatched bases. BCs were required to have two bases or fewer with base quality score below 30. Reporter BCs, cell BCs, and UMIs were each deduplicated using a directed adjacency approach based on that of UMI-tools (Smith et al. 2017).
iPCR libraries were trimmed to remove plasmid sequences, including the potential for digestion at a secondary DpnII site using cutadapt v2.9 (Martin 2011). Reads were then mapped to a hg38 reference genome augmented with transposon and Sleeping Beauty sequences using BWA v0.7.12 (Li and Durbin 2009). Libraries for which read 1 was sequenced to 24 bp or more beyond the end of the plasmid sequence were mapped in paired-end mode using BWA-MEM with -Y option. Otherwise read 2 was mapped in single-end mode using BWA aln and samse. Reads without reporter BCs, aligned with insertions or deletions, with >10% mismatch rate, with mapping quality <10, or with >1 kb between mates (for paired mapping) were excluded from further analysis. The integration insertion site was defined as the 5′ mapping site of read 2. Reporter BCs were additionally deduplicated and grouped by coordinates. Sites with the same reporter BC within ±5 bp were collapsed, and integrations of different BCs within ±5 bp were excluded. Integrations with fewer than two reads, representing <1% of the total coverage at a given genomic position, or BCs found at multiple sites were excluded.
Replicate DNA, RNA, and iPCR libraries were combined for a given experiment and normalized to one million sequenced reads in R v3.5.2 (R Core Team 2018). Missing RNA counts were imputed as 0, and only BCs with more than 10 DNA UMIs and a mapped integration site were considered. Reporter activity was computed as log2(RNA/DNA + 1).
DNase-seq data for K562 (DS9764) was downloaded from https://www.encodeproject.org and processed using a standard pipeline. DNase I hypersensitive sites were identified using hotspot v1 (John et al. 2011) hotspot peaks (1% FDR). CTCF ChIP-seq data was taken from a previously published work (Maurano et al. 2015).
Reporter activity modeling
Reporter activity was modeled using linear regression in R v3.5.2 (R Core Team 2018). The base model included two features indicating the number of DHS within 5 and 100 kb of each insertion. To assess the relevance of other genomic features, we downloaded DNase-seq of 109 different cell types, and K562 ChIP-seq data for 321 histone modifications, sequence-specific TFs, coactivators, and corepressors from the ENCODE Project, as well as lamin-associated domains (Supplemental Table S4). These data were represented as features by counting the number of DHS or ChIP-seq hotspots within 5 and 100 kb of each insertion and by a binary indicator if the insertion laid within a lamin-associated domain. Before modeling, the complete data set was divided into training and testing sets representing 75% and 25% of the data, respectively. Each regression model evaluated was fitted with a 10-fold cross-validation strategy using the training set, and the best model was later evaluated using the testing data set. The R packages rsample and recipes were used to prepare and divide the data set for training, testing, and cross-validation. The regression models were fitted using lm function and parsnip package and evaluated using the yardstick package.
Clonal inference
Cells and reporter BCs deriving from a single initial transfected clone were identified from the enriched scRNA-seq libraries using Python v3.8.1. First, we constructed a bipartite graph whose nodes were cell BCs and reporter BCs, connected by edges weighted by the pair's UMI count. Edges with fewer than two UMI were dropped. The Jaccard index of reporter BC overlap for all pairs of cells within a clone was computed as the sum of edge weights connecting the cells to shared BCs divided by the sum of the UMIs for both cells. For all cell pairs whose Jaccard index was <30%, the edge with the lowest weight between either cells was removed for each shared BC.
For Experiment 5, for which scRNA-seq data was generated from a superloaded pool of four independent transfections, each reporter BC was labeled by its known transfection based on the union of all DNA/RNA/iPCR data. BCs found in more than one transfection were removed from the graph. Edges connecting a cell BC to a reporter BC from a transfection representing <80% of the cell's total UMI were trimmed. Nodes directly connected to two different transfections (i.e., doublets or reporter BC collisions) were dropped.
To filter out chimeric PCR artifacts, edges representing <5% of total UMI for a given reporter BC or <2% for a given cellBC were removed. Reporter BCs mapping to multiple integration sites or found in multiple transfections were removed. Finally, edges bridging two independent communities of two or more nodes with <20% centrality and representing <10% of each community's UMIs were pruned. Unconnected nodes were pruned. The remaining connected communities were defined as clones.
scRNA-seq analysis
scRNA-seq 3′ libraries were analyzed using Cell Ranger v4.0.0 (Zheng et al. 2017). A genomic reference was constructed against hg38 and transposon sequences as described above in sequencing and analysis. Ensembl release 93 was used for gene annotations. Only cellBCs contained in the whitelist of non-empty cellBCs and absent from blacklists of poor-quality cellBCs with few UMIs and/or too many pSB reads were considered in further analysis.
Reporter effects on endogenous gene expression
We explored the reporter impact on genes whose TSS lay within 250 kb from a reporter. For each reporter and gene, we compared the expression on the set of perturbed cells (those belonging to the reporter's clone) against all other cells. Only genes with Ensembl category of protein_coding or lincRNA were considered. Only cells included in both single-cell expression and clone assignments were used. To avoid potential confounding from nearby reporter insertions in the same clone, we discarded any reporters with a second reporter within 500 kb. Based on power simulations, tests with fewer than three perturbed cells, average target gene expression in the perturbed or unperturbed cells of less than 10 UMI, or overall average expression below 0.05 UMI were excluded from the analysis.
Differential expression of clonal alterations local effects (DECAL) models the reporter effect using a negative binomial (or
Gamma-Poisson) regression with regularized dispersion estimate:
 (1)
(1)
 (2)
where Y is the observed counts for a particular gene across all cells, µ is the expected average gene UMI count, θ is the gene UMI distribution dispersion, β0 and βc are the regression coefficients, depth is the cell total UMI count, and X is an indicator vector that is 1 if the cell belongs to the reporter clone (perturbed) or 0 if it does not (unperturbed).
To estimate the distribution dispersion (θ) of each gene, we used the approach of Hafemeister and Satija (2019) of fitting a Poisson regression [
(2)
where Y is the observed counts for a particular gene across all cells, µ is the expected average gene UMI count, θ is the gene UMI distribution dispersion, β0 and βc are the regression coefficients, depth is the cell total UMI count, and X is an indicator vector that is 1 if the cell belongs to the reporter clone (perturbed) or 0 if it does not (unperturbed).
To estimate the distribution dispersion (θ) of each gene, we used the approach of Hafemeister and Satija (2019) of fitting a Poisson regression [ ] for a random subset of 2000 genes and estimating θ using maximum likelihood. Then, we expanded the estimation to all genes with average expression ≥0.05 UMIs by fitting a kernel
regression of θ in relation to the gene average expression.
] for a random subset of 2000 genes and estimating θ using maximum likelihood. Then, we expanded the estimation to all genes with average expression ≥0.05 UMIs by fitting a kernel
regression of θ in relation to the gene average expression.
Perturbation (βc) significance was estimated by two-tailed P-value based on Student's t-distribution. Storey's Q-value approach was used for multiple testing correction (Storey and Tibshirani 2003) for each transfection individually. Tests with Q-value <0.05 were considered significant.
We performed simulations based on Equation (1) to estimate detection power over a range of clone sizes (n) and effect sizes with a fixed dispersion (θ) of 100. For each simulation condition, we generated UMI counts for 1000 genes and the same number of cells as the actual scRNA-seq data set. Expected average gene UMI counts (µ) ranged from the minimum and maximum observed values in the actual scRNA-seq data set in a logarithm scale. For each gene, n cells were sampled and their UMI counts altered by the defined effect size. The resulting simulations were evaluated by our analysis algorithm given only the simulated count matrix and cells assignment as perturbed and unperturbed.
TAD definitions for K562 cells were derived from previously published contact matrices (GSE63525_K562_intrachromosomal_contact_matrices.tar.gz) (Rao et al. 2014) and KR normalized. To identify TADs, Armatus v2.2 (Filippova et al. 2014) was used with gamma = 0.5.0 and a resolution of 5 kb. Results were lifted over to hg38 using UCSC liftOver (Supplemental Data S1).
A K562 copy number map based on shotgun whole-genome sequencing was obtained (Zhou et al. 2019). Calls in hg19 were divided into 500-bp intervals, lifted over to hg38 using UCSC liftOver, and then consolidated. Regions in hg38 covered by discrepant copy number calls were excluded from analysis.
Software availability
Code used in sequencing data processing is available at GitHub (https://github.com/mauranolab/mapping/tree/master/transposon). ChIP-seq and DNase-seq data were processed using a standard pipeline available at GitHub (https://github.com/mauranolab/mapping/tree/master/dnase). Code used for scRNA-seq differential expression analysis is available at GitHub (https://github.com/mauranolab/decal). All repositories are also available as Supplemental Code.
Data access
All raw and processed sequencing data generated in this study have been submitted to the NCBI Gene Expression Omnibus (GEO; https://www.ncbi.nlm.nih.gov/geo/) under accession number GSE179485.
Competing interest statement
The authors declare no competing interests.
Acknowledgments
This work was partially funded by National Institutes of Health (NIH) grant R35GM119703 to M.T.M.
Footnotes
-
[Supplemental material is available for this article.]
-
Article published online before print. Article, supplemental material, and publication date are at https://www.genome.org/cgi/doi/10.1101/gr.276449.121.
- Received December 1, 2021.
- Accepted January 25, 2022.
This article is distributed exclusively by Cold Spring Harbor Laboratory Press for the first six months after the full-issue publication date (see https://genome.cshlp.org/site/misc/terms.xhtml). After six months, it is available under a Creative Commons License (Attribution-NonCommercial 4.0 International), as described at http://creativecommons.org/licenses/by-nc/4.0/.


