
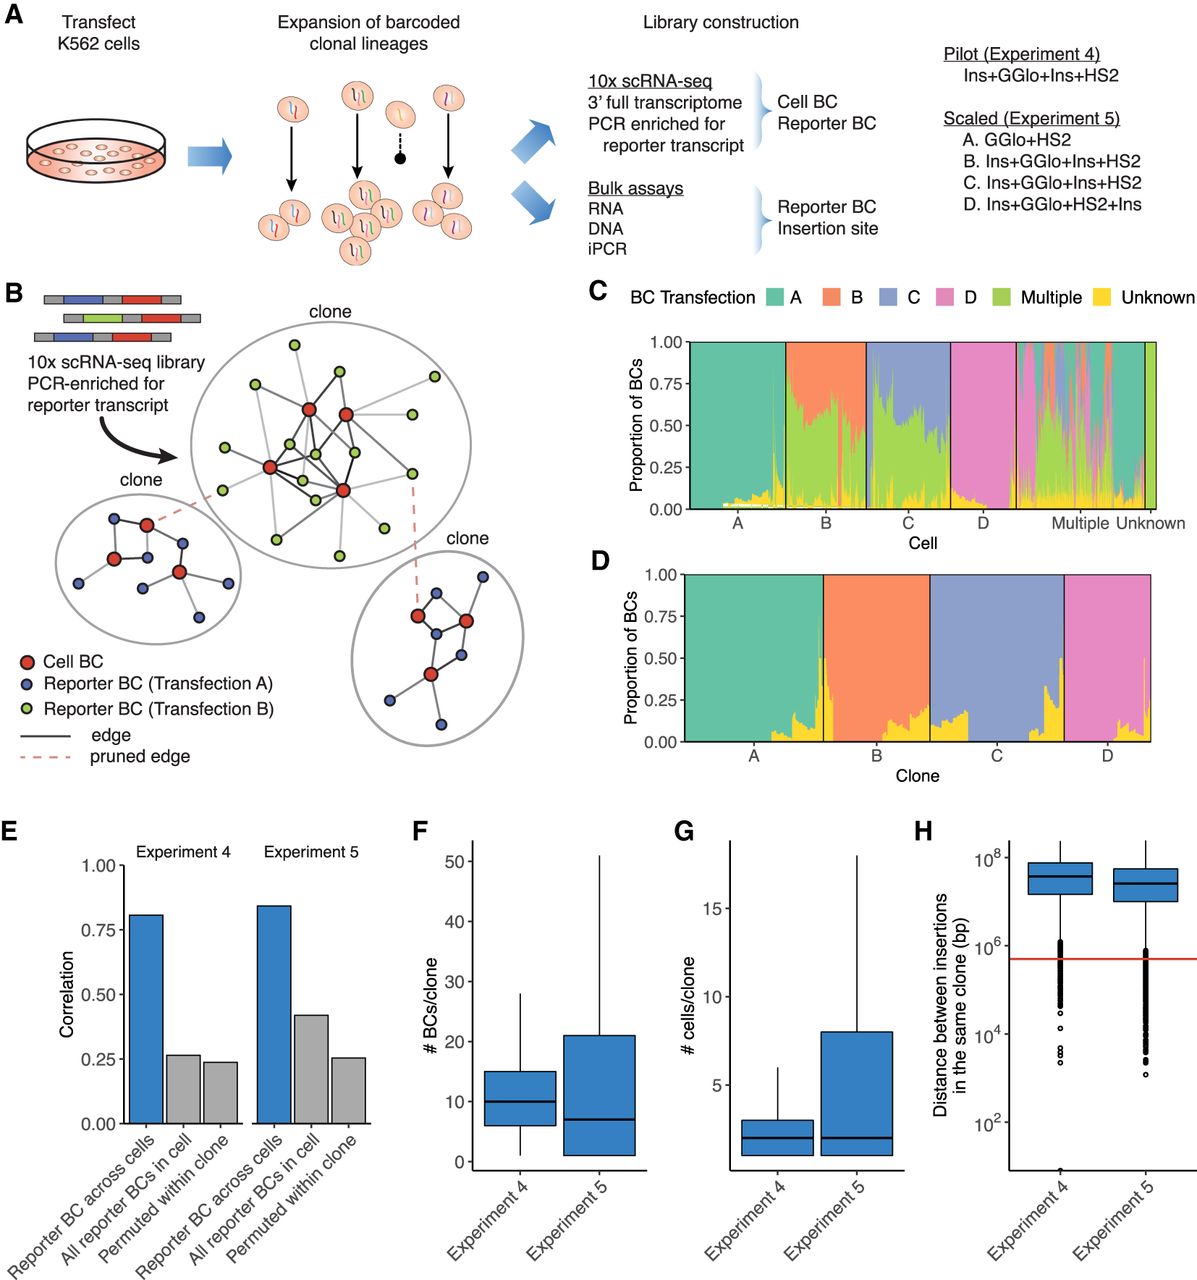
scRNA-seq inference of clonal relationship of reporter insertions. (A) scRNA-seq experiment to infer clonal relationships between single cells using presence of reporter BCs. (B) Graph-based inference of clones from scRNA-seq data using reporter BC to link cells deriving from the same clone. (C,D) Deconvolution of pooled transfections in Experiment 5. The x-axis represents cells (C) or final inferred clones (D), grouped by inferred transfection and ordered according to hierarchical clustering. (Multiple) reporter BCs or cellBCs linked to multiple transfections; (Unknown) reporter BCs or cellBCs detected only in scRNA-seq data. (E) Reporter BC counts show high correlation across multiple cells. All reporter BCs in the same cells or reporter BC counts shuffled within clones show little correlation. (F–H) Summary of clones including number of cells per clone (F), number of reporter BCs per clone (G), and distance between reporters integrated in cells derived from the same clone (H). Boxes represent 1st and 3rd quartiles, horizontal bars indicate median, and whiskers represent ±1.5 interquartile range. Horizontal red line in H at 500 kb indicates distance cutoff selected for insertions in the same clone to be considered independent.


