
Transcriptome evidence reveals enhanced autophagy-lysosomal function in centenarians
- Fu-Hui Xiao1,2,4,7,12,
- Xiao-Qiong Chen1,2,4,7,12,
- Qin Yu1,2,4,5,7,12,
- Yunshuang Ye1,5,6,12,
- Yao-Wen Liu1,2,4,5,7,
- Dongjing Yan3,
- Li-Qin Yang1,2,4,7,
- Guijun Chen6,
- Rong Lin8,
- Liping Yang6,
- Xiaoping Liao9,
- Wen Zhang3,
- Wei Zhang5,6,
- Nelson Leung-Sang Tang4,10,
- Xiao-Fan Wang11,
- Jumin Zhou6,
- Wang-Wei Cai3,
- Yong-Han He1,2,4,7 and
- Qing-Peng Kong1,2,4,7
- 1State Key Laboratory of Genetic Resources and Evolution/Key Laboratory of Healthy Aging Research of Yunnan Province, Kunming Institute of Zoology, Chinese Academy of Sciences, Kunming 650223, China;
- 2Center for Excellence in Animal Evolution and Genetics, Chinese Academy of Sciences, Kunming 650223, China;
- 3Department of Biochemistry and Molecular Biology, Hainan Medical College, Haikou 571199, China;
- 4KIZ/CUHK Joint Laboratory of Bioresources and Molecular Research in Common Diseases, Kunming 650223, China;
- 5Kunming College of Life Science, University of Chinese Academy of Sciences, Beijing 100049, China;
- 6Key Laboratory of Animal Models and Human Disease Mechanisms of the Chinese Academy of Sciences/Key Laboratory of Healthy Aging Research of Yunnan Province, Kunming Institute of Zoology, Kunming 650223, China;
- 7Kunming Key Laboratory of Healthy Aging Study, Kunming 650223, China;
- 8Department of Biology, Hainan Medical College, Haikou 571199, China;
- 9Department of Neurology, the First Affiliated Hospital of Hainan Medical College, Haikou 571199, China;
- 10Department of Chemical Pathology and Laboratory for Genetics of Disease Susceptibility, Li Ka Shing Institute of Health Sciences, and School of Biomedical Sciences, Faculty of Medicine, The Chinese University of Hong Kong, Hong Kong 999077, China;
- 11Department of Pharmacology and Cancer Biology, Duke University Medical Center, Durham, North Carolina 27710, USA
-
↵12 These authors contributed equally to this work.
Abstract
Centenarians (CENs) are excellent subjects to study the mechanisms of human longevity and healthy aging. Here, we analyzed the transcriptomes of 76 centenarians, 54 centenarian-children, and 41 spouses of centenarian-children by RNA sequencing and found that, among the significantly differentially expressed genes (SDEGs) exhibited by CENs, the autophagy-lysosomal pathway is significantly up-regulated. Overexpression of several genes from this pathway, CTSB, ATP6V0C, ATG4D, and WIPI1, could promote autophagy and delay senescence in cultured IMR-90 cells, while overexpression of the Drosophila homolog of WIPI1, Atg18a, extended the life span in transgenic flies. Interestingly, the enhanced autophagy-lysosomal activity could be partially passed on to their offspring, as manifested by their higher levels of both autophagy-encoding genes and serum beclin 1 (BECN1). In light of the normal age-related decline of autophagy-lysosomal functions, these findings provide a compelling explanation for achieving longevity in, at least, female CENs, given the gender bias in our collected samples, and suggest that the enhanced waste-cleaning activity via autophagy may serve as a conserved mechanism to prolong the life span from Drosophila to humans.
Centenarians (CENs) exhibit unique characteristics of delaying or even escaping many serious age-related diseases afflicting the normal population (e.g., cardiovascular disease, Alzheimer's disease, type-2 diabetes, and cancer) (Hitt et al. 1999; Evert et al. 2003). Currently, many longevity-associated genes and pathways have been identified in model organisms (Christensen et al. 2006; De Magalhaes 2014); however, it is unclear whether and how any of these genes or pathways affect human longevity, as the determinants of human longevity might be different from animal models. For example, the genetic variants of several genes, e.g., daf-2, daf-16, sir-2, and Igf-1r, were shown to extend the life span of model organisms (Kimura et al. 1997; Ogg et al. 1997; Tissenbaum and Guarente 2001; Holzenberger et al. 2003); however, most of these have yet to be confirmed in humans. Therefore, how long-lived people acquire the ability to extend their healthy life span remains poorly understood.
CENs are excellent subjects for studying the mechanisms of healthy aging due to the ability to remain healthy throughout their entire lives (Hitt et al. 1999; Franceschi and Bonafe 2003; Engberg et al. 2009). Presently, only a very limited number of longevity-associated variants or genes were detected in the long-lived individuals even with genome-wide sequencing/screening studies (Erikson et al. 2016; Zeng et al. 2016), suggesting that most of the determinants of human longevity exist outside genetic variations. Indeed, the regulation of gene expression plays critical roles in development and in maintaining proper physiological conditions, as aberrant gene expression is often associated with age-related diseases (Ershler and Keller 2000). To gain insight into the whole-genome expression profiles in long-lived individuals, we obtained and analyzed the transcriptomes (RNA sequencing on HiSeq platforms) of peripheral white blood cells from 76 CENs, 54 centenarian-children (F1), and 41 spouses of centenarian-children (F1SP) from Chinese CEN families, aiming to discover the factors contributing to human longevity.
Results
RNA sequencing of centenarians, centenarian-children, and spouses of centenarian-children
We collected a cohort of 171 subjects from centenarian families, consisting of 76 CENs (age: 102.2 ± 2.4 yr; gender: 58 females + 18 males), 54 F1 (age: 63.2 ± 7.7 yr; gender: 3 females + 51 males), and 41 F1SP (age: 59.9 ± 6.6 yr; gender: 40 females + 1 male). Cell-type composition (i.e., lymphocytes, granulocytes) of blood samples was analyzed, and no significant differences in the proportion of these cell types were seen among CEN, F1, and F1SP groups (Supplemental Fig. S1A), nor was there any significant association between the ratio of cell types and age (Supplemental Fig. S1B). Next, the transcriptomes of peripheral white blood cells were generated on HiSeq (Illumina) platforms (see Supplemental Table S1 for a detailed summary of the data). Gene-level read counts and FPKM (fragments per kilobase of exon per million fragments mapped) values were calculated (see Methods). A total of 10,481 coding genes with at least 10 reads in all samples (FPKMmean > 0.05) were detected (Toung et al. 2011). The workflow is illustrated in Figure 1A.
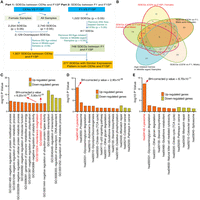
Significantly differentially expressed genes (SDEGs) between the CEN and F1SP groups. (A) Workflow of data analysis. (B) Venn diagram for the SDEGs in CEN and F1SP samples. (C) Gene Ontology enrichment analysis on SDEGs meeting a threshold value of P < 5.0 × 10⁻². (D) KEGG pathway enrichment analysis on SDEGs meeting a threshold value of P < 5.0 × 10⁻². (E) KEGG pathway enrichment analysis on SDEGs meeting stringent threshold with BH-corrected P-value < 5.0 × 10⁻².
Significantly differentially expressed genes (SDEGs) exist in CENs
To detect the changes in gene expression between longevity subjects and younger adult controls, we first employed a threshold with P < 5.0 × 10⁻² to identify SDEGs between CENs and F1SPs using a DESeq2 package (Love et al. 2014). Consistent with the sex ratio in general CEN populations elsewhere (Passarino et al. 2002), the CENs we recruited consist of more females than males (3:1). We thus first analyzed the data only from the female subjects and identified a total of 2254 SDEGs between the CENs and F1SPs (P < 5.0 × 10⁻²), of which 1119 SDEGs were up-regulated while 1135 were down-regulated. These SDEGs remain largely unchanged (2129/2254) after the male subjects were considered as well (Fig. 1B). Among these 2129 SDEGs, 1340 meet a more stringent threshold of Benjamini-Hochberg (BH)-corrected P-value < 5.0 × 10⁻². To filter out the effect of aging on the identified SDEGs between CENs and F1SPs, age-gene expression association analyses were conducted in the middle-aged samples (age: 45–78 yr old; including all F1 and F1SP subjects). The results showed that only 9.49% (202/2129) SDEGs displayed associations between their expression and age, with P < 5.0 × 10⁻² (Fig. 1B). Interestingly, among the remaining 1927 SDEGs, 69 have been recorded in the GenAge database with potential longevity-regulatory roles in model organisms, such as EIF4EBP1 (up-regulated), PRDX1 (up-regulated), and EPC1 (down-regulated) (De Magalhaes and Toussaint 2004). In addition, several other genes have already been suggested to regulate longevity in model organisms, such as MYC and PDK1 (down-regulated in CENs) and GSR (up-regulated in CENs) (Mockett et al. 1999; Mouchiroud et al. 2011; Hofmann et al. 2015). Besides the cell-type compositions (i.e., lymphocytes, granulocytes) considered in this study, we also analyzed the expression of 12 key genes that are unique to specific blood cell types (e.g., CD3D [T cell], CD19 [B cell]). The results showed that only one of these genes has a significant expression difference between CENs and F1SPs (Supplemental Table S2), indicating that the effect of cell types on the findings is insignificant.
SDEGs in the lysosomal pathway tend to be up-regulated in CENs
To investigate the biological processes and pathways associated with the 1927 SDEGs, we performed enrichment analyses using the web tool “DAVID” (Huang et al. 2009a,b) and found that the up-regulated SDEGs are enriched in membrane invagination, endocytosis processes (GO:0010324, GO:0006897) (BH-corrected P < 5.0 × 10⁻²), and lysosome, proteasome, degradation-related pathways (hsa04142, hsa03050) (BH-corrected P < 5.0 × 10⁻²) (Fig. 1C,D; Supplemental Tables S3, S4). In contrast, the down-regulated genes were enriched in the regulation of transcription, RNA metabolic processes (GO:0045449, GO:0051252) (BH-corrected P < 5.0 × 10⁻²), mismatch repair, and cancer-related signaling pathways (hsa03430, hsa05210, hsa05200) (P < 5.0 × 10⁻²) (Fig. 1C,D; Supplemental Tables S3, S4). Importantly, we found that the lysosome pathway is enriched among the 612 up-regulated genes after we performed enrichment analysis on the 1193 SDEGs that satisfy the stringent threshold of BH-corrected P-value < 5.0 × 10⁻² (BH-corrected P-value = 6.70 × 10⁻¹¹) (Fig. 1E).
To determine whether this enrichment is associated with longevity or merely aging, we removed the genes with differential expression between CEN and F1 from the identified SDEGs (CEN vs. F1SP). The result showed that 44.5% (858/1927) of the SDEGs have no significant expression differences between CEN and F1 (P > 5.0 × 10⁻²) (Fig. 1B), suggesting that these 858 SDEGs in the CENs are more likely associated with longevity than with age. More importantly, among these genes, the 484 up-regulated ones were still enriched in the lysosome pathway (Supplemental Fig. S2A). We then performed regression analysis to correct the gender effect and found that the up-regulated genes in the CEN group remain to be most significantly enriched in the lysosome pathway (Supplemental Fig. S2B).
We thus focused on the lysosome pathway, as it is one of the most significantly enriched pathways as suggested by multiple analytic strategies (Fig. 1D,E; Supplemental Fig. S2A,B), and 33 out of the 35 SDEGs located in this pathway are highly expressed in CENs (Fig. 2A,B; Supplemental Table S5).
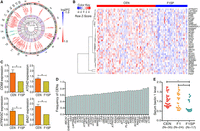
SDEGs located in the autophagy-lysosomal pathway. (A) Circos representation of the SDEGs (Krzywinski et al. 2009). (B) Heat map plot for the up-regulated SDEGs in CENs compared to F1SPs. (C) qRT-PCR validation for expression of four SDEGs in 20 CENs and four F1SPs. (D) Frequencies of CENs harboring up-regulated autophagy-lysosomal SDEGs. (E) Serum beclin 1 levels in longevity families. (*) P < 5.0 × 10⁻².
Autophagic signal is enhanced in CENs
Since the lysosome is an essential component of the autophagy-lysosomal system and plays critical roles in cellular clearance and recycling (Settembre et al. 2013), we speculated that the CEN-specific pattern of gene expression could extend beyond lysosomal genes in the autophagy-lysosomal system. We therefore investigated autophagy-related genes (ATG) family members, which control the formation of autophagosomes, a key step in macroautophagy, by delivering cytoplasmic material to the lysosome (Mizushima et al. 2011). Among the 33 ATGs, five are SDEGs between CEN and F1SP groups (P < 5.0 × 10⁻²), all of which are up-regulated in CENs (Fig. 2A,B; Supplemental Table S5).
To validate the expression results generated by RNA sequencing, we determined the mRNA levels of four randomly selected autophagy-lysosomal SDEGs (ATG4D, ATP6V0C, BAG1, and CD68) by qRT-PCR and found that all are up-regulated in CENs compared to the F1SPs (Fig. 2C). Over half of the CENs harbor at least one of the identified 38 autophagy-lysosomal SDEGs (five from ATGs, plus 33 from lysosome); e.g., the ABCA2 level is up-regulated in 53.9% of CENs and CTSB is overexpressed in 82.9% of CENs (Fig. 2D). Additionally, a resampling-based multiple testing was utilized to estimate their family-wise type 1 error rate (FWER) with maximum value = 1.1 × 10⁻² (Student's t-test; 1000 permutations). These observations altogether suggest that genes related to autophagy-lysosomal tend to be up-regulated and thus this pathway is likely enhanced in the long-lived subjects.
Next, we measured the levels of serum beclin 1 (BECN1), a pro-autophagic protein regulating the process of lysosome biogenesis and autophagy (Fekadu and Rami 2015), in samples that have undergone RNA sequencing, including CENs, F1s, and F1SPs. Consistent with a previous study on longevity populations (Emanuele et al. 2014), our CEN samples also exhibited higher serum beclin 1 concentrations compared to that from the F1SP group (P = 2.8 × 10⁻³) (Fig. 2E), indicating enhanced autophagic/lysosomal activities in these CENs.
Enhanced autophagy-lysosomal signals exist in CEN-children
To determine whether the enhanced autophagic signal exists in F1 offspring as well, we also identified the differentially expressed genes in F1 with respect to their spouses, given the fact that longevity phenotype is known to be partially heritable (20%–30% heritability) (McGue et al. 1993; Barzilai et al. 2001) and that the F1 subjects display a lower incidence of age-related disorders than the general population as well (Atzmon et al. 2004). Here, we identified 1022 SDEGs in F1 (P < 5.0 × 10⁻²), of which 274 SDEGs were disregarded from the subsequent analyses as their expression levels either associated with gender in the CENs (205 SDEGs, females vs. males in CENs, P < 5.0 × 10⁻²) or with age in the middle-aged subjects (69 SDEGs, regression analysis, P < 5.0 × 10⁻²). We noted that 279 of the 1927 SDEGs identified in CENs also exist in F1s, showing a greater ratio than expected by chance (odds ratio = 2.03; Fisher's exact test P-value = 1.11 × 10⁻¹⁹) (Fig. 3A). Moreover, by analyzing the data from a recent sex-differential transcriptome study (Gershoni and Pietrokovski 2017), we found that none of these 279 genes were expressed with sex-bias in whole blood. Among the 279 SDEGs, 277 display changes in gene expression in the same direction between CENs and their F1s (Fig. 1A), and the up-regulated genes are also enriched in the autophagy-lysosome pathway (P < 5.0 × 10⁻²) (Fig. 3B). Specifically, eight out of 38 up-regulated autophagic/lysosomal genes in CENs are highly expressed in F1 (maximum FWER value = 1.4 × 10⁻²), including CTSB, CLN3, and LIPA (Fig. 3C; Supplemental Table S5), suggesting that the enhanced autophagic/lysosomal function is partly heritable. Consistent with this, F1s also exhibited significantly higher serum beclin 1 levels compared to F1SPs (P = 1.2 × 10⁻²) (Fig. 2E).
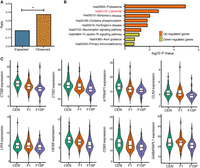
SDEGs shared by CENs and F1s compared to F1SPs. (A) Expected and observed ratio of SDEGs in F1s from that of CENs. (B) KEGG pathway analysis. (C) Expression patterns of eight autophagy-lysosomal SDEGs in CEN families. (*) P < 5.0 × 10⁻².
Overexpression of the CEN-specific autophagy-lysosomal SDEGs delays cell senescence and extends life span in Drosophila
To functionally validate the CEN-specific autophagy-lysosomal SDEGs, we tested whether these genes could promote autophagy and delay cellular senescence in IMR-90 cells (Nichols et al. 1977). We selected genes involved in lysosome and autophagosome function (two crucial components in autophagy): CTSB, an important cathepsin protease; ATP6V0C, a key factor maintaining acid pH of the lysosome; and ATG4D and WIPI1, essential components in the formation of the autophagosome. Overexpression of each of the four genes led to a reduction in SQSTM1 protein levels (Fig. 4A), a well-known autophagic substrate and marker of autophagic degradation (Pietrocola et al. 2017). Consistent with this, the overexpression of these four genes significantly decreased the percentages of cells exhibiting senescence-associated galactosidase beta 1 (SA-β-Gal) staining (Fig. 4B), increased cell proliferation (Fig. 4C), and inhibited the protein levels of CDKN2A and CDKN1A, two important senescence markers (Fig. 4D; Lawless et al. 2010). These findings suggest that the up-regulation of the new autophagic SDEGs can promote autophagy function and thus delay senescence, at least at the cellular level.
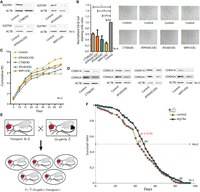
Functional studies of up-regulated autophagy-lysosomal genes in IMR-90 cells and transgenic flies. (A) Protein levels of SQSTM1 in IMR-90 cells with overexpressed CTSB, ATP6V0C, ATG4D, and WIPI1, respectively. (B) The SA-β-Gal staining cell ratio in IMR-90 cells with overexpressed CTSB, ATP6V0C, ATG4D, and WIPI1, respectively. (C) Cumulative cell population doubling of IMR-90 with overexpressed CTSB, ATP6V0C, ATG4D, and WIPI1. (D) Protein levels of CDKN2A and CDKN1A in IMR-90 cells with overexpressed CTSB, ATP6V0C, ATG4D, and WIPI1, respectively. (E) Diagram of Gal4-UAS system in flies. (F) Survival curve of Drosophila with overexpressed Atg18a. (*) P < 5.0 × 10⁻². (OE) Overexpression.
Since CEN-specific genes are indicated in a correlative but not a causal relationship between gene overexpression and extended life span, we examined the role of WIPI1 in transgenic Drosophila and observed an extension of life span of the transgenic flies compared to control flies when the fly homolog of WIPI1, Atg18a, was overexpressed in Drosophila by the Gal4-UAS system (Fig. 4E,F). Transgene expression as monitored by qRT-PCR and western blot confirmed that the transgene is expressed (Supplemental Fig. S3A,B). This result suggests that, at the very least, overexpression of the lysosomal-autophagsomal genes in CENs is likely the cause rather than effect of extended life span.
Discussion
Although the autophagy-lysosomal system plays an essential role in the anti-aging process by clearing toxic, aggregate-prone proteins to maintain normal cellular functions in model organisms including nematode (Meléndez et al. 2003), Drosophila (Simonsen et al. 2008), and mice (Pyo et al. 2013), such a role in humans has not been identified. Here, we provide evidence demonstrating that the autophagy-lysosomal function is significantly enhanced in CENs. We report that a number of CEN-specific SDEGs are from the longevity-associated pathways, such as mTOR, insulin/IGF-1, and p53 (Supplemental Table S6; Lin et al. 2001; Tavernarakis et al. 2008; Johnson et al. 2013); several of these genes are located in the nodes of the pathways and consistently have the potential to induce autophagy. For example, the decreased expression of IGF1R and IRS1 genes can activate autophagic function via decreasing insulin/IGF-1 signal (Rubinsztein et al. 2011), while the higher expression of the DDIT4 gene could promote autophagy through suppressing the mTOR signaling pathway (Liu et al. 2014). These findings underscore a crucial role for autophagy in human longevity.
Normally, the efficiency of autophagic/lysosomal degradation declines during aging (Salminen and Kaarniranta 2009), which is consistent with the increased intracellular accumulation of waste products and thus the high incidence of age-related neurodegenerative disease and cardiovascular disease in the elderly (Levine and Kroemer 2008; Nair and Ren 2012). Although some lysosomal genes are likely up-regulated during aging to compensate for the overall decline in the waste removal function (De Magalhaes et al. 2009), this could not explain the up-regulated autophagy-lysosomal genes in CENs. First, none of the up-regulated autophagy-lysosomal genes show age-related expression changes in the middle-aged samples (Supplemental Table S7). Second, only a small number of SDEGs in the autophagy-lysosomal pathway (i.e., CD63, CD68, CTSD, CTSH, GLB1, GUSB) were reported to be age-related in general populations (De Magalhaes et al. 2009; Peters et al. 2015). Third, some of the autophagy-lysosomal DEGs are also up-regulated in F1s who have a similar age distribution with F1SPs, indicative of a partially heritable nature of enhanced autophagy-lysosomal functions. Fourth, the long-lived individuals (about 100 yr old) have higher autophagic signal in their skin fibroblasts than either the old (about 75 yr old) or the young (about 27 yr old) subjects, while there is no significant difference between the old and the young groups (Sgarbi et al. 2014). Finally, and most importantly, an enhanced autophagy-lysosomal function has been shown to extend the life span in model organisms, as revealed by two recent studies in mouse, with one revealing that activating the autophagy-lysosome pathway improves the function of quiescent neural stem cells in old mice (Leeman et al. 2018), while the other showed that increasing the autophagic function via disrupting the beclin 1-BCL2 complex can improve the health span and promote longevity in mice (Fernandez et al. 2018). Among the autophagy-lysosomal SDEGs in CENs, higher expression levels of GABARAPL1, ATG4D, and LIPA extended the worm life span (De Magalhaes and Toussaint 2004; Folick et al. 2015), and up-regulated Cln3 promoted longevity in flies (Tuxworth et al. 2011). Consistently, we demonstrated that Atg18a extended the fly life span (Fig. 4F).
Taken together, life span extension in CENs, at least in female CENs given the gender bias in our collected samples, is more likely a result of enhanced lysosomal-autophagic function (Supplemental Fig. S4), and the descendants of these CENs may partially inherit the trait. The waste-cleaning activity via autophagy may serve as a conserved mechanism to prolong the life span across various species, including humans.
Methods
Sampling and RNA sequencing
A total of 171 individuals from longevity families, consisting of 76 CENs, 54 F1, and 41 F1SP, were recruited from Hainan province, China. Because the parents almost always live with their sons in China, most of the F1 samples collected are males. Cell composition of peripheral blood samples were measured with blood routine testing. Next, peripheral blood samples were treated with red blood cell lysis buffer (Tiangen) and then centrifuged at 4000 rpm for 10 min to extract white blood cells, which were stored in liquid nitrogen. Then, total RNA of each sample was extracted using the TRIzol method. The research protocol was approved by the Ethics Committee at Kunming Institute of Zoology, Chinese Academy of Sciences. Written informed consent was obtained from each of the participants prior to the study.
From the RNA samples, 121 and 50 libraries were constructed with Poly(A) capture and Ribosomal RNA depletion methods, respectively. For the Poly(A)+ libraries, Poly(A)+ mRNA was isolated using oligo(dT) beads from 1 µg of total RNA of each sample. The construction of RNA-seq libraries was done according to the protocol of TruSeq RNA library preparation. Sixty-three RNA libraries were sequenced on the Illumina HiSeq 2000 platform with paired-end 100-bp reads production (>4.5 Gbp reads), and the other 58 RNA libraries were sequenced on the Illumina HiSeq 4000 platform with paired-end 150-bp reads production (>6.0 Gbp reads). For the Ribo(−) libraries, a Ribo-Zero kit was used to remove the rRNA from the total RNA. The prepared libraries were sequenced on the Illumina HiSeq 4000 platform with paired-end 150-bp reads production (>12.0 Gbp reads).
The FastQC program was used for quality assessment (http://www.bioinformatics.babraham.ac.uk/projects/fastqc/). For the RNA-seq data generated on HiSeq 2000, the reads with Q20 > 95% and Q30 > 90% were retained. For the data produced on HiSeq 4000, the reads were trimmed using the Trimmomatic (version 0.33) tool with parameters LEADING:2, TRAILING:2, SLIDINGWINDOW:3:15, MINLEN:75 (Bolger et al. 2014). The remaining clean reads were used in subsequent analyses (see detailed Q20/Q30 distribution of samples in Supplemental Fig. S5A).
SDEGs analysis
The clean reads were aligned to the human reference genome (UCSC build hg19) with TopHat2 (Kim et al. 2013) combined with Bowtie 2 (ratio of mapped reads: 94.1% ± 1.4%) (Supplemental Figs. S5B, S6; Langmead and Salzberg 2012), and only the reads with unique alignment hits were retained. Then, a total of ∼150 million uniquely mapped 100-bp paired-end reads and 336 million uniquely mapped 150-bp paired-end reads were used in further analysis. The summarizeOverlaps function in the “GenomicAlignments” package was used to calculate the read counts for each gene in each sample. A total of 19,229 coding genes were referenced in our study based on the annotation of RefSeq genes (hg19). Of all coding genes, only those with coverage of at least 10 reads in all subjects were retained. Then, the SDEGs were identified with DESeq2 considering the effect of library type and read length, using raw read count of each gene in negative binomial generalized linear models (Love et al. 2014). The major command line of R language is “DESeqDataSetFromMatrix (countData = countdata, colData = coldata, design = ∼ library_type + read_type + condition)”. In the formula, count-data is gene-level read count matrices; coldata includes sample information, like library type, read type, etc. (see Supplemental File S1 for detailed information for identifying SDEGs).
In this study, the FPKM value of genes for each subject was calculated as (Ren et al. 2013)

The data were grouped into three batches as “A”, “B”, and “C” based on the different library type and read length (“A”: Poly(A)+ library + 100-bp read length; “B”: Poly(A)+ library + 150-bp read length; “C”: Ribo(−) library + 150-bp read length). The batch effect of the FPKM value of samples was corrected with the ComBat function in the “sva” package with the R platform (Leek et al. 2012). The function formula is “Combat(dat = expdata, batch = batches, mod = NULL)” (expdata: FPKM data set; batches: the corresponding batch for each sample including “A”, “B”, “C”). This method is effective in correcting for the batch effects in this project (Supplemental Fig. S7A,B).
Enrichment analysis
The web tool “DAVID (version 6.7)” was utilized to perform biological process and pathway enrichment analyses, with a hypergeometric test to calculate the P-value that is further corrected with the Benjamini-Hochberg method, and to obtain the gene list on the lysosome pathway (Huang et al. 2009a,b). In addition, the list of the 33 autophagy-related genes were obtained from the HGNC database (Gray et al. 2014).
Age-gene expression association analysis
Pearson's correlation test was used to evaluate the association between gene expression and age in the middle-aged samples through the cor.test function in the R platform.
Evaluation of family-wise type 1 error rate
To evaluate the family-wise type 1 error rate of each target differentially expressed gene between two groups, we conducted a resampling-based multiple testing procedure with 1000 permutations (Cui and Churchill 2003). In this analysis, Student's t-test was used to calculate the P-value vector of genes between two groups.
Frequency of CENs with up-regulated autophagy-lysosomal SDEGs
Considering the subtle expression difference between CEN and F1SP groups, a looser threshold with a fold change > 5% (by comparing the expression level of each target gene in each CEN to the median expression in the F1SP group) was set to calculate the frequency of CENs with a high gene expression level.
Measurement of serum beclin 1
Blood samples were centrifuged at 4000 rpm for 10 min to extract serum. The samples with hemolysis were discarded, and serum beclin 1 levels were measured using the enzyme-linked immunosorbent assay (ELISA) kit for beclin 1 (Cloud-Clone Crop). For each group, the values between the first quartile and the third quartile were retained for the following t-test analysis.
Cell culture and reagents
IMR-90 cells were cultured in DMEM/High glucose (HyClone) with 10% fetal bovine serum (FBS) (Gibco) and 1% penicillin/streptomycin (Beyotime) in a 37°C/5% CO2 incubator. ATG4D, WIPI1, CTSB, and ATP6V0C overexpression plasmids were constructed by using the pCDH-MSCV-E2F-eGFP lenti-viral vector and were then transduced into IMR-90 cells at passage 37. Stably transfected cells were selected in media supplemented with 2 µg/mL puromycin.
Quantitative real-time PCR
Twenty CENs and four F1SPs without undergoing RNA-seq were selected to verify the identified SDEGs. Total RNA was isolated using TRIzol reagent (Invitrogen), followed by reverse transcription using the GoScript reverse transcription system according to the manufacturer's protocol (Promega). qRT-PCR was performed using GoTaq qPCR master mix (Promega) and gene-specific primers. Gene expression levels were calculated using the comparative CT method, and beta actin was used as a control. Total RNA of transgenic flies was extracted using RNAiso Plus (TaKaRa), then reverse transcription of fruit fly RNA was carried out by using PrimeScript RT reagent kits (TaKaRa) following manufacturer protocols. qRT-PCR was performed using FastStart Universal SYBR Green Master (ROX) (Roche) and Atg18a gene-specific primers. Gene expression levels were calculated using the comparative CT method and tubulin was used as control. All the primers used are listed in Supplemental Table S8.
Population doubling analysis
For population doubling (PD) analysis, the number of cells at each passage was counted using a TC20 automated cell counter (Bio-Rad), and ∼1 × 10⁶ cells were plated on 10-cm plates every 5 d. The PD for each passage was calculated using the equation: PD = log2(NH/NI), where NH is the cell number of harvests and NI is the plating cell number. Cumulative PDs were summed by PD, and the cells after puromycin selection were considered as PD = 0.
Western blot
Cells were lysed with RIPA Lysis Buffer (Beyotime), then quantified by a BCA Protein Assay kit (Beyotime). Fifty micrograms of protein extracts were resolved by SDS-PAGE and subsequently transferred to polyvinylidene fluoride (PVDF) membranes (Bio-Rad). Membranes were incubated with the following primary antibodies: rabbit-anti-CDKN1A (ABclonal Biotech, A1483); rabbit-anti-CDKN2A (Zen Bioscience, 500262); rabbit-anti-SQSTM1 (Zen Bioscience, 380612); mouse-anti-ACTB (Beyotime, AA128); and HRP-labeled goat anti-rabbit (Beyotime, A0208) or anti-mouse IgG (H + L) (Beyotime, A0216) secondary antibody. The protein bands were detected using an ECL detection kit (Beyotime). Experiments were replicated at least three times, and representative blots are shown. Total protein of transgenic flies was extracted by RIPA Lysis Buffer (Dalian Meilun Biotechnology), and ∼40 µg protein extracts were loaded per lane on an SDS-PAGE gel, and transferred to a PVDF membrane. The primary antibody used was anti-HA monoclonal tag (Abcam, ab1424).
Senescence-associated galactosidase beta 1 staining
Senescence-associated galactosidase beta 1 (SA-β-Gal) staining was conducted using a Senescence Cells Histochemical Staining kit (Sigma-Aldrich) according to the manufacturer's instructions. Cells were visualized by Nikon eclipse Ti inverted microscope. The results were presented as the percentage of SA-β-Gal positive cells.
Drosophila stocks and construction of the transgenic flies
Transgenic constructs were made by cloning the Drosophila Atg18a gene and inserting it into a UAS promoter-driven transgenic vector (pUAST-attB-HA), resulting in pUAST-attB-HA-atg18a transgene. These constructs were microinjected in an 86F (III) 6110 transgenic strain (gift of Sun Yat-sen University) with the ATTP site inserted near 86F. Transgenic flies obtained were named UAS-atg18a. These transgenic flies were first made isogenic and then crossed to GeneSwitch-gal4 flies (gift of Sichuan Agricultural University) to induce the expression of the transgene under RU486 (w/v, 200 µM; Sigma-Aldrich, CAS 84371-65-3) control (Wu et al. 2016). The mating of UAS-atg18a with GeneSwitch-gal4 produced F1 flies with genome type of GS-gal4/+; UAS-atg18a/+. Only female flies with these genome types were further analyzed.
Husbandry and life span analysis
All stocks were raised on yeast powder (yeast powder 100 g/L H2O, agar powder 15 g/L H2O, sugar 50 g/L H2O, propionic acid 3 mL/L H2O, 10% methyl nuns 30 mL/L H2O) in plastic vials (10 flies/vial) containing appropriate food with at least 10 vials per condition at 25°C and 60% humidity on a 12-h:12-h light:dark cycle. Prior to the collection of F1, this generation of flies was allowed to mate for over 48 h (He and Jasper 2014; Piper and Partridge 2016). Then, these flies were transferred to fresh food for at least 2 d, during which deaths, censors, and carried-over flies were recorded. Maximum life span is defined as the median of the last 10% survivorship.
Data access
The RNA-seq data generated for this paper have been submitted to the Genome Sequence Archive (Wang et al. 2017) in BIG Data Center (BIG Data Center Members 2017), Beijing Institute of Genomics (BIG), Chinese Academy of Sciences (GSA, http://bigd.big.ac.cn/gsa), under accession number CRA000515.
Acknowledgments
We thank Miss Jian-Jun Jiang for her help in modifying the figures and Yikang Rong for providing Drosophila strain 86F (III) 6110 and Mingyao Yang for providing Drosophila strain Geneswitch-gal4. This work was supported by grants from Key Research Program of Frontier Sciences (QYZDB-SSW-SMC020) and the International Partnership Program (152453KYSB20160006) of the Chinese Academy of Sciences, National Natural Science Foundation of China (81671404, 81500670, 31460290, 81701394, 91749109, 81471966, 81672040, U1602226), National Program on Key Research and Development Project (2016YFA0100900), Yunnan Applied Basic Research Project (2017FA038, 2018FB121), the open project from State Key Laboratory of Genetic Resources and Evolution (GREKF16-10 to W.-W.C.), the Department of Science and Technology of Hainan Province (KJHZ2013-16), the Youth Innovation Promotion Association of Chinese Academy of Sciences (to Y.-H.H. and Q.-P.K.), and West Light Foundation of the Chinese Academy of Sciences (to F.-H.X.).
Author contributions: Q.-P.K. designed and supervised the project. F.-H.X. and N.L.-S.T. performed data analyses. Y.-H.H., X.-Q.C., and Q.Y. designed and performed the functional experiment in cell lines. J.Z. designed and supervised the Drosophila experiments. Y.Y. designed and performed the transgenic Drosophila experiments. G.C., L.Y., and W.Z. performed the transgenic Drosophila experiments. F.-H.X., Y.-H.H., Q.Y., X.-Q.C., and Y.-W.L. performed the literature search. W.-W.C., F.-H.X., X.-Q.C., Y.-W.L., D.J.Y., R.L., W.Z., X.P.L., and L.-Q.Y. collected the samples of longevity families. F.-H.X., Y.-H.H., and Q.-P.K. wrote the paper. W.-W.C., J.Z., X.-F.W., Y.Y., L.Y., G.C., and W.Z. revised the manuscript.
Footnotes
-
[Supplemental material is available for this article.]
-
Article published online before print. Article, supplemental material, and publication date are at http://www.genome.org/cgi/doi/10.1101/gr.220780.117.
- Received January 18, 2017.
- Accepted October 3, 2018.
This article is distributed exclusively by Cold Spring Harbor Laboratory Press for the first six months after the full-issue publication date (see http://genome.cshlp.org/site/misc/terms.xhtml). After six months, it is available under a Creative Commons License (Attribution-NonCommercial 4.0 International), as described at http://creativecommons.org/licenses/by-nc/4.0/.


