
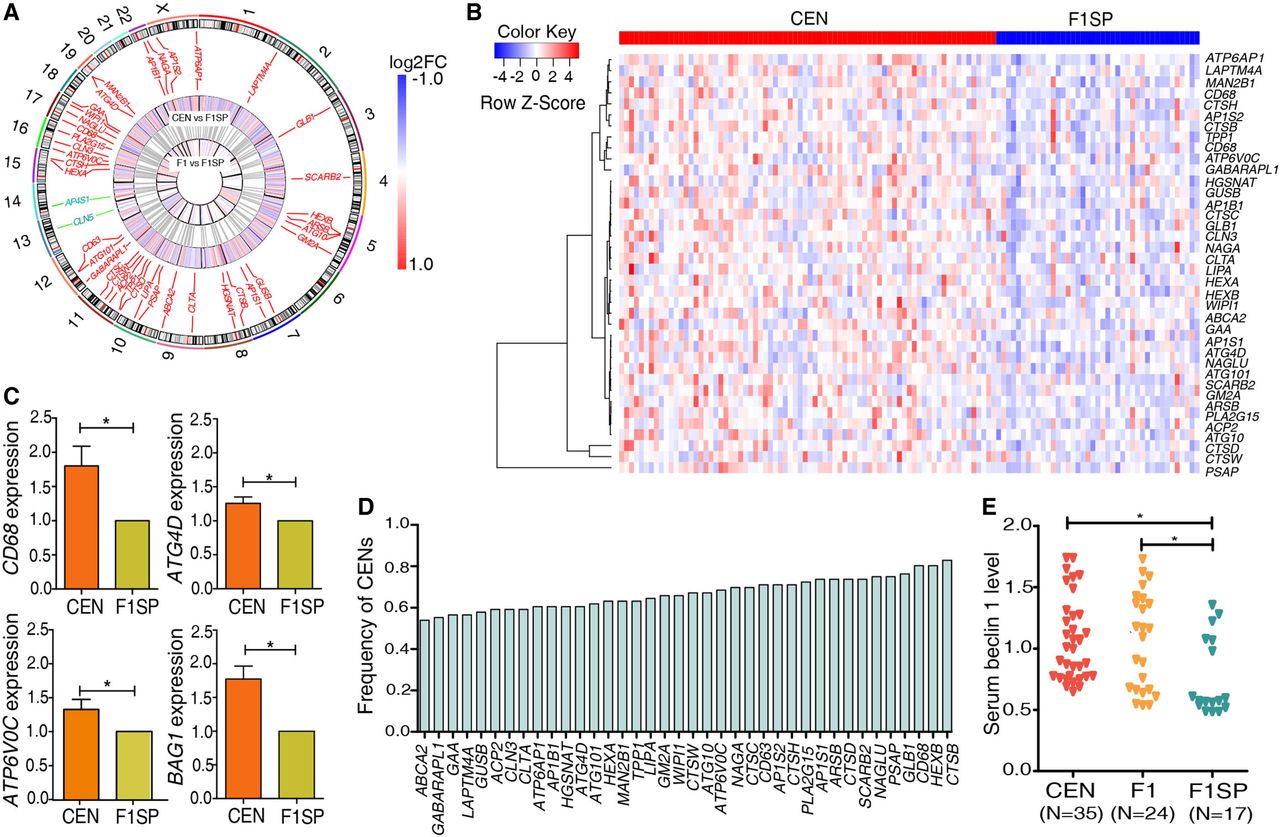
Figure 2.
SDEGs located in the autophagy-lysosomal pathway. (A) Circos representation of the SDEGs (Krzywinski et al. 2009). (B) Heat map plot for the up-regulated SDEGs in CENs compared to F1SPs. (C) qRT-PCR validation for expression of four SDEGs in 20 CENs and four F1SPs. (D) Frequencies of CENs harboring up-regulated autophagy-lysosomal SDEGs. (E) Serum beclin 1 levels in longevity families. (*) P < 5.0 × 10⁻².


