
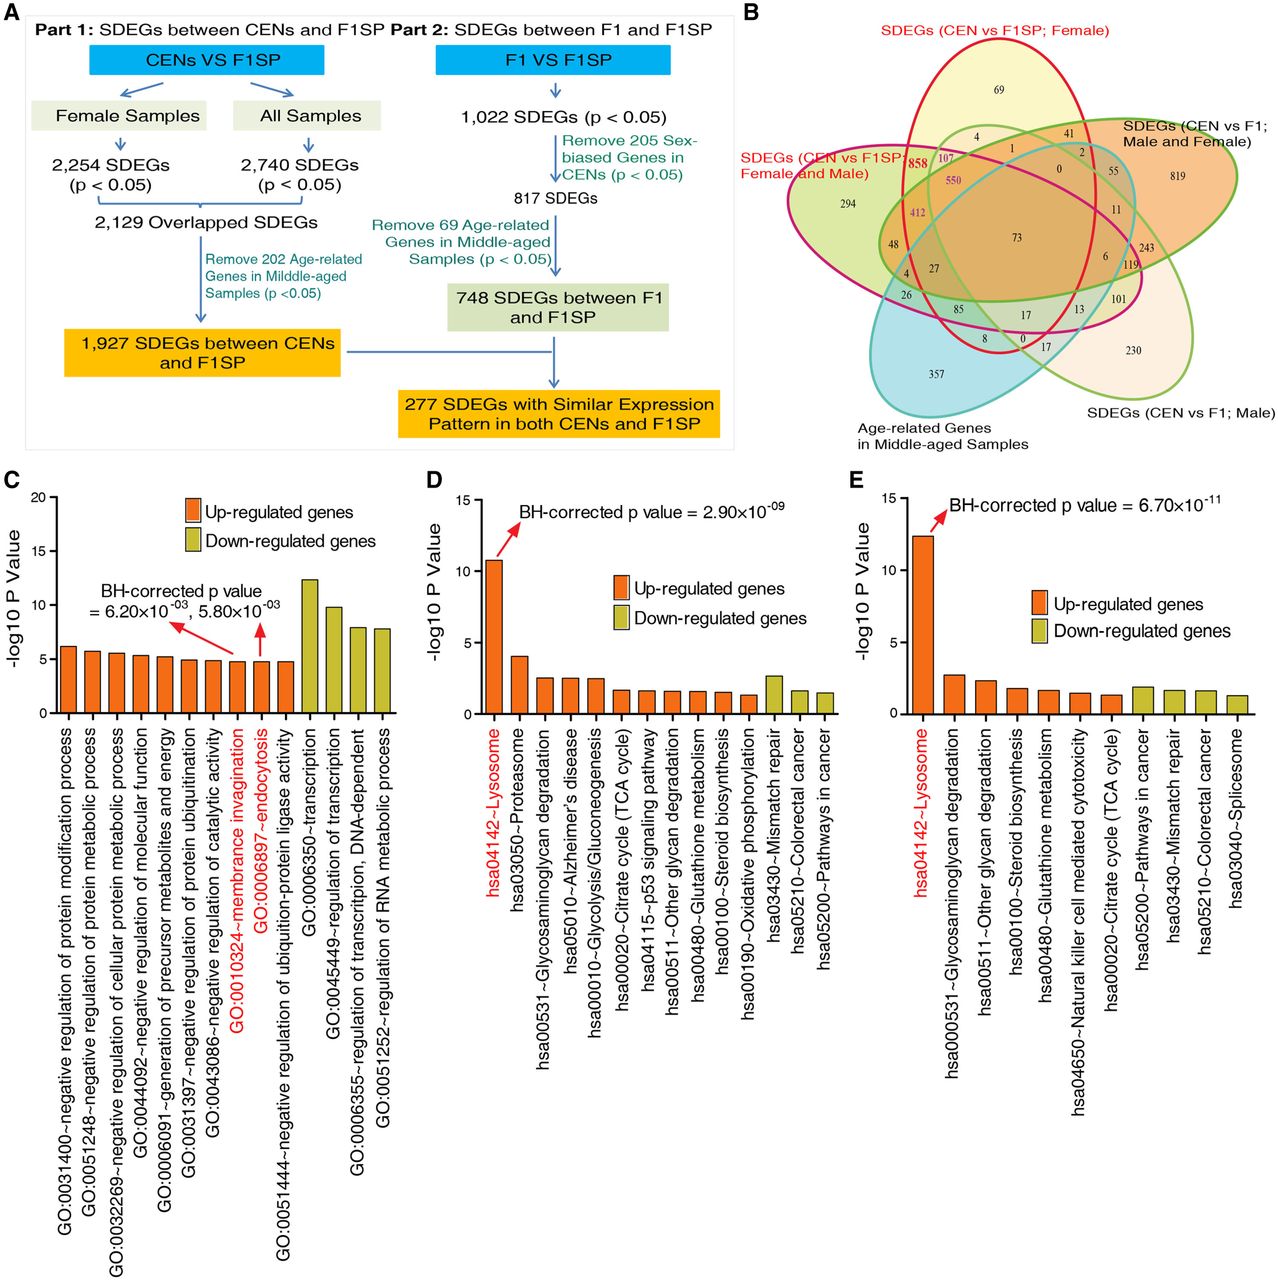
Figure 1.
Significantly differentially expressed genes (SDEGs) between the CEN and F1SP groups. (A) Workflow of data analysis. (B) Venn diagram for the SDEGs in CEN and F1SP samples. (C) Gene Ontology enrichment analysis on SDEGs meeting a threshold value of P < 5.0 × 10⁻². (D) KEGG pathway enrichment analysis on SDEGs meeting a threshold value of P < 5.0 × 10⁻². (E) KEGG pathway enrichment analysis on SDEGs meeting stringent threshold with BH-corrected P-value < 5.0 × 10⁻².


