
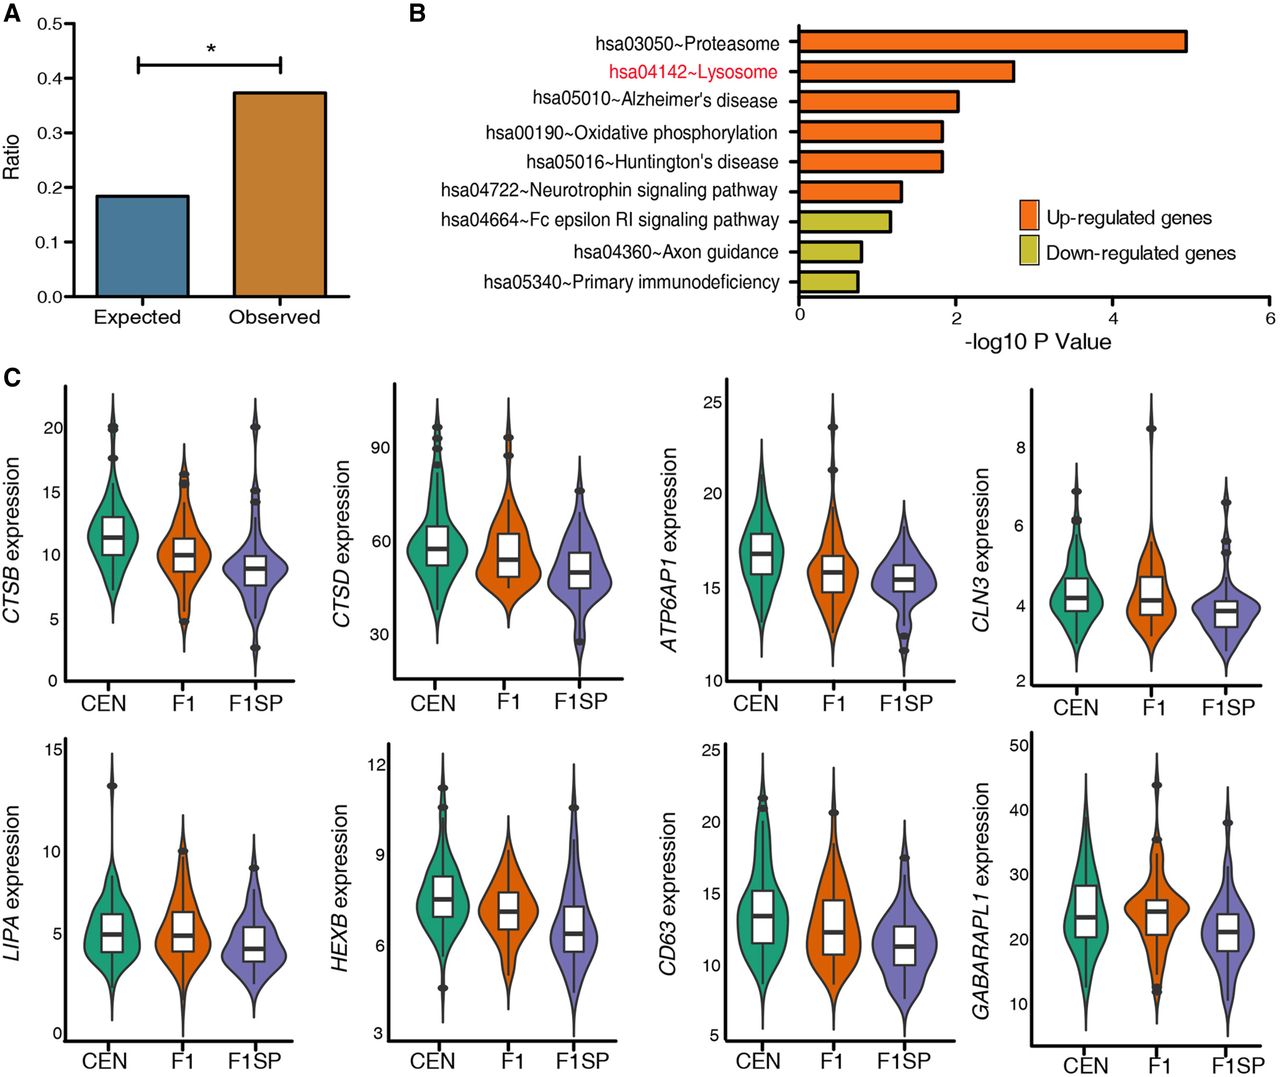
Figure 3.
SDEGs shared by CENs and F1s compared to F1SPs. (A) Expected and observed ratio of SDEGs in F1s from that of CENs. (B) KEGG pathway analysis. (C) Expression patterns of eight autophagy-lysosomal SDEGs in CEN families. (*) P < 5.0 × 10⁻².


