
Statistically robust methylation calling for whole-transcriptome bisulfite sequencing reveals distinct methylation patterns for mouse RNAs
Abstract
Cytosine-5 RNA methylation plays an important role in several biologically and pathologically relevant processes. However, owing to methodological limitations, the transcriptome-wide distribution of this mark has remained largely unknown. We previously established RNA bisulfite sequencing as a method for the analysis of RNA cytosine-5 methylation patterns at single-base resolution. More recently, next-generation sequencing has provided opportunities to establish transcriptome-wide maps of this modification. Here, we present a computational approach that integrates tailored filtering and data-driven statistical modeling to eliminate many of the artifacts that are known to be associated with bisulfite sequencing. By using RNAs from mouse embryonic stem cells, we performed a comprehensive methylation analysis of mouse tRNAs, rRNAs, and mRNAs. Our approach identified all known methylation marks in tRNA and two previously unknown but evolutionary conserved marks in 28S rRNA. In addition, mRNAs were found to be very sparsely methylated or not methylated at all. Finally, the tRNA-specific activity of the DNMT2 methyltransferase could be resolved at single-base resolution, which provided important further validation. Our approach can be used to profile cytosine-5 RNA methylation patterns in many experimental contexts and will be important for understanding the function of cytosine-5 RNA methylation in RNA biology and in human disease.
5-Methylcytosine (m5C) is the longest-known and best-understood epigenetic modification of DNA (Jones 2012). The genome-wide analysis of m5C patterns has greatly aided our understanding of epigenetic gene regulation (Bock et al. 2010). Changes in DNA methylation patterns have been found to underpin organismal development and cellular differentiation (Smith and Meissner 2013) and also provide valuable biomarkers for the detection of human diseases, including cancer (Heyn and Esteller 2012).
m5C also represents a well-known modification of RNA (Motorin et al. 2010). In comparison to DNA modifications, RNA modifications are substantially more diverse and complex, but their functional significance is only beginning to be elucidated (Gilbert et al. 2016; Tuorto and Lyko 2016). RNA modifications are particularly enriched in tRNAs, where they are often linked to translational regulation (Agris 2008). In this context, it has been shown that m5C modification of tRNA plays an important role in tRNA stability and in the regulation of translational fidelity (Schaefer et al. 2010; Tuorto et al. 2012, 2015; Blanco et al. 2014). Furthermore, m5C is also a widely conserved modification of rRNA, where it is implied in the quality control of ribosome biogenesis (Sharma et al. 2013; Bourgeois et al. 2015; Schosserer et al. 2015). These processes have been associated with a variety of human diseases (Blanco and Frye 2014).
m5C in RNA can be reliably detected using radioactive labeling and thin-layer chromatography (Hengesbach et al. 2008). However, this method only allows for an indirect quantification of global methylation levels. In comparison, high-performance liquid chromatography coupled to mass spectrometry (LC-MS) is more accurate and also allows the analysis of larger sample numbers (Thüring et al. 2016) but currently does not provide any information about the sequence context of the methylation marks. Several methods for the mapping of RNA cytosine methylation marks have been proposed (Hussain et al. 2013a; Li et al. 2016); however, they are usually based on indirect detection and thus represent approximations of the actual distribution. Direct mapping of RNA m5C marks in their native sequence context is currently only provided by RNA bisulfite sequencing (Schaefer et al. 2009). Bisulfite sequencing is based on the selective deamination of unmethylated cytosines, thus converting unprotected cytosines to uracils, followed by sequencing-based detection of methylation-related sequence polymorphisms (Clark et al. 1994). RNA bisulfite sequencing can accurately identify the presence of selected known methylation marks in tRNA and rRNA and has proven to be very useful for the molecular characterization of RNA cytosine-5 methyltransferases (Schaefer et al. 2009).
A few studies have also utilized RNA bisulfite sequencing to map RNA m5C marks at the transcriptome level and found evidence for the presence of m5C in mammalian mRNAs and noncoding RNAs (Squires et al. 2012; Hussain et al. 2013b; Khoddami and Cairns 2013; Amort et al. 2017). While it has been suggested that the human coding and noncoding transcriptome contains up to 10,000 methylation sites (Squires et al. 2012; Amort et al. 2017), the function of these marks has remained elusive. Furthermore, the available studies could not define a common set of substrate mRNAs or consensus methylation target sequences, which raised the possibility that some of the results were influenced by incomplete deamination, secondary structures, or other confounding factors that are known to affect bisulfite sequencing (Supplemental Table S1). It is also possible that methylation calling was influenced by insufficient statistical stringency.
Standard analytical pipelines for whole-transcriptome bisulfite sequencing (WTBS) data sets are currently not available. Furthermore, available tools do not sufficiently address the need for statistical approaches in the elimination of stochastic artifacts. Our approach addresses these issues and identifies profoundly different methylation patterns for mRNA, rRNA, and tRNA.
Results
Whole-transcriptome bisulfite sequencing libraries were prepared by separating total RNA samples into small (<200 nt) and long (>200 nt) RNA fractions. Depending on whether ribosomal RNA was also examined, an rRNA depletion step was included or not. The long fraction was fragmented to a size distribution appropriate for Illumina sequencing. Both fractions were DNase-digested, bisulfite converted, and end-repaired prior to cDNA library preparation for deep sequencing (Fig. 1A; Supplemental Methods). Sequenced reads were aligned with BSMAP (Xi and Li 2009) and subjected to initial quality control (read length ≥25 nt, aligned uniquely, forward and reverse reads at the same location). A closer examination of candidate methylation sites revealed many obvious false-positive sites that were related to inefficient conversion (i.e., tracts of three or more consecutive nonconverted Cs) or misalignment (Supplemental Fig. S1). We therefore implemented filters for the removal of these artifacts (for details, see Supplemental Methods). For methylation calling, a Poisson distribution was fit to each sample, and nonconversion P-values were calculated. Finally, available replicates were joined, and a combined nonconversion P-value was calculated (Fig. 1B; Methods).
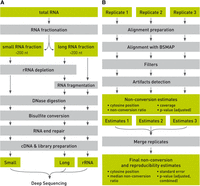
Schematic outline of whole-transcriptome bisulfite sequencing. The illustration shows key steps of library preparation (A) and data analysis (B).
For the present study, we sequenced and analyzed three replicates of bisulfite-converted libraries from mouse embryonic stem (ES) cells and various genotypes; 19,198,431 to 84,435,380 read pairs were available after sequencing of each sample (Supplemental Table S2). Bisulfite conversion rates were determined from unmethylated regions of rRNA and ranged from 98.4%–98.6% (Supplemental Table S2).
Initial data analysis using the mRNA data set from a single wild-type replicate showed that the vast majority of cytosines had conversion ratios >90% (Fig. 2A). To further analyze the nonconverted cytosine reads, we estimated the Poisson parameter λp as the count of nonconverted (Nn) cytosines separately within each coverage bin between 10× and 1200× (bins of 10 in coverage, extended to ensure a minimum of 60 data points were used; for further details, see Methods). The average and median coverages were 44× and 20×, respectively. The ratio r = λp/(Nn + Nc) was computed in each bin (where Nc = count of converted cytosines, N = Nn + Nc is the coverage). r had a tight distribution and showed no strong dependence on N. The median of r was 0.0164, with 95% confidence interval [0.0164; 0.0166] (Fig. 2B; Supplemental Table S3). Not surprisingly, (1 − λp/ coverage) was close to the deamination rate for this sample, which we calculated at 98.3% (Supplemental Table S2). Similarly, the ratios λp/coverage were obtained for all sequencing libraries (Supplemental Table S3) and showed only minor differences, in agreement with minor variations in bisulfite deamination efficiencies (Supplemental Table S2).
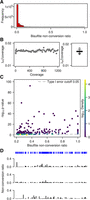
WTBS of mouse ES cell mRNA. (A) Frequency of bisulfite nonconversion (resp. methylation) ratios in mRNA. (B) Estimated Poisson rate λp/coverage as a function of coverage, as well as corresponding boxplot. (C) Bisulfite nonconversion ratio (x-axis) and −log of methylation P-values (y-axis) for 53,510 cytosines passing the 0.2 ratio threshold. Color indicates density (count of points per symbol area). (D) Cytosine position and methylation tracks for a representative mRNA transcript (NM_007984) in three replicates.
In subsequent steps, we compared nonconversion rates with the underlying distribution for each cytosine site where the nonconversion ratio is higher than λp/ coverage. Out of 3,338,384 cytosines, 53,510 had a nonconversion ratio higher or equal to 0.2 (Fig. 2C), consistent with earlier findings in human cell lines (Squires et al. 2012). However, only 266 out of 53,510 cytosines achieved statistical significance (P < 0.05) after Benjamini-Hochberg correction for multiple testing (Fig. 2C). Many significant sites exhibited a low nonconversion ratio of 0.2. Conversely, some cytosines with higher nonconversion ratios did not pass a 0.05 significance threshold (Fig. 2C). The large amount of nonsignificant P-values demonstrates the requirement for statistical approaches in the analysis of whole-transcriptome bisulfite sequencing data sets. This notion was confirmed when we analyzed nonconversion tracks for all three independent replicates (see representative example in Fig. 2D). In spite of the considerable overall deamination efficiency, all samples showed a persistent background of residual nonconversion, as well as individual sites with particularly reduced conversion rates (Fig. 2D). However, these patterns were usually not conserved between the three replicates, indicating that they are the result of nonreproducible methylation or random incomplete bisulfite deamination.
In subsequent analyses, we therefore examined the intersection of the three replicates (i.e., sites with a nonconversion rate consistently above the library nonconversion rate shown in Supplemental Table S2) to reliably identify methylated cytosines in mRNAs. Out of the 2,105,654 cytosines that had sufficient coverage in all three replicates, 56,940 had a bisulfite nonconversion ratio larger than λp/coverage. Remarkably, only 745 sites were significant (adjusted P-value <0.05) (Fig. 3A). Out of these candidates, only a small fraction combined high statistical significance with high methylation ratios (Fig. 3A; Supplemental Table S3). In order to assess the type I error of the method, we also evaluated the proportion of false positives resulting from the Poisson test by a simulation of several instances of a million stochastically nonconverted cytosines. This allowed us to reconstitute nonconversion ratios (Fig. 3B) and to calculate type I error estimates (Supplemental Fig. S2). Simulated nonconversion ratios were remarkably close to the experimental data (Fig. 3B), thus confirming that our simulations are realistic, and type I error was identical or lower than the significance level of 0.05 (Supplemental Fig. S2). Simulations of 10,000 cytosines methylated at various levels among 3 million cytosines provided statistical power estimates, using either Benjamini-Hochberg adjustment (Fig. 3C) or independent hypothesis weighting (Supplemental Methods; Supplemental Fig. S2) for multiple testing. The results showed that our analysis had the ability to reliably (statistical power = 99.9 ± 0.04%) detect sites with as low as 20% nonconversion at a coverage of more than 20×. A coverage of more than 20× was obtained for >50% of the cytosine residues in our sequencing data sets (Fig. 3D), thus demonstrating sufficient statistical power for a meaningful data analysis.
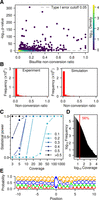
Statistical analysis of WTBS data sets. (A) Bisulfite nonconversion ratio (x-axis) and −log of methylation P-values (y-axis) for 56,940 cytosines with ratio >λp/coverage that are common to the three wild-type replicates. Color indicates density (count of points per symbol area). (B) Number of cytosines and nonconversion ratios, as determined experimentally (left) or by simulation (right). (C) Statistical power stratified by coverage and by nonconversion ratio. (D) Histogram of coverage in a representative (Wt1L) sequencing data set. The red line indicates a coverage of 20×. (E) Logo plot for all cytosines with a ratio >0.1 and significant P-value (<0.05) in at least one sample.
However, even after statistical analysis, several candidate sites remained that could not be considered bona fide methylation sites. For example, site C153 within mRNA NM_001199350 had a median nonconversion ratio of 1.0 and an adjusted P-value of 6.6 × 10−84 but actually presented a C>T sequence polymorphism at this specific position. As a consequence, a read containing the T-variant multiply aligned to both the NM_001199350 sequence and to its T-containing variant and was therefore discarded. However, C-containing reads would align uniquely and were therefore maintained in the analysis, resulting in an overestimation of the methylation ratio. To further address the reproducibilty of the remaining candidate methylation sites, we selected 10 candidates with the lowest adjusted P-values and four additional candidates with a methylation level close to 1.0 and significant adjusted P-values in a subset of samples (Supplemental Table S4) for an amplicon-based resequencing approach. The results showed that four out of 14 analyzed cytosines were unmethylated (Supplemental Fig. S3; Supplemental Table S4). This again suggests that the very low number of candidate methylation sites identified in our analysis contains a certain amount of false positives. In agreement with this notion, candidate methylation sites also failed to reveal any pattern specificity, as we could not identify any clear enrichment for specific sequence contexts (Fig. 3E).
The prevalence of m5C in mRNA was further analyzed by LC-MS/MS. mRNA was enriched from total RNA by two consecutive rounds of polyA selection, followed by small RNA depletion and two consecutive rounds of rRNA depletion (Fig. 4A). Samples were taken at each step and analyzed by RNA-seq for sample composition and by LC-MS/MS for base modifications. The sequencing results showed that the enrichment protocol resulted in a strong increase of mRNA reads (Fig. 4B). However, a significant (7.1%) fraction of rRNA reads remained after the final step (Fig. 4B), probably resulting from ineffective rRNA fragment depletion. LC-MS/MS analysis of all samples demonstrated a strong reduction of m5C (Fig. 4C) that closely corresponds to the rRNA depletion observed by sequencing. Of note, we also failed to detect any evidence for the presence of the oxidated derivative of m5C, 5-hydroxymethylcytosine, in any of our samples (Fig. 4C). Very similar results were obtained in parallel analyses of Drosophila S2 cell RNA samples (Supplemental Fig. S4). Based on a detection limit of 1 fmol (Supplemental Fig. S5), this finding corresponds to a maximum hm5C content of 50 ppm (0.005%) per C residue. Our results thus contrast the antibody-based detection of 5-hydroxymethylcytosine as a prevalent mRNA modification in Drosophila (Delatte et al. 2016). Furthermore, our results also suggest that mRNAs are very sparsely methylated or not methylated at all.
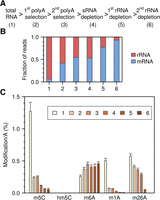
LC-MS/MS analysis of RNA samples from mouse ES cells that were subjected to multistep mRNA enrichment. (A) Basic outline of the mRNA enrichment protocol. (B) Relative amounts of mRNA and rRNA as determined by RNA-seq. The proportion of tRNA reads was <1% for all samples. (C) Modification analysis of m5C, hm5C, m26A, m6A, and m1A content, relative to A content.
While the cytosine-5 methylation status of mRNAs is controversial, rRNAs and tRNAs have long been known to carry defined methylation marks (Machnicka et al. 2013). We therefore compared the methylation frequencies between these three types of RNA. In mRNA, only 1090 cytosines out of 764,645 had a significant bisulfite nonconversion ratio larger than 0.1, which corresponds to a hypothetical mRNA methylation level of 0.1% (Fig. 5A). In contrast, methylation levels appeared to be substantially higher in rRNA (1.3%) and in tRNA (8.3%), which is consistent with the known prevalence of m5C in these RNAs (Fig. 5A). Similarly, when we systematically evaluated the reproducibility of the nonconversion ratio for all candidate methylation sites, standard errors appeared substantially higher for mRNA than for rRNA and tRNA (Fig. 5B). This finding again suggests that tRNAs and rRNAs are methylated differently from mRNAs.
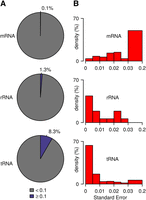
Methylation frequencies and reproducibility in mRNA, rRNA, and tRNA. (A) Proportion of nonconverted cytosines (coverage ≥ 20×). (B) Standard error (coverage ≥ 20× and nonconversion ratio ≥0.1). Values are based on triplicate wild-type data sets for mRNA and tRNA and on duplicate data sets for rRNA.
Finally, we also investigated the effect of specific enzymes on RNA m5C patterns. To this end, we further developed our computational pipeline to provide a standard analysis of specific types of RNA and to compare methylation patterns between genotypes. As a proof of principle, we determined the effects of the presence or absence of the tRNA methyltransferase DNMT2 on tRNA, rRNA, and mRNA methylation levels. This identified numerous known tRNA m5C sites (Fig. 6A; Supplemental Table S5). In addition, our results also demonstrate that DNMT2 is a highly specific enzyme, as Dnmt2 mutants specifically lost methylation at C38 in tRNA(Asp), tRNA(Gly), and tRNA(Val) (Fig. 6A). The analysis of rRNA revealed the presence of two novel and completely methylated cytosines in 28S rRNA, namely, C3438 and C4099 (Fig. 6B). These marks were not affected in Dnmt2 knockouts, and their sequence contexts (Supplemental Fig. S6) were identical to the m5C marks described in Homo sapiens and Arabidopsis thaliana rRNA (Burgess et al. 2015), consistent with evolutionary conservation of rRNA methylation patterns. In addition, we also found two cytosines with partial (C909, ratio equal to 0.5) and almost complete (C911, ratio equal to 0.8) methylation in mitochondrial rRNA, which is consistent with published findings (Metodiev et al. 2009). We also analyzed mRNA methylation in Dnmt2 knockouts and could not detect any DNMT2-dependent mRNA methylation candidates (Fig. 6C). Finally, because a recent study has suggested a role of TET dioxygenases in the demethylation of Drosophila mRNAs (Delatte et al. 2016), we also investigated the mRNA methylation pattern of mouse ES cells that lack all three mammalian Tet homologs (Dawlaty et al., 2014). A comparison with mRNA methylation patterns from wild-type cells again provided very little evidence for mRNA methylation (Fig. 6D). A very small number of cytosines showed a reduced nonconversion ratio in the TET-deficient cells (Fig. 6D). However, nonconversion ratios of TET-deficient libraries were systematically reduced by 0.004 (P-value of a two-sample t-test <2.2 × 10⁻¹⁶), which can be explained by a more efficient bisulfite deamination (Supplemental Table S2). As such, our results fail to provide any evidence for TET-mediated demethylation of mRNAs in mouse ES cells.
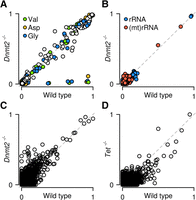
Site-specific methylation analysis by whole-transcriptome bisulfite sequencing. Scatter plots show nonconverted cytosines for tRNA (A), rRNA (B), and mRNA (C) in wild-type and Dnmt2 knockout ES cells. Methylation ratios are specifically reduced for C38 of tRNA(Asp), tRNA(Gly), and tRNA(Val) in Dnmt2 knockouts. (D) Scatter plot for mRNA in wild-type and TET-deficient ES cells.
Together, these results comprehensively illustrate the robustness of our approach for the transcriptome-wide analysis of cytosine-5 methylation patterns at single-base resolution.
Discussion
Previous whole-transcriptome bisulfite sequencing pipelines often relied on cutoff-based methylation calling approaches (typically coverage and nonconversion ratio more than 10× and >20%, respectively) (Supplemental Table S6). Improved accuracy was achieved by a more stringent quality control and the removal of nonconverted reads (Edelheit et al. 2013; Blanco et al. 2014), while reproducibility was ensured by the inclusion of replicates (Amort et al. 2013; Blanco et al. 2014). Most recently, it was suggested to integrate several methods derived from the DNA methylation field, including generic statistical tests and a custom low-redundancy reference (Rieder et al. 2016; Amort et al. 2017). However, concerns about false positives from stochastic nonconversion events and other sources of artifacts have remained (Hussain et al. 2013a; Gilbert et al. 2016; Helm and Motorin 2017). We have now developed a pipeline for the accurate and reproducible analysis of m5C marks in whole-transcriptome bisulfite sequencing data sets. Tailored filtering addressed most sequencing and alignment artifacts, which is particularly important for the short low-complexity reads that result from bisulfite conversion. In particular, we tested for residual misalignments and discarded them if significant. Statistical modeling of bisulfite nonconversion was used to characterize and eliminate random nonconversion artifacts. Simulations confirmed a high statistical power of our pipeline, using Benjamini-Hochberg adjustment for multiple testing or using independent hypothesis weighting for cytosines with a nonconversion ratio ≥20%. The inclusion of replicates allowed us to identify candidate sites that are reproducibly methylated. Also, standard errors were estimated on replicates, indicating how variable methylation is at each cytosine. The application of this pipeline on various data sets provided novel insight into the distribution of m5C in the mouse transcriptome.
A recent study detected m5C in prokaryotic mRNA, but not in yeast mRNA, suggesting that cytosine-5 mRNA methylation may be restricted to prokaryotic transcriptomes (Edelheit et al. 2013). Our results are consistent with these findings and argue against the notion that m5C is a widespread modification of coding and noncoding RNAs in mammals (Squires et al. 2012). Our results are also in agreement with earlier chromatographical studies that have failed to reveal any evidence for cytosine-5 methylation in mammalian mRNA (Desrosiers et al. 1974; Adams and Cory 1975; Salditt-Georgieff et al. 1976). Alternatively, the small amounts and high variability could indicate a rapid turnover of m5C in mRNA.
Whether the few remaining candidate sites identified in our analysis represent genuine methylation marks or reproducible deamination artifacts remains to be determined by truly orthogonal approaches, such as sequence-specific mass spectrometric analysis (Ross et al. 2016) or single-molecule real-time sequencing (Vilfan et al. 2013). It should be noted that bisulfite deamination artifacts can be caused by residual proteins that bind to nucleic acids and/or by RNA secondary structures (Supplemental Table S1), which could provide an explanation for their reproducibility.
As bisulfite sequencing cannot discriminate between m5C and hm5C (Huang et al. 2010), our results predict that hm5C also represents a very rare or absent modification in mRNA from mouse ES cells, consistent with mass spectrometry data obtained in our study and by others (Fu et al. 2014). Recent data suggesting high levels of hm5C in the Drosophila transcriptome (Delatte et al. 2016) may have been influenced by antibody-based detection methods. Alternatively, high levels of cytosine modification in Drosophila mRNA may also be a tissue-specific feature. Additional data based on direct detection methods will be required to clarify this issue.
In conclusion, our results establish whole-transcriptome bisulfite sequencing as a powerful method for a single-base resolution analysis of m5C RNA methylation patterns and suggest profound differences between the patterns of tRNA, rRNA, and mRNA methylation. Our approach identified all known methylation marks in tRNA and two previously unknown but evolutionarily conserved marks in mouse 28S rRNA. Furthermore, the catalytic activity of the DNMT2 RNA methyltransferase was resolved at single-base resolution. This suggests that whole-transcriptome bisulfite sequencing can be used to profile cytosine-5 RNA methylation patterns in many experimental contexts ranging from basic biological processes to human disease.
Methods
Cell culture, RNA isolation, and library preparation
Mouse ES cells were grown on a primary MEF feeder layer in standard medium. RNA isolation was performed with TRIzol (Ambion). Thirty micrograms of total RNA was fractionated into a long (>200 nt) and small (<200 nt) RNA fraction and depleted for rRNA as indicated. Small and long fractions were DNase-digested and bisulfite converted using the EZ RNA Methylation Kit (Zymo Research). After stepwise RNA end repair and further purification, cDNA synthesis and library preparation was carried out using the NEBNext Small RNA Library Prep Set, followed by paired-end sequencing on an Illumina HiSeq 2000 platform. Further details are provided in Supplemental Methods.
454 bisulfite sequencing
454 Life Sciences (Roche) bisulfite sequencing was performed using the EZ RNA Methylation Kit (Zymo Research). PCR primers are provided in Supplemental Table 7. Sequenced reads from individual amplicons were aggregated in heatmaps. Further details are provided in Supplemental Methods.
LC-MS/MS analysis
LC-MS/MS analysis of RNA from mouse ES cells and Drosophila S2 cells (cultured under standard conditions) was performed as described previously (Kellner et al. 2014). Further details are provided in Supplemental Methods.
Reference sequences
Separate references were generated for tRNA, rRNA, and mRNA: First, tRNA genomic sequences for mouse mm9 were retrieved from the genomic tRNA database. Duplicate sequences were removed. In case of bisulfite-conversion duplicates (i.e., two sequences becoming identical upon cytosine to thymine conversion), the duplicate sequence containing thymine was removed. This allows methylation detection in such sequences, even though the methylation ratio cannot be determined here. Second, sequences for 5.8S, 18S, and 28S rRNAs were retrieved from the BK000964.3 reference sequence in the NCBI nucleotide database, whereas mitochondrial rRNA sequences were obtained from Ensembl GRCm38 (release 81). We chose to keep only one variant for each main Svedberg category of rRNA (5.8S, 18S, 28S) so as to not discard reads that would otherwise align to multiple rRNA reference sequences. Third, mRNA transcript sequences were downloaded from NCBI RefSeq for mouse mm9. To ensure that reads uniquely align to mRNA, this reference was complemented with controls consisting of tRNA sequences and a comprehensive collection of noncoding RNA sequences (BK000964.3, other rRNA variants from SILVA database (https://www.arb-silva.de/) and Ensembl, and noncoding RNA sequences from NCBI RefSeq).
Sequence alignment
Reads were trimmed with a quality cutoff of 30 for each base (corresponding to a confidence level of 99.9%) and aligned using BSMAP (Xi and Li 2009), which allows C-T base modifications without flagging them as mismatches. We used a 3% mismatch rate and full sequence usage in BSMAP (parameters: -s 12 -v 0.03 -g 0 -w 1000 -S 0 -p 1 -V 1 -I 1 -n 0 -r 2 -u -m 15 -x 1000). Resulting aligned reads were kept only if their length was ≥25 nt, if they aligned uniquely, and if both forward and reverse pairs were located at the same positions.
Methylation calling
Reliable distinction between stochastic nonconversion and methylation (or other events) depends on a valid null hypothesis
for the underlying distribution of stochastic nonconversion. Thus, we assessed the adequacy of the empirical null distribution
formed by the nonconverted cytosine counts (restricted to nonconversion lower than 0.3) to the binomial  , negative binomial
  , or Poisson
  distributions. We estimated the parameters of each distribution and calculated the data log-likelihood using function “fitdistr”
in R, where the log-likelihood is denoted
distributions. We estimated the parameters of each distribution and calculated the data log-likelihood using function “fitdistr”
in R, where the log-likelihood is denoted  ,
,  , or
, or  and depends on the vector containing the count of nonconverted Cs at each site, X; on the estimated distribution parameters set,
  ; and on the coverage. Bins of 10 in coverage, extended to ensure a minimum of 60 data points (number of cytosine positions
falling within this bin) were used: {10, 20, 30, 40, 50, 60, 80,…, 280, 300, 350,…550, 600, 1000, 2000, etc.}. Since the parameters
of the binomial distribution could not be found using ‘fitdistr,’ we estimated the binomial parameters
; and on the coverage. Bins of 10 in coverage, extended to ensure a minimum of 60 data points (number of cytosine positions
falling within this bin) were used: {10, 20, 30, 40, 50, 60, 80,…, 280, 300, 350,…550, 600, 1000, 2000, etc.}. Since the parameters
of the binomial distribution could not be found using ‘fitdistr,’ we estimated the binomial parameters  and
and  and generated the corresponding values of
  . At all coverages, we obtained
  , so that we considered
  a less useful assumption than
  or
or  . Because
  offered a minimal and coverage-independent parameterization λp/coverage (λp denotes the estimate of the Poisson parameter) (Fig. 2B), we made the assumption that the theoretical null distribution of bisulfite nonconversion in this data set follows
  . Subsequently, we tested nonconverted read counts at each specific cytosine against the null hypothesis that the counts follow
 (Poisson exact test in R, adjustment of P-values for multiple testing with Benjamini-Hochberg method, significance level α = 0.05). A significant result was interpreted
as a possibly methylated cytosine and qualified the site as a valid candidate. Because secondary structures and nucleic acid
binding proteins cause reproducible bisulfite deamination artifacts (Warnecke et al. 2002), we could not use raw P-values for subsequent tests, as this would lead to significance for most of these artifacts. However, Fisher's method has
shown robustness in a variety of contexts where the underlying assumptions are not strictly met (Derkach et al. 2013; Rau et al. 2014). We therefore summed the log-transformed adjusted P-values of cytosines that had a nonconversion ratio higher than λp/coverage in each of the three replicates and combined them using a χ2 test on their sum. This allowed us to identify cytosines that robustly have small adjusted P-values in all three replicates. The methylation calling methods described in this paragraph are implemented in the R package
BisRNA.
(Poisson exact test in R, adjustment of P-values for multiple testing with Benjamini-Hochberg method, significance level α = 0.05). A significant result was interpreted
as a possibly methylated cytosine and qualified the site as a valid candidate. Because secondary structures and nucleic acid
binding proteins cause reproducible bisulfite deamination artifacts (Warnecke et al. 2002), we could not use raw P-values for subsequent tests, as this would lead to significance for most of these artifacts. However, Fisher's method has
shown robustness in a variety of contexts where the underlying assumptions are not strictly met (Derkach et al. 2013; Rau et al. 2014). We therefore summed the log-transformed adjusted P-values of cytosines that had a nonconversion ratio higher than λp/coverage in each of the three replicates and combined them using a χ2 test on their sum. This allowed us to identify cytosines that robustly have small adjusted P-values in all three replicates. The methylation calling methods described in this paragraph are implemented in the R package
BisRNA.
Calculation of deamination rates
Deamination rates were calculated as the count of converted cytosines divided by the sum of converted and nonconverted cytosines. This calculation is carried out on nuclear and mitochondrial rRNA. Known methylation sites in rRNA were removed from the calculations.
Software availability
BisRNA is available as a source R package in the Supplemental Information and from the Comprehensive R Archive Network (https://cran.r-project.org/web/packages/BisRNA/).
Data access
The sequencing data from this study have been submitted to the NCBI Gene Expression Omnibus (GEO; http://www.ncbi.nlm.nih.gov/geo/) under accession number GSE81825.
Acknowledgments
We thank Matthias Schaefer and Sebastian Bender for their contributions during early stages of this project and the DKFZ Genomics and Proteomics Core Facility for sequencing services. We also thank Günter Raddatz and Miriam Kesselmeier for critical discussion of the simulations and Michaela Frye for critical reading of the manuscript. This work was supported by grants from Landesstiftung Baden-Württemberg (Forschungsprogramm “nicht-kodierende RNAs” ncRNA_019) to F.L. and Deutsche Forschungsgemeinschaft (Priority Programme 1784) to M.H. and F.L.
Footnotes
-
[Supplemental material is available for this article.]
-
Article published online before print. Article, supplemental material, and publication date are at http://www.genome.org/cgi/doi/10.1101/gr.210666.116.
-
Freely available online through the Genome Research Open Access option.
- Received May 30, 2016.
- Accepted June 8, 2017.
This article, published in Genome Research, is available under a Creative Commons License (Attribution-NonCommercial 4.0 International), as described at http://creativecommons.org/licenses/by-nc/4.0/.


