
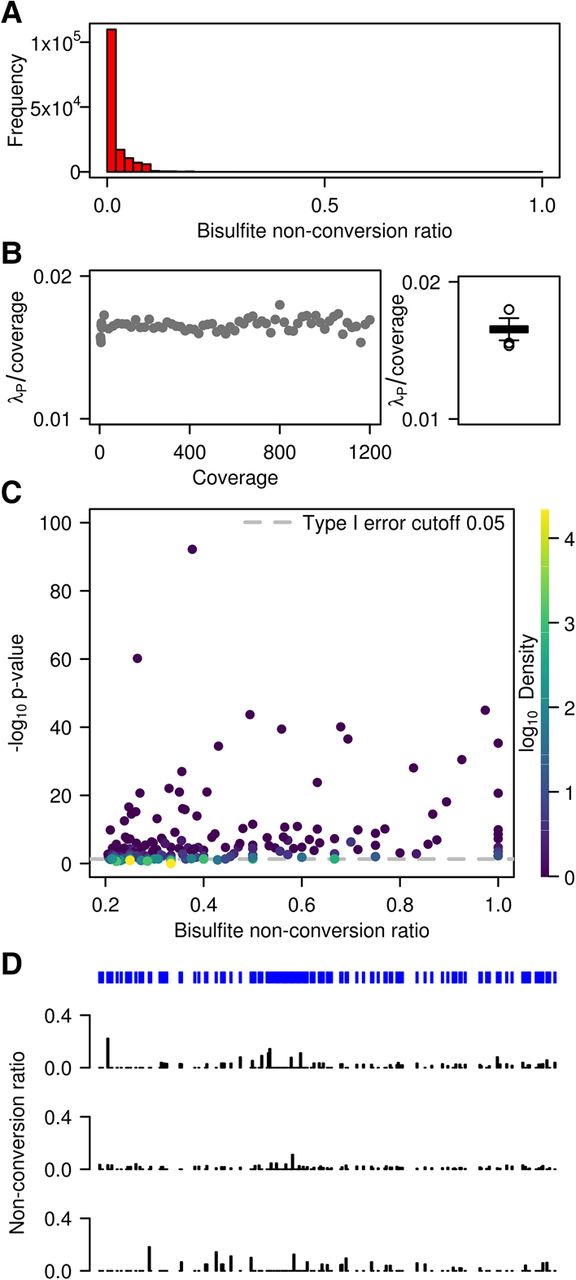
Figure 2.
WTBS of mouse ES cell mRNA. (A) Frequency of bisulfite nonconversion (resp. methylation) ratios in mRNA. (B) Estimated Poisson rate λp/coverage as a function of coverage, as well as corresponding boxplot. (C) Bisulfite nonconversion ratio (x-axis) and −log of methylation P-values (y-axis) for 53,510 cytosines passing the 0.2 ratio threshold. Color indicates density (count of points per symbol area). (D) Cytosine position and methylation tracks for a representative mRNA transcript (NM_007984) in three replicates.


