
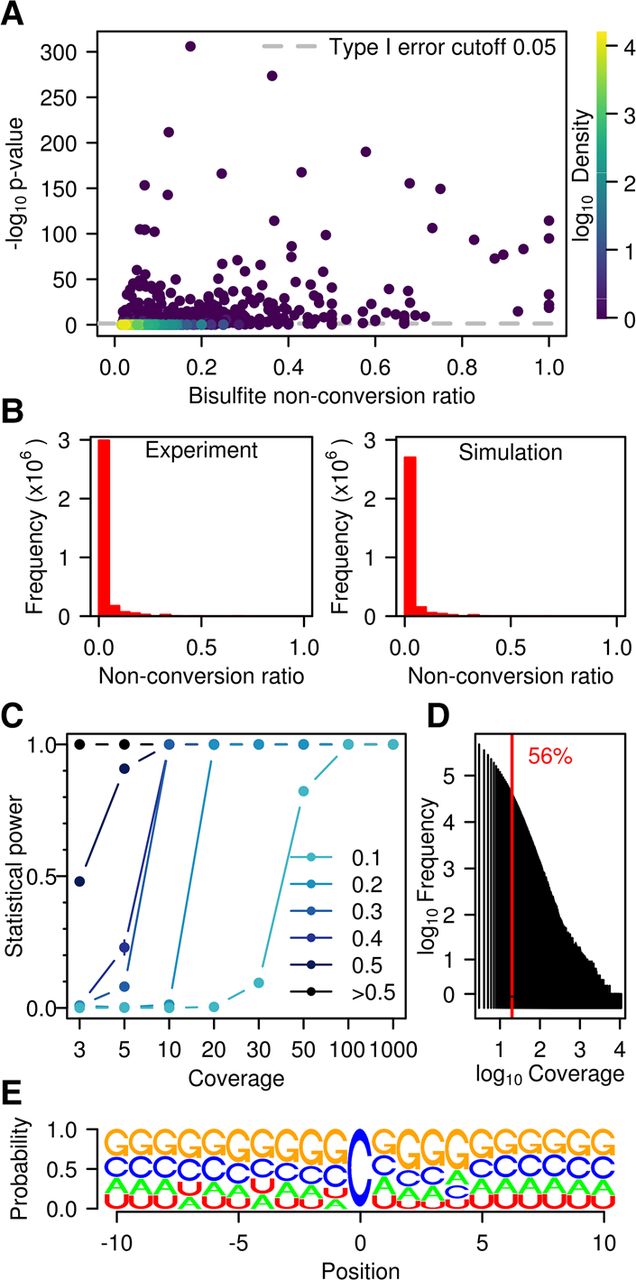
Figure 3.
Statistical analysis of WTBS data sets. (A) Bisulfite nonconversion ratio (x-axis) and −log of methylation P-values (y-axis) for 56,940 cytosines with ratio >λp/coverage that are common to the three wild-type replicates. Color indicates density (count of points per symbol area). (B) Number of cytosines and nonconversion ratios, as determined experimentally (left) or by simulation (right). (C) Statistical power stratified by coverage and by nonconversion ratio. (D) Histogram of coverage in a representative (Wt1L) sequencing data set. The red line indicates a coverage of 20×. (E) Logo plot for all cytosines with a ratio >0.1 and significant P-value (<0.05) in at least one sample.


